3:30 p.m. New York time
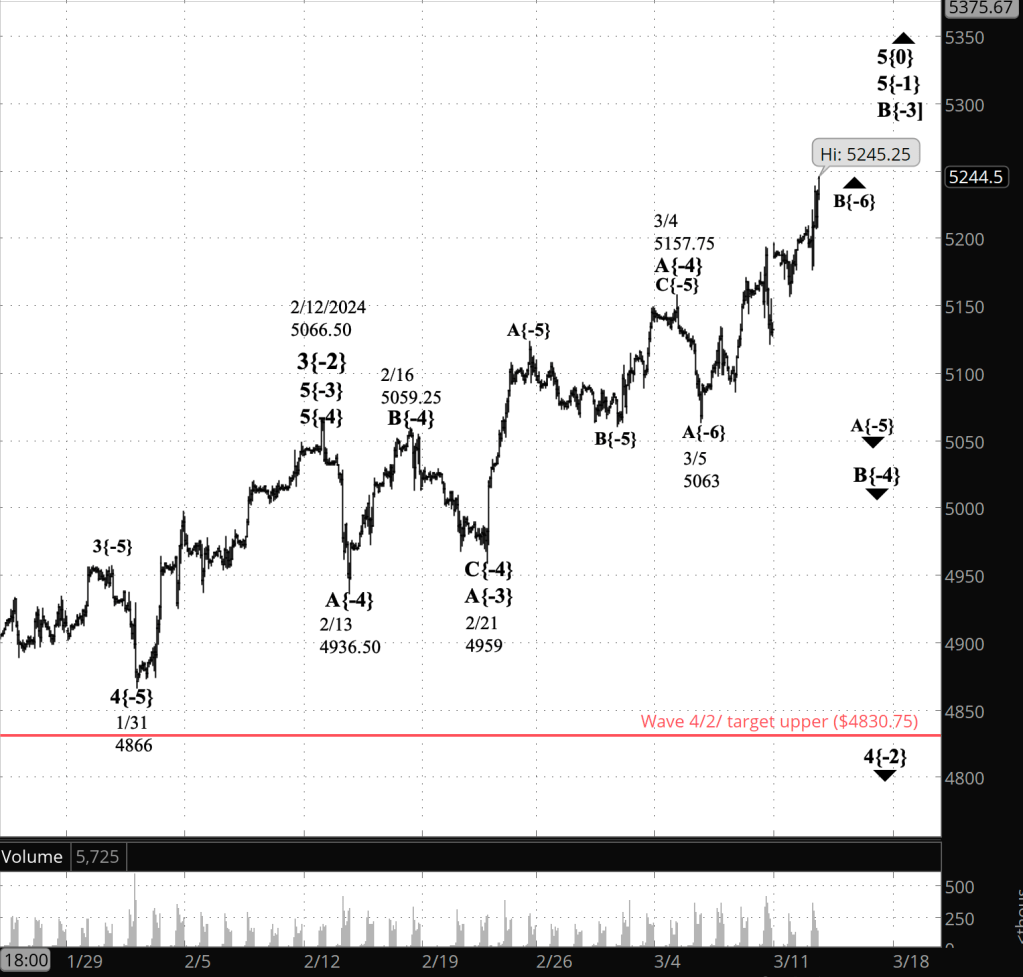
Half an hour before the closing bell. The S&P 500 futures so far have remained below the overnight peak, dropping into the 5220s and then rising back before dropping still lower as the closing bell approached. My analysis is unchanged from this morning. I’ve updated the chart.
9:35 a.m. New York time
What’s happening now? The S&P 500 E-mini futures swung between the 5230s and the 5250s overnight, reaching a new high, 5247.50.
What does it mean? Elliott Wave Theory sees the chart as a rising B wave that began on March 4 continuing to search for its end point. Stock movements, always, are battles between the bulls and the bears. Team Bulls at this point continues to have an edge.
The B wave is a small part of a much larger 4th-wave downward correction that began on February 12. The correction’s price target, reflecting a tendency of 4th waves taking the Flat form, is within a upper boundary of 4830.75 (the red line on the chart) and 4702.
When wave B is complete, it will be followed by a declining C wave that will complete the parent wave, an A wave. Given the waves line-up, the downward correction will be on the chart for awhile.
See the “What does Elliott wave theory say” section, below, for an inventory of current waves, including where they stand in the fractal structure of the chart. See the “Reading the chart” section for a discussion of the fractal structure and a wave’s degree within it.
What are the alternatives? It’s getting a bit repetitious, but I have some doubts about the degree labeling used in my analysis. The present B wave seems overly long for its place in the fractal structure. Figuring it out will be a project for the weekend.

[S&P 500 E-mini futures at 3:30 p.m., 80-minute bars, with volume]
What does Elliott wave theory say? Here are the waves that underly the analyses.
Principal Analysis:
- Wave 5{0}, an expanding Diagonal Triangle, began on December 26, 2018.
- Within it, an uptrend, wave 5{-1}, began on October 13, 2022 and is underway.
- Wave 5{-1} is the parent wave of a downward correction, wave 4{-2}, that began on February 12, 2024.
- Wave 4{-2} is in its second subwave, wave B{-3}, which in turn is in wave B{-4}, its middle subwave.
- Wave B{-4} is in its initial subwave, wave A{-5}.
- Internally, wave A{-5} is in its middle subwave, wave B{-6}.
We Are Here.
These are the waves currently in progress under my principal analysis. Each line on the list shows the wave number, with the subscript in curly brackets, the traditional degree name, the starting date, the starting price of the S&P 500 E-mini futures, and the direction of the wave.
- S&P 500 Index:
- 5{+3} Supercycle, 7/8/1932, 4.40 (up)
- 5{+2} Cycle, 12/9/1974, 60.96 (up)
- 5{+1} Primary, 3/6/2009, 666.79 (up)
- 5{0} Intermediate, 12/26/2018, 2346.58 (up)
- S&P 500 Futures and index:
- 5{-1} Minor, 10/13/2022, 3502 (up) (futures), 3491.58 (up) (index)
- S&P 500 Futures:
- 4{-2} Minute, 2/12/2024, 5066.50 (down)
- B{-3} Minuette, 2/21/2024, 4959 (up)
Reading the chart. Price movements — waves – – in Elliott wave analysis are labeled with numbers within trending waves and letters with corrective waves. The subscripts — numbers in curly brackets — designate the wave’s degree, which, in Elliott wave analysis, means the relative position of a wave within the larger and smaller structures that make up the chart. R.N. Elliott, who in the 1930s developed the form of analysis that bears his name, viewed the chart as a complex structure of smaller waves nested within larger waves, which in turn are nested within still larger waves. In mathematics it’s called a fractal structure, where at every scale the pattern is similar to the others.
Learning and other resources. Elliott wave analysis provides context, not prophecy. As the 20th century semanticist Alfred Korzybski put it in his book Science and Sanity (1933), “The map is not the territory … The only usefulness of a map depends on similarity of structure between the empirical world and the map.” And I would add, in the ever-changing markets, we can judge that similarity of structure only after the fact.
See the menu page Analytical Methods for a rundown on where to go for information on Elliott wave analysis.
By Tim Bovee, Portland, Oregon, March 13, 2024
Disclaimer
Tim Bovee, Private Trader tracks the analysis and trades of a private trader for his own accounts. Nothing in this blog constitutes a recommendation to buy or sell stocks, options or any other financial instrument. The only purpose of this blog is to provide education and entertainment.
No trader is ever 100 percent successful in his or her trades. Trading in the stock and option markets is risky and uncertain. Each trader must make trading decisions for his or her own account, and take responsibility for the consequences.
License
All content on Tim Bovee, Private Trader by Timothy K. Bovee is licensed under a Creative Commons Attribution-ShareAlike 4.0 International License.
Based on a work at www.timbovee.com.


You must be logged in to post a comment.