Options Trades 3/1/2024: XSP

Symbols traded: XSP, short Iron Fly (3DTE)

I entered a short Iron Fly position on XSP, which tracks the S&P 500, on a Friday and exited the next Monday, shortly after the opening bell, for a 36.4% profit. My profit goal was 25%.

XSP short Iron Fly

LOT:7ENTRY DATE:3/1/2024
MANAGEMENT:3/4/2024EXPIRATION:3/4/2024
DAYS HELD:3

Entry and Exit

METRICENTRYEXITCHANGECHANGE %ANNUALIZED CHANGE %
Options premium$ 1.91$ (1.40)$ 0.5136.4%4408%
Stock price$ 513.26$ 512.95$ (0.31)-0.1%-7%
Impllied Volatility Rate10.412.11.7
Days to expiration30

The structure of the position

STRUCTURESTRIKEODDS EXPIRE OTMDELTAIN PRICEOUT PRICENET PRICE
Calls
Long516.0078.0%20$ (0.35)$ 0.05$ (0.30)
Break-even514.9161.0%36.5
Short513.0044.0%53$ 1.45$ (0.71)$ 0.74
Puts
Short513.0054.0%47$ 1.16$ (0.83)$ 0.33
Break-even511.9168.5%32.5
Long510.0083.0%18$ (0.35)$ 0.09$ (0.26)
======
`NET TOTAL:$ 0.51

Risk and Reward

Per contract:
Reward191.00
Risk109.00
R/R Ratio (n:1)0.6

By Tim Bovee, Portland, Oregon, March 1, 4, 2024

Disclaimer

Tim Bovee, Private Trader tracks the analysis and trades of a private trader for his own accounts. Nothing in this blog constitutes a recommendation to buy or sell stocks, options or any other financial instrument. The only purpose of this blog is to provide education and entertainment.

No trader is ever 100 percent successful in his or her trades. Trading in the stock and option markets is risky and uncertain. Each trader must make trading decisions for his or her own account, and take responsibility for the consequences.

License
Creative Commons License

All content on Tim Bovee, Private Trader by Timothy K. Bovee is licensed under a Creative Commons Attribution-ShareAlike 4.0 International License.

Based on a work at www.timbovee.com.

Trader’s Notebook

3:30 p.m. New York time

Half an hour before the closing bell. The S&P 500 futures has so far risen into the 5140s during the session, as a series of rising corrective subwaves continued within a 4th-wave downward correction. Elliott Wave Theory: Wave C{-5} within wave A{-4} within wave B{-3} continue, all subwaves of increasing size within wave 4{-2}, the downward correction that began on February 12.

I’ve updated the upper chart, which shows a close-up view of the 4th wave and its subwaves.

2:30 p.m. New York time

Trades. I’ve exited the two 1DTE short Iron Fly positions I entered on Thursday, on SPY and XLE. SPY returned a 9% profit, and XLE, a 6.7% profit. I’ve updated the trade analyses with full results. XLE still has two out-of-the-money options on the table. If they were to move in the money prior to expiration, they would be exercised and the results would change.

I exited previous 1DTE trades shortly after the opening bell on expiration day. With these trades, I tried jumping in later, about halfway into the session. The result was a series of individual option exits that ended up producing a profit overall. Had I exited at the opening bell, each would have shown a loss.

I entered a short Iron Fly position on XSP today. It expires on Monday and at entry is 3DTE. I’ve posted an analysis of the trade and plan to follow the same exit procedures as I did with SPY and XLE.

9:35 a.m. New York time

What’s happening now? The S&P 500 E-mini futures fell from the 5110s to the 5080s overnight and then retraced a portion of the decline as the opening bell approached.

What does it mean? The downward correction that began on February 12 continues, working through its middle subwave, and one wave lower, the middle subwave’s initial subwave. At the lowest level I’m tracking, that initial subwave is in its final subwave.

The collection of Elliott waves is shown on the chart with a wave number and a subscript, in curly brackets, designating the wave’s position within the fractal structure of the chart, showing the distance from wave 5{0}, the expanding Diagonal Triangle that began on December 26, 2018 that encompasses all that has happened since.

See the “Reading the chart” section below for more on the fractal structure.

Turning now to the nomenclature of Elliott Wave Theory.

The upper chart shows the downward correction, wave 4{-2}, in its entirety. That correction is in its middle subwave, wave B{-3}, which in turn is in its initial subwave, wave A{-4}. At the lowest level that I’m tracking is rising wave C{-5}, the final subwave within wave A{-4}.

The horizontal red line on this chart shows the upper boundary of wave 4{-2}’s target range.

The lower chart shows the expanding Diagonal Triangle, wave 5{0}, in its entirety. At this level everything happening in the upprt chart is a very small, barely visible line. And yet, in keeping with Elliott Wave Theory, both charts together show a single structure, carrying us seamlessly from years down to days.

Wave 5{0} on the upper chart is the final wave of an uptrend. The Diagonal Triangle part means that each wave swings wider than the one that came before it. Wave 5{0} is in its final subwave, rising wave 5{-1}, which in turn in is a downward correction, wave 4{-2}.

What’s next?

On the upper chart, wave 4{-2} will be followed by rising wave 5{-2}, which will complete wave 5{-1} and its parent, wave 5{0}. Wave 4{-2} still has some distance to go before reaching its end, being in its middle subwave, wave B{-3}. The end of the present wave C{-5} will also be the end of wave A{-4}, which will be followed by a declining wave B{-4}.

On the lower chart, Wave 5{0}. when complete, will also be the end of a series of larger 5th waves, up to wave 5{+3}, which began on July 8, 1932. A long-running downtrend will follow, one that will take decades to complete and that, internally, will have the usual downtrends and uptrends within it, along with corrections in either direction.

What are the alternatives? On both charts there is ambiguity about the degree designations.

[S&P 500 E-mini futures at 3:30 p.m., 1-hour bars, with volume]

[S&P 500 index at 9:35 a.m., 3-day bars

What does Elliott wave theory say? Here are the waves that underly the analyses.

Principal Analysis:

  • Wave 5{0}, an expanding Diagonal Triangle, began on December 26, 2018.
  • Within it, an uptrend, wave 5{-1}, began on October 13, 2022 and is underway.
  • Wave 5{-1} is the parent wave of a downward correction, wave 4{-2}, that began on February 12, 2024.
  • Wave 4{-2} is in its second subwave, wave B{-3}, which in turn is in wave A{-4}, its initial subwave.
  • Wave A{-4} is in its final subwave, wave C{-5}.

We Are Here.

These are the waves currently in progress under my principal analysis. Each line on the list shows the wave number, with the subscript in curly brackets, the traditional degree name, the starting date, the starting price of the S&P 500 E-mini futures, and the direction of the wave.

  • S&P 500 Index:
  • 5{+3} Supercycle, 7/8/1932, 4.40 (up)
  • 5{+2} Cycle, 12/9/1974, 60.96 (up)
  • 5{+1} Primary, 3/6/2009, 666.79 (up)
  • 5{0} Intermediate, 12/26/2018, 2346.58 (up)
  • S&P 500 Futures and index:
  • 5{-1} Minor, 10/13/2022, 3502 (up) (futures), 3491.58 (up) (index)
  • S&P 500 Futures:
  • 4{-2} Minute, 2/12/2024, 5066.50 (down)
  • B{-3} Minuette, 2/21/2024, 4959 (up)

Reading the chart. Price movements — waves – – in Elliott wave analysis are labeled with numbers within trending waves and letters with corrective waves. The subscripts — numbers in curly brackets — designate the wave’s degree, which, in Elliott wave analysis, means the relative position of a wave within the larger and smaller structures that make up the chart. R.N. Elliott, who in the 1930s developed the form of analysis that bears his name, viewed the chart as a complex structure of smaller waves nested within larger waves, which in turn are nested within still larger waves. In mathematics it’s called a fractal structure, where at every scale the pattern is similar to the others.

Learning and other resources. Elliott wave analysis provides context, not prophecy. As the 20th century semanticist Alfred Korzybski put it in his book Science and Sanity (1933), “The map is not the territory … The only usefulness of a map depends on similarity of structure between the empirical world and the map.” And I would add, in the ever-changing markets, we can judge that similarity of structure only after the fact.

See the menu page Analytical Methods for a rundown on where to go for information on Elliott wave analysis.

By Tim Bovee, Portland, Oregon, March 1, 2024

Disclaimer

Tim Bovee, Private Trader tracks the analysis and trades of a private trader for his own accounts. Nothing in this blog constitutes a recommendation to buy or sell stocks, options or any other financial instrument. The only purpose of this blog is to provide education and entertainment.

No trader is ever 100 percent successful in his or her trades. Trading in the stock and option markets is risky and uncertain. Each trader must make trading decisions for his or her own account, and take responsibility for the consequences.

License
Creative Commons License

All content on Tim Bovee, Private Trader by Timothy K. Bovee is licensed under a Creative Commons Attribution-ShareAlike 4.0 International License.

Based on a work at www.timbovee.com.

Options Trades 2/29/2024: SPY XLE

Symbols traded: Short Iron Fly on SPY, XLE (1DTE)

With the major economic reports of the week past, and with the markets having returned to lower implied volalaties, I’ve resumed my very short-term trades with a short Iron Fly position on SPY, entered one day before expiratIon. Unlike earlier 1DTE trades, I intend to hold on to the position with the goal of exiting for a 25% profit. In the past I’ve exited at the market open. With this trade I’ll exit at 25% profit or at 1 p.m. New York time, whichever comes first.

I also entered a 1DTE short Iron Fly position on XLE under the same rules. Thursday’s are one day before expiration of many options, which have weeklies and their smallest time frame. That makes XLE available for a 1DTE trade.

I exited SPY entirely on expiration day, selling off legs of the Iron Fly individually, producing a $219 profit for each contract.

SPY short Iron Fly

LOT:9ENTRY DATE:2/29/2024
MANAGEMENT:3/1/2024EXPIRATION:3/1/2024
DAYS HELD:1

Entry and Exit

METRICENTRYEXITCHANGECHANGE %ANNUALIZED CHANGE %
Options premium$ 2.01$ 0.18$ 0.189.0%3251%
Stock price$ 507.70$ 511.00$ 3.300.6%237%
Impllied Volatility Rate10.910.5-0.4
Days to expiration10

The structure of the position

STRUCTURESTRIKEODDS EXPIRE OTMDELTAIN PRICEOUT PRICENET PRICE
Calls
Long511.0082.0%18$ (0.34)$ 1.30$ 0.96
Break-even510.0167.0%33
Short508.0052.0%48$ 1.33$ (3.11)$ (1.78)
Puts
Short508.0052.0%48$ 1.54$ (0.03)$ 1.51
Break-even507.0164.5%35.5
Long505.0077.0%23$ (0.52)$ 0.01$ (0.51)
======
`NET TOTAL:$ 0.18

Risk and Reward

Per contract:
Reward201.00
Risk99.00
R/R Ratio (n:1)0.5

XLE short Iron Fly

LOT:1ENTRY DATE:2/29/2024
MANAGEMENT:3/1/2024EXPIRATION:3/1/2024
DAYS HELD:1

Entry and Exit

METRICENTRYEXITCHANGECHANGE %ANNUALIZED CHANGE %
Options premium$ 0.60$ 0.04$ 0.046.7%2420%
Stock price$ 86.09$ 87.40$ 1.311.5%555%
Impllied Volatility Rate5.37.01.7
Days to expiration10

The structure of the position

STRUCTURESTRIKEODDS EXPIRE OTMDELTAIN PRICEOUT PRICENET PRICE
Calls
Long87.0083.0%18$ (0.10)$ 0.86$ 0.76
Break-even86.6064.5%35.5
Short86.0046.0%53$ 0.43$ (1.42)$ (0.99)
Puts
Short86.0046.0%54$ 0.33$ –$ 0.33
Break-even85.6066.5%33.5
Long85.0087.0%13$ (0.06)$ –$ (0.06)
======
`NET TOTAL:$ 0.04

Risk and Reward

Per contract:
Reward60.00
Risk40.00
R/R Ratio (n:1)0.7

By Tim Bovee, Portland, Oregon, February 29, 2024

Disclaimer

Tim Bovee, Private Trader tracks the analysis and trades of a private trader for his own accounts. Nothing in this blog constitutes a recommendation to buy or sell stocks, options or any other financial instrument. The only purpose of this blog is to provide education and entertainment.

No trader is ever 100 percent successful in his or her trades. Trading in the stock and option markets is risky and uncertain. Each trader must make trading decisions for his or her own account, and take responsibility for the consequences.

License
Creative Commons License

All content on Tim Bovee, Private Trader by Timothy K. Bovee is licensed under a Creative Commons Attribution-ShareAlike 4.0 International License.

Based on a work at www.timbovee.com.

Trader’s Notebook

3:30 p.m. New York time

Half an hour before the closing bell. The S&P 500 futures rose to 5105.50 during the session and then retreated into the 5070s. The price remained above the end point of the low-degree B wave, B{-5} on the chart, that was the center of this morning’s discussion.

That the price has remained above that level, 5060, increases the likelihood that this morning’s principal analysis is a correct reading of the Chart: Wave C{-5} within wave A{-4} within wave B{-3} are underway, all within wave 4{-2} downward correction that began on February 12. If the price were to fall below 5060, then the alternative analysis would return to the chart, showing wave B{-5} as still underway.

I’ve updated the chart.

2:10 p.m. New York time

Another Trade. I’ve entered a short iron Fly position on XLE, one day prior to expiration, and have added an analysis of the trade to today’s trading post.

1:30 p.m. New York time

Trade. I’ve entered a short Iron Fly position on SPY, one day before expiration, and have posted an analysis of the trade, in which I discuss a modification to my exit strategy.

9:35 a.m. New York time

What’s happening now? The S&P 500 E-mini futures rose sharply upon the release of the Personal Consumption Expenditure (PCE) price index, reaching above 5100 at the opening bell.

What does it mean? In Elliott Wave Theory, the overnight low, 5060, was the end of a low-degree declining B wave and the start of a rising C wave.

Those small waves are subwaves, three degrees lower, of a 4th-wave downward correction that began on February 12. That 4th wave is working through its rising middle wave, a larger B wave, which in turn is in its rising initial wave, a still larger A wave.

In the labelling on the chart, the smallest wave discussed above, the rising C wave, is wave C{-5}, the subscript in curly brackets being the degree designator, showing the degree’s location relative to an expanding Diagonal Triangle, wave 5{0}, that began in December 2018. See the “Reading the chart” section, below, for more about degrees.

Wave C{-5} is a subwave of wave A{-4}, which in turn is a subwve of wave B{-3}, which in turn is subwave of the downward correction, wave 4{-2}.

Wave C{-5}, when complete, will also be the end of rising wave A{-4}, which will be followed by a declining corrective wave, B{-4}.

What are the alternatives? Whipsaws happen. It’s quite possible that what I’ve labeled as a rising C wave is a subwave of the declining B wave, which is still. On the chart, that would mean that wave B{-5} is still underway and wave C{-5} has not yet begun.

Also, what I’m labelling as degree {-4} could instead be degree {-3}, one degree larger, pushing everything up one in the fractal hierarchy.

[S&P 500 E-mini futures at 3:30 p.m., 1-hour bars, with volume]

What does Elliott wave theory say? Here are the waves that underly the analyses.

Principal Analysis:

  • Wave 5{0}, an expanding Diagonal Triangle, began on December 26, 2018.
  • Within it, an uptrend, wave 5{-1}, began on October 13, 2022 and is underway.
  • Wave 5{-1} is the parent wave of a downward correction, wave 4{-2}, that began on February 12, 2024.
  • Wave 4{-2} is in its second subwave, wave B{-3}, which in turn is in wave A{-4}, its initial subwave.
  • Wave A{-4} is in its final subwave, wave C{-5}.

We Are Here.

These are the waves currently in progress under my principal analysis. Each line on the list shows the wave number, with the subscript in curly brackets, the traditional degree name, the starting date, the starting price of the S&P 500 E-mini futures, and the direction of the wave.

  • S&P 500 Index:
  • 5{+3} Supercycle, 7/8/1932, 4.40 (up)
  • 5{+2} Cycle, 12/9/1974, 60.96 (up)
  • 5{+1} Primary, 3/6/2009, 666.79 (up)
  • 5{0} Intermediate, 12/26/2018, 2346.58 (up)
  • S&P 500 Futures and index:
  • 5{-1} Minor, 10/13/2022, 3502 (up) (futures), 3491.58 (up) (index)
  • S&P 500 Futures:
  • 4{-2} Minute, 2/12/2024, 5066.50 (down)
  • B{-3} Minuette, 2/21/2024, 4959 (up)

Reading the chart. Price movements — waves – – in Elliott wave analysis are labeled with numbers within trending waves and letters with corrective waves. The subscripts — numbers in curly brackets — designate the wave’s degree, which, in Elliott wave analysis, means the relative position of a wave within the larger and smaller structures that make up the chart. R.N. Elliott, who in the 1930s developed the form of analysis that bears his name, viewed the chart as a complex structure of smaller waves nested within larger waves, which in turn are nested within still larger waves. In mathematics it’s called a fractal structure, where at every scale the pattern is similar to the others.

Learning and other resources. Elliott wave analysis provides context, not prophecy. As the 20th century semanticist Alfred Korzybski put it in his book Science and Sanity (1933), “The map is not the territory … The only usefulness of a map depends on similarity of structure between the empirical world and the map.” And I would add, in the ever-changing markets, we can judge that similarity of structure only after the fact.

See the menu page Analytical Methods for a rundown on where to go for information on Elliott wave analysis.

By Tim Bovee, Portland, Oregon, February 29, 2024

Disclaimer

Tim Bovee, Private Trader tracks the analysis and trades of a private trader for his own accounts. Nothing in this blog constitutes a recommendation to buy or sell stocks, options or any other financial instrument. The only purpose of this blog is to provide education and entertainment.

No trader is ever 100 percent successful in his or her trades. Trading in the stock and option markets is risky and uncertain. Each trader must make trading decisions for his or her own account, and take responsibility for the consequences.

License
Creative Commons License

All content on Tim Bovee, Private Trader by Timothy K. Bovee is licensed under a Creative Commons Attribution-ShareAlike 4.0 International License.

Based on a work at www.timbovee.com.

Trader’s Notebook

3:30 p.m. New York time

Half an hour before the closing bell. The S&P 500 futures continued to trade narrowly during the session, remaining in the 5070s and 5080s, as the Elliott Wave structure within the 4th wave downward correction that began in mid-February continued to evolve. I’ve updated the chart.

9:35 a.m. New York time

What’s happening now? The S&P 500 E-mini futures fell further overnight, deeper into the 5060s, and then retraced slightly, up into the 5070s..

What does it mean? Elliott Wave Theory describes the chart as showing a small B wave embedded several degrees deep within an a downward correction continues. The correction, a 4th wave, began on February 12 and is in its middle subwave, also a wave B. That larger wave B is in its 1st subwave, wave A, and the small B wave now underway is the first subwave of that wave A.

The small B wave, when complete, will be followed by rising C wave that will complete the parent A wave and begin a larger, B-wave decline.

On the chart, the waves are shown as a wave number and degree designation, a subscript in curly brackets showing the wave’s position within the fractal hierarchy, using the expanding Diagonal Triangle, wave 5{0}, as a base point. The smaller the subscript, the lower down the hierarchy the wave. See “Reading the chart”, below, for more on degrees.

So from the large downward correction to the smallest B wave in yesterday’s disussion, here’s where the chart stands: Now underway, declining wave 4{-2}, rising wave B{-3}, rising wave A{-4}, declining wave B{-5}. All of which is happening within wave 5{0}, an expanding Diagonal Triangle that began on December 26, 2018.

What are the alternatives? What I’m labelling as degree {-4} could instead be degree {-3}, one degree larger, pushing everything up one in the fractal hierarchy. I chose my labeling based on the consistency with the subwaves prior to the 4th-wave upward correction (wave 4{-2}), but consistency is a tendency, not a firm rule, so there’s a lack of certainty.

[S&P 500 E-mini futures at 3:30 p.m., 1-hour bars, with volume]

What does Elliott wave theory say? Here are the waves that underly the analyses.

Principal Analysis:

  • Wave 5{0}, an expanding Diagonal Triangle, began on December 26, 2018.
  • Within it, an uptrend, wave 5{-1}, began on October 13, 2022 and is underway.
  • Wave 5{-1} is the parent wave of a downward correction, wave 4{-2}, that began on February 12, 2024.
  • Wave 4{-2} is in its second subwave, wave B{-3}, which in turn is in wave A{-4}, its initial subwave.
  • Wave A{-4} is in its middle subwave, wave B{-5}.

We Are Here.

These are the waves currently in progress under my principal analysis. Each line on the list shows the wave number, with the subscript in curly brackets, the traditional degree name, the starting date, the starting price of the S&P 500 E-mini futures, and the direction of the wave.

  • S&P 500 Index:
  • 5{+3} Supercycle, 7/8/1932, 4.40 (up)
  • 5{+2} Cycle, 12/9/1974, 60.96 (up)
  • 5{+1} Primary, 3/6/2009, 666.79 (up)
  • 5{0} Intermediate, 12/26/2018, 2346.58 (up)
  • S&P 500 Futures and index:
  • 5{-1} Minor, 10/13/2022, 3502 (up) (futures), 3491.58 (up) (index)
  • S&P 500 Futures:
  • 4{-2} Minute, 2/12/2024, 5066.50 (down)
  • B{-3} Minuette, 2/21/2024, 4959 (up)

Reading the chart. Price movements — waves – – in Elliott wave analysis are labeled with numbers within trending waves and letters with corrective waves. The subscripts — numbers in curly brackets — designate the wave’s degree, which, in Elliott wave analysis, means the relative position of a wave within the larger and smaller structures that make up the chart. R.N. Elliott, who in the 1930s developed the form of analysis that bears his name, viewed the chart as a complex structure of smaller waves nested within larger waves, which in turn are nested within still larger waves. In mathematics it’s called a fractal structure, where at every scale the pattern is similar to the others.

Learning and other resources. Elliott wave analysis provides context, not prophecy. As the 20th century semanticist Alfred Korzybski put it in his book Science and Sanity (1933), “The map is not the territory … The only usefulness of a map depends on similarity of structure between the empirical world and the map.” And I would add, in the ever-changing markets, we can judge that similarity of structure only after the fact.

See the menu page Analytical Methods for a rundown on where to go for information on Elliott wave analysis.

By Tim Bovee, Portland, Oregon, February 28, 2024

Disclaimer

Tim Bovee, Private Trader tracks the analysis and trades of a private trader for his own accounts. Nothing in this blog constitutes a recommendation to buy or sell stocks, options or any other financial instrument. The only purpose of this blog is to provide education and entertainment.

No trader is ever 100 percent successful in his or her trades. Trading in the stock and option markets is risky and uncertain. Each trader must make trading decisions for his or her own account, and take responsibility for the consequences.

License
Creative Commons License

All content on Tim Bovee, Private Trader by Timothy K. Bovee is licensed under a Creative Commons Attribution-ShareAlike 4.0 International License.

Based on a work at www.timbovee.com.

Trader’s Notebook

3:30 p.m. New York time

Half an hour before the closing bell. The S&P 500 futures moved a bit lower during the session, into the 5060s, and then returned to the 5080s, essentially going to nowhere.

The Elliott Wave Analysis is unchanged: The 4th-wave downward correction that began on February 12 continues and is in its second subwave, wave B.

I’ve updated the chart.

9:35 a.m. New York time

What’s happening now? The S&P 500 E-mini futures fluctuated from the 5070s to the 5090s overnight.

What does it mean? Elliott Wave Theory’s view of the chart is that the 4th-wave downward correction that began on February 12 continues. Typically, it will end within the range of subwave 4 within the preceding 3rd wave.

I’ve pulled back the chart for a broader view. The red line at the bottom is the upper boundary of the target price range for wave 4. The lower boundary, not visible, is 4702.

The 4th-wave correction is labeled wave 4[-2} on the chart — the wave number and a degree designator as a subscript in curly brackets showing the wave’s position within the fractal hierarchy of the chart.. See the “Reading the chart” section below for more on the chart’s labeling system.

Wave 4{-2} is in its second subwave, a rising B wave, which in turn is in its first subwav, a rising A wave.

The B wave, labeled wave B{-3} on the chart, is the one I’m keeping an eye on. When its third and final subwave, wave C{-4}, is complete, wave C{-3} will carry the price down in five subwaves.

What are the alternatives? The ambiguity, as is so often the case, likes in the degree designators. What I’m labelling as degree {-4} could instead be degree {-3}, one degree larger, pushing everything up one in the fractal hierarchy. I chose my labeling based on the consistency with the subwaves prior to the 4th-wave upward correction (wave 4{-2}), but consistency is a tendency, not a firm rule, so there’s a lack of certainty.

[S&P 500 E-mini futures at 3:30 p.m., 1-hour bars, with volume]

What does Elliott wave theory say? Here are the waves that underly the analyses.

Principal Analysis:

  • Wave 5{0}, an expanding Diagonal Triangle, began on December 26, 2018.
  • Within it, an uptrend, wave 5{-1}, began on October 13, 2022 and is underway.
  • Wave 5{-1} is the parent wave of a downward correction, wave 4{-2}, that began on February 12, 2024.
  • Wave 4{-2} is in its second subwave, wave B{-3}, which in turn is in wave A{-4}, its initial subwave.
  • Wave A{-4} is in its middle subwave, wave B{-5}.

We Are Here.

These are the waves currently in progress under my principal analysis. Each line on the list shows the wave number, with the subscript in curly brackets, the traditional degree name, the starting date, the starting price of the S&P 500 E-mini futures, and the direction of the wave.

  • S&P 500 Index:
  • 5{+3} Supercycle, 7/8/1932, 4.40 (up)
  • 5{+2} Cycle, 12/9/1974, 60.96 (up)
  • 5{+1} Primary, 3/6/2009, 666.79 (up)
  • 5{0} Intermediate, 12/26/2018, 2346.58 (up)
  • S&P 500 Futures and index:
  • 5{-1} Minor, 10/13/2022, 3502 (up) (futures), 3491.58 (up) (index)
  • S&P 500 Futures:
  • 4{-2} Minute, 2/12/2024, 5066.50 (down)
  • B{-3} Minuette, 2/21/2024, 4959 (up)

Reading the chart. Price movements — waves – – in Elliott wave analysis are labeled with numbers within trending waves and letters with corrective waves. The subscripts — numbers in curly brackets — designate the wave’s degree, which, in Elliott wave analysis, means the relative position of a wave within the larger and smaller structures that make up the chart. R.N. Elliott, who in the 1930s developed the form of analysis that bears his name, viewed the chart as a complex structure of smaller waves nested within larger waves, which in turn are nested within still larger waves. In mathematics it’s called a fractal structure, where at every scale the pattern is similar to the others.

Learning and other resources. Elliott wave analysis provides context, not prophecy. As the 20th century semanticist Alfred Korzybski put it in his book Science and Sanity (1933), “The map is not the territory … The only usefulness of a map depends on similarity of structure between the empirical world and the map.” And I would add, in the ever-changing markets, we can judge that similarity of structure only after the fact.

See the menu page Analytical Methods for a rundown on where to go for information on Elliott wave analysis.

By Tim Bovee, Portland, Oregon, February 27, 2024

Disclaimer

Tim Bovee, Private Trader tracks the analysis and trades of a private trader for his own accounts. Nothing in this blog constitutes a recommendation to buy or sell stocks, options or any other financial instrument. The only purpose of this blog is to provide education and entertainment.

No trader is ever 100 percent successful in his or her trades. Trading in the stock and option markets is risky and uncertain. Each trader must make trading decisions for his or her own account, and take responsibility for the consequences.

License
Creative Commons License

All content on Tim Bovee, Private Trader by Timothy K. Bovee is licensed under a Creative Commons Attribution-ShareAlike 4.0 International License.

Based on a work at www.timbovee.com.

Trader’s Notebook

3:30 p.m. New York time

Half an hour before the closing bell. The S&P 500 futures retraced during the session, back into the 5080s, as the middle subwave, rising wave B, of the 4th-wave downward correction that began in mid-February works through its first subwave, declining wave A.

I’ve updated the chart.

9:35 a.m. New York time

What’s happening now? The S&P 500 E-mini futures kept to to a narrow range after trading resumed overnight, remainiing largely in the 5080s and 5090s after declining slightly at the opening and rising a bit higher, above 5100, as the opening bell approached.

What does it mean? The 4th-wave downward correction that began on February 12 continues. There is some ambiguity regarding where the waves are situated in relation to fractal structure of the chart.

The count that I’ve used has the following structure, working down from wave 4 from the larger subwaves to the smaller and using the degree designations, in curly brackets, as they appear on the chart: Rising wave B{-3}, rising wave A{-4}, declining wave B{-5}.

See the “Reading the chart” section, below, for more on degrees and their labeling.

In any case, rising wave B{-3} will have three subwaves at the {-4} degree. Once the B wave is complete, it will be followed by a declining C wave that will decline significantly, completing the correction.

The 4th-wave correction will in turn be followed by a rising 5th wave of uncertain magnitude.

What are the alternatives? So where’s the ambiguity? What I’m labelling as degree {-4} could instead be degree {-3}, one degree larger, pushing everything up one in the fractal hierarchy. I chose my labeling based on the consistency with the subwaves prior to the 4th-wave upward correction (wave 4{-2}), but consistency is a tendency, not a firm rule, so there’s a lack of certainty.

[S&P 500 E-mini futures at 3:30 p.m., 25-minute bars, with volume]

What does Elliott wave theory say? Here are the waves that underly the analyses.

Principal Analysis:

  • Wave 5{0}, an expanding Diagonal Triangle, began on December 26, 2018.
  • Within it, an uptrend, wave 5{-1}, began on October 13, 2022 and is underway.
  • Wave 5{-1} is the parent wave of a downward correction, wave 4{-2}, that began on February 12, 2024.
  • Wave 4{-2} is in its second subwave, wave B{-3}, which in turn is in wave A{-4}, its initial subwave.
  • Wave A{-4} is in its middle subwave, wave B{-5}.

We Are Here.

These are the waves currently in progress under my principal analysis. Each line on the list shows the wave number, with the subscript in curly brackets, the traditional degree name, the starting date, the starting price of the S&P 500 E-mini futures, and the direction of the wave.

  • S&P 500 Index:
  • 5{+3} Supercycle, 7/8/1932, 4.40 (up)
  • 5{+2} Cycle, 12/9/1974, 60.96 (up)
  • 5{+1} Primary, 3/6/2009, 666.79 (up)
  • 5{0} Intermediate, 12/26/2018, 2346.58 (up)
  • S&P 500 Futures and index:
  • 5{-1} Minor, 10/13/2022, 3502 (up) (futures), 3491.58 (up) (index)
  • S&P 500 Futures:
  • 4{-2} Minute, 2/12/2024, 5066.50 (down)
  • B{-3} Minuette, 2/21/2024, 4959 (up)

Reading the chart. Price movements — waves – – in Elliott wave analysis are labeled with numbers within trending waves and letters with corrective waves. The subscripts — numbers in curly brackets — designate the wave’s degree, which, in Elliott wave analysis, means the relative position of a wave within the larger and smaller structures that make up the chart. R.N. Elliott, who in the 1930s developed the form of analysis that bears his name, viewed the chart as a complex structure of smaller waves nested within larger waves, which in turn are nested within still larger waves. In mathematics it’s called a fractal structure, where at every scale the pattern is similar to the others.

Learning and other resources. Elliott wave analysis provides context, not prophecy. As the 20th century semanticist Alfred Korzybski put it in his book Science and Sanity (1933), “The map is not the territory … The only usefulness of a map depends on similarity of structure between the empirical world and the map.” And I would add, in the ever-changing markets, we can judge that similarity of structure only after the fact.

See the menu page Analytical Methods for a rundown on where to go for information on Elliott wave analysis.

By Tim Bovee, Portland, Oregon, February 26, 2024

Disclaimer

Tim Bovee, Private Trader tracks the analysis and trades of a private trader for his own accounts. Nothing in this blog constitutes a recommendation to buy or sell stocks, options or any other financial instrument. The only purpose of this blog is to provide education and entertainment.

No trader is ever 100 percent successful in his or her trades. Trading in the stock and option markets is risky and uncertain. Each trader must make trading decisions for his or her own account, and take responsibility for the consequences.

License
Creative Commons License

All content on Tim Bovee, Private Trader by Timothy K. Bovee is licensed under a Creative Commons Attribution-ShareAlike 4.0 International License.

Based on a work at www.timbovee.com.

Trader’s Notebook

3:30 p.m. New York time

Half an hour before the closing bell. The S&P 500 futures rose during the session, coming to within 2 points of the upper boundary of the price target for the middle subwave of the upward correction that began in mid-February. It then pulled back from the 5123.50 peak.

I’ve updated the chart to designate that peak as the end of rising wave A{-5} and the beginning of declining wave B{-5}. At that small {-5} degree, we’re tracking wave that last a day, may two days.

Wave A{-5} had five subwaves — maybe. This morning I discussed the difficulty of counting the subwaves of such a fast and powerful price movement, and it still holds true, except for the 4th subwave. Five subwaves in the A wave means that the form is that of a Zigzag. B waves in a Zigzag never move beyond the starting point of the previous A wave (4959 in this case), and tend to retrace between 38% and 79% of wave A.

9:35 a.m. New York time

What’s happening now? The S&P 500 E-mini futures largely traded sideways within a narrow range, breaking higher into the 5120s as the opening bell sounded.

What does it mean? In terms of Elliott Wave Theory, the S&P 500 futures chart is in the 1st subwave within a larger 1st subwave within a still larger 2nd subwave that in turn is part of a 4th-wave upward correction that began on February 12.

On the chart, with wave numbers followed by subscripts in curly brackets showing the relative degree, that translates into rising wave A{-5} within rising wave A{-4} within rising wave B{-3} within declining wave 4{-2}. (See the “Reading the chart” section, below, for more on degrees.)

On the chart I made a tentative attempt to understand the internal structure, at the {-6} degree. One problem is that the energy of the rise was so great that the corrective subwaves are hard to discern, and even harder to place within the fractal nature of the chart. They seem way too small to be the same degree as the waves carrying the price higher.

By that count, wave A{-5} is in its final subwave. It will be followed by declining wave B{-5}, the middle subwave of rising wave A{-4}.

The dashed red line at the top of the chart shows the upper boundary of the wave B{-3} target price range, at 5125. The target range is a tendency, not a rule, within Elliott Wave Theory.

What are the alternatives? I see some uncertainty in this rise in several of the lower degrees. Are the degree designators correct? No way to tell at this point, although the progress of wave B{-3}, whose placement I have confidence in, will better define its subwaves.

[S&P 500 E-mini futures at 9:35 a.m., 25-minute bars, with volume]

What does Elliott wave theory say? Here are the waves that underly the analyses.

Principal Analysis:

  • Wave 5{0}, an expanding Diagonal Triangle, began on December 26, 2018.
  • Within it, an uptrend, wave 5{-1}, began on October 13, 2022 and is underway.
  • Wave 5{-1} is the parent wave of a downward correction, wave 4{-2}, that began on February 12, 2024.
  • Wave 4{-2} is in its second subwave, wave B{-3}, which in turn is in wave B{-4}, its middle subwave.

We Are Here.

These are the waves currently in progress under my principal analysis. Each line on the list shows the wave number, with the subscript in curly brackets, the traditional degree name, the starting date, the starting price of the S&P 500 E-mini futures, and the direction of the wave.

  • S&P 500 Index:
  • 5{+3} Supercycle, 7/8/1932, 4.40 (up)
  • 5{+2} Cycle, 12/9/1974, 60.96 (up)
  • 5{+1} Primary, 3/6/2009, 666.79 (up)
  • 5{0} Intermediate, 12/26/2018, 2346.58 (up)
  • S&P 500 Futures and index:
  • 5{-1} Minor, 10/13/2022, 3502 (up) (futures), 3491.58 (up) (index)
  • S&P 500 Futures:
  • 4{-2} Minute, 2/12/2024, 5066.50 (down)
  • B{-3} Minuette, 2/21/2024, 4959 (up)

Reading the chart. Price movements — waves – – in Elliott wave analysis are labeled with numbers within trending waves and letters with corrective waves. The subscripts — numbers in curly brackets — designate the wave’s degree, which, in Elliott wave analysis, means the relative position of a wave within the larger and smaller structures that make up the chart. R.N. Elliott, who in the 1930s developed the form of analysis that bears his name, viewed the chart as a complex structure of smaller waves nested within larger waves, which in turn are nested within still larger waves. In mathematics it’s called a fractal structure, where at every scale the pattern is similar to the others.

Learning and other resources. Elliott wave analysis provides context, not prophecy. As the 20th century semanticist Alfred Korzybski put it in his book Science and Sanity (1933), “The map is not the territory … The only usefulness of a map depends on similarity of structure between the empirical world and the map.” And I would add, in the ever-changing markets, we can judge that similarity of structure only after the fact.

See the menu page Analytical Methods for a rundown on where to go for information on Elliott wave analysis.

By Tim Bovee, Portland, Oregon, February 23, 2024

Disclaimer

Tim Bovee, Private Trader tracks the analysis and trades of a private trader for his own accounts. Nothing in this blog constitutes a recommendation to buy or sell stocks, options or any other financial instrument. The only purpose of this blog is to provide education and entertainment.

No trader is ever 100 percent successful in his or her trades. Trading in the stock and option markets is risky and uncertain. Each trader must make trading decisions for his or her own account, and take responsibility for the consequences.

License
Creative Commons License

All content on Tim Bovee, Private Trader by Timothy K. Bovee is licensed under a Creative Commons Attribution-ShareAlike 4.0 International License.

Based on a work at www.timbovee.com.

Trader’s Notebook

3:30 p.m. New York time

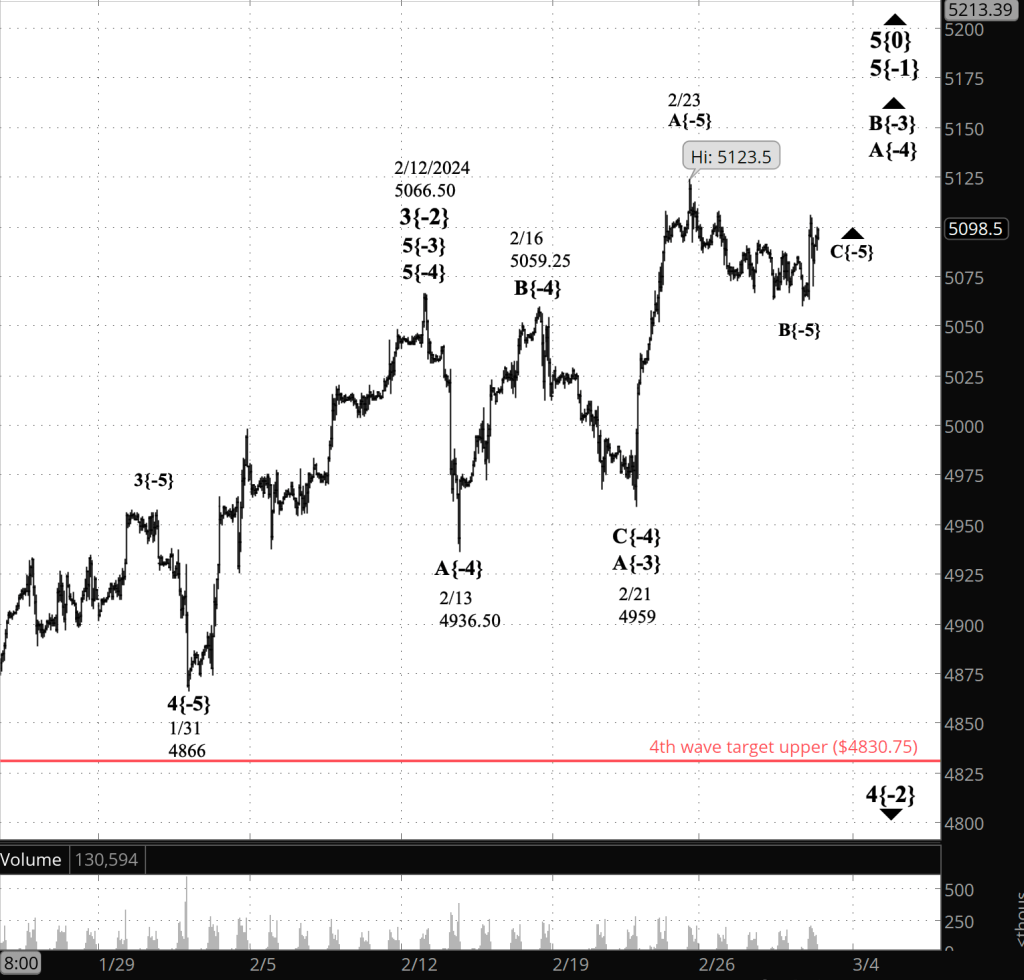
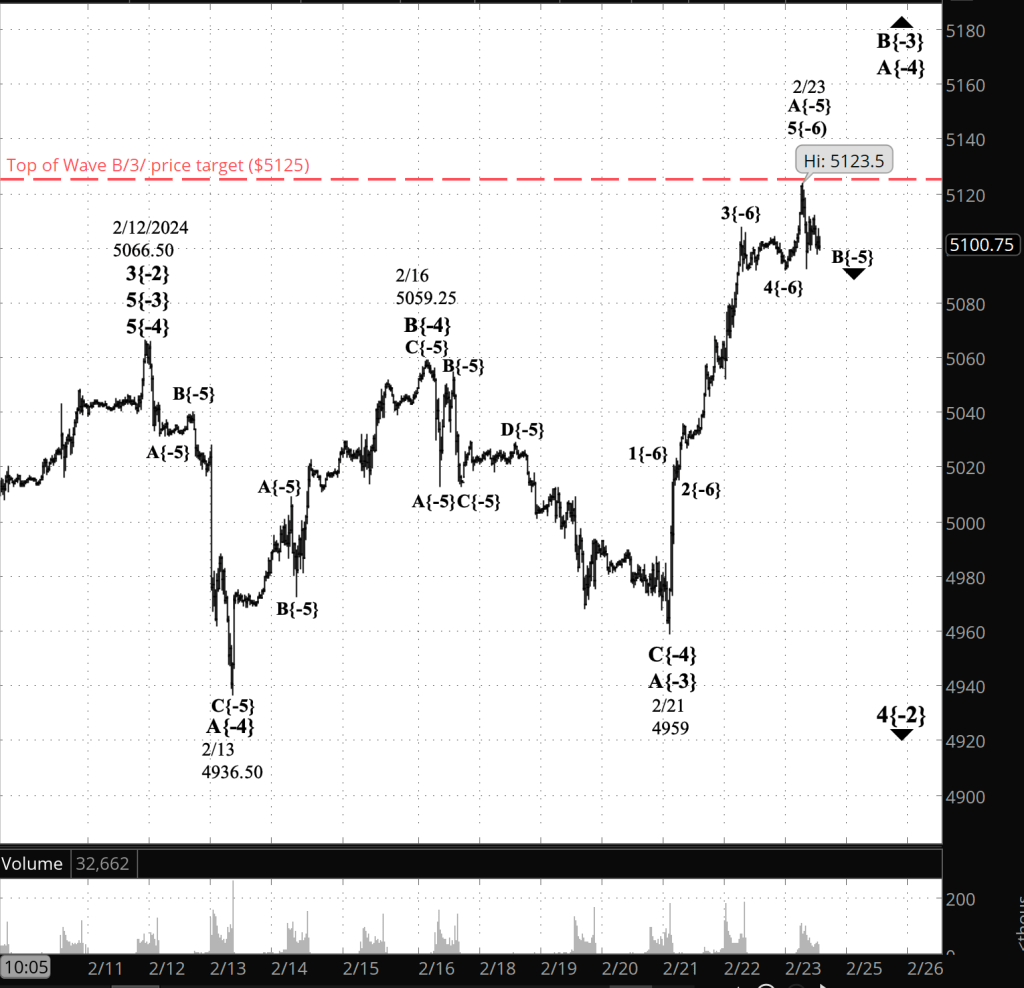
Half an hour before the closing bell. The S&P 500 futures continued to rise, coming within 20 points of the upper boundary of the price target at 5125 (the dashed red line on the chart). The price target is a tendency, not a rule. The price could either reverse and drop or could push above that level, and it would remain within the rules of Elliott Wave Theory.

How far along is the present wave B{-3}? When a wave has this much energy, it’s hard to say where the counter-directional retrenchments have occurred. My best guess is that we’re still in subwave A{-4}.

At this point, I think it important to step back and gain some perspective.

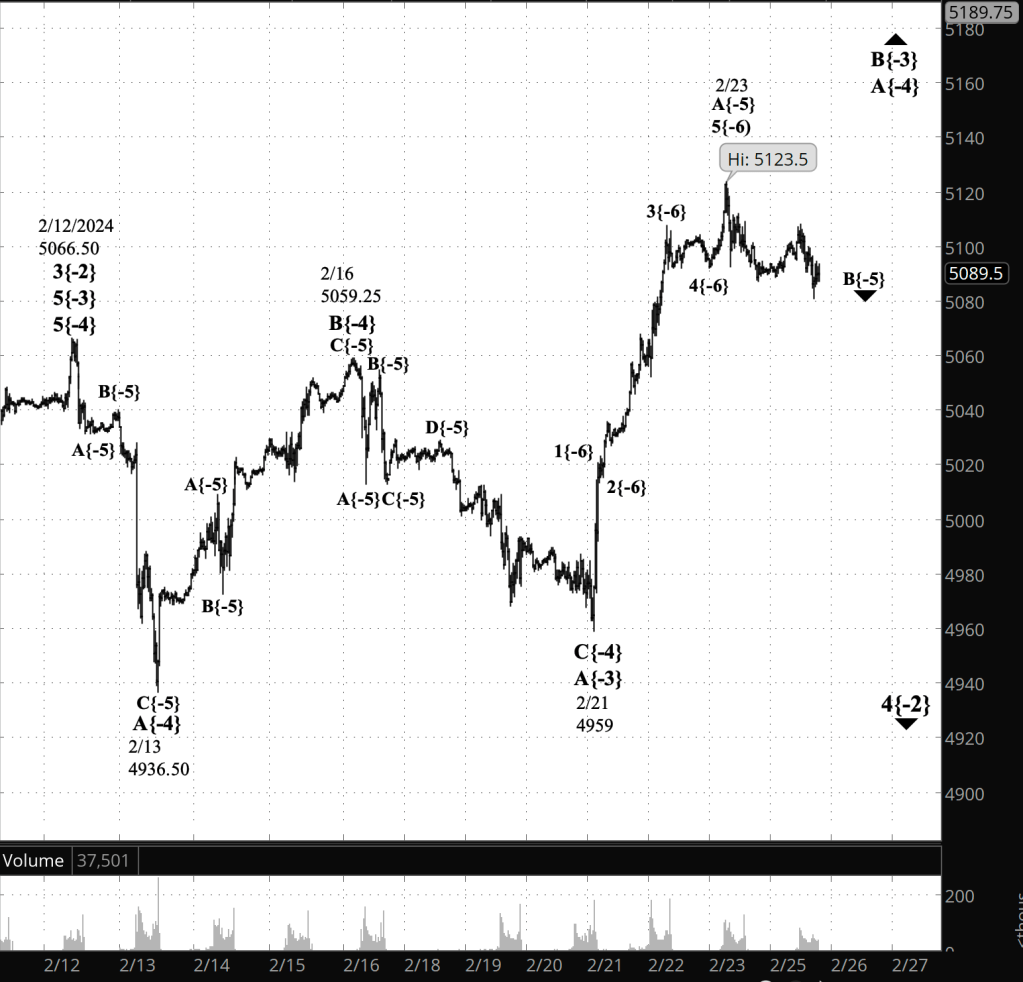
This rise on the close-up chart, which works best for daily analysis, makes the wave B{-3} rise look like a thunderous event, one that will change the World as We Know It.

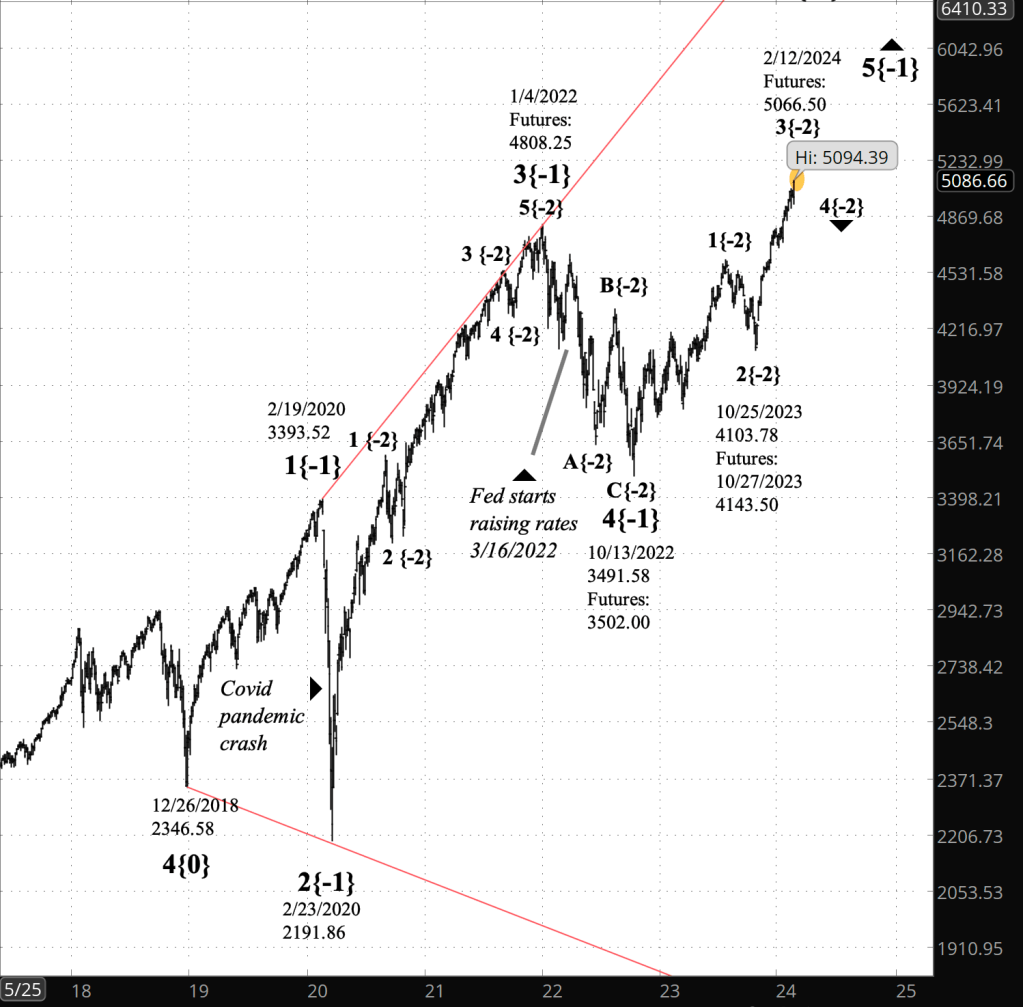
I’ve added a chart as contrast to this morning’s close-up chart of the wave 4{-2} downward correction that began on December 12, of the S&P 500 index showing the expanding Diagonal Triangle two degrees larger that encompasses all that has happened since the triangle began, on December 26, 2018, a bit more than five years ago.

[S&P 500 index at 3:30 p.m., 3-day bars]

Look very carefully at the end of the price line, and you’ll see a tiny yellow circle. That 4th-wave upward correction that began on February 12 and is now in its middle subwave? It is contained entirely within that circle. So it’s a big deal detail. In the grander movements of the market, maybe not so much.

Here I’ll insert a caveat: I don’t ever give trading advice to anyone; go make your own mistakes, don’t echo mine.

Having said that, when trading options I look carefully at the close-up charts, at present basing my decisions on the {-4} degree and its {-5} subwaves on that close-up chart. I look to trade waves 3 and 5 within trends and waves A and C within corrections.

For stocks, I prefer to I stick with the larger degrees: The {-2} degree, for example, and its internal subwaves at degree {-3}. I trade any rising wave of those degrees, trying to jump during the earlier subwaves. When a long downward wave is underway — like now — I will on occasionally drop down to the smaller degrees and trade a rising 3rd or 5th wave.

Finally, the rise has pushed the price above the prior S&P 500 high, set on February 12. An expanding Diagonal Triangle, such as our present wave 5{0}, creates a price channel that grows wider every day. Today’s high is a bit more than 25 points above the prior high and around 1400 points below the upper boundary of the Diagonal Triangle’s price channel. So the “record high”, as some in the financial media describe it, is more an incremental bump up than an achievement of historical significance.

9:35 a.m. New York time

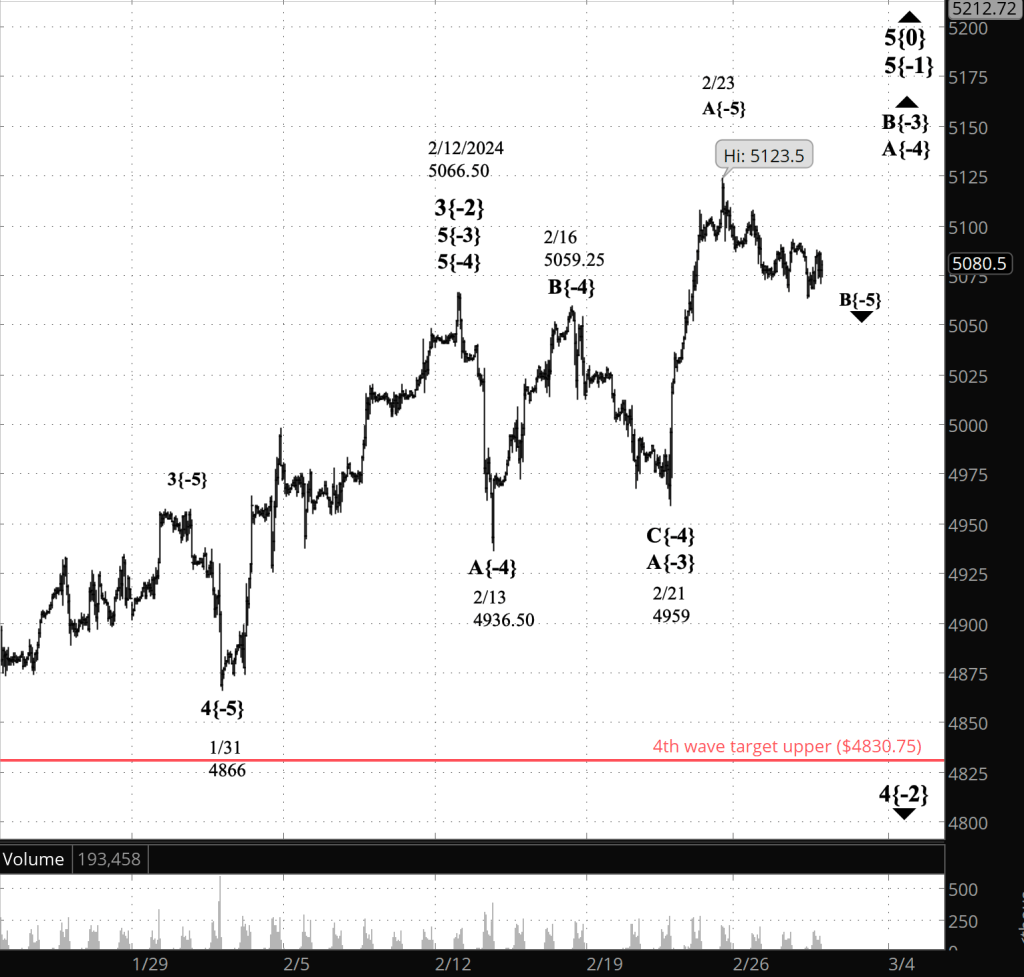
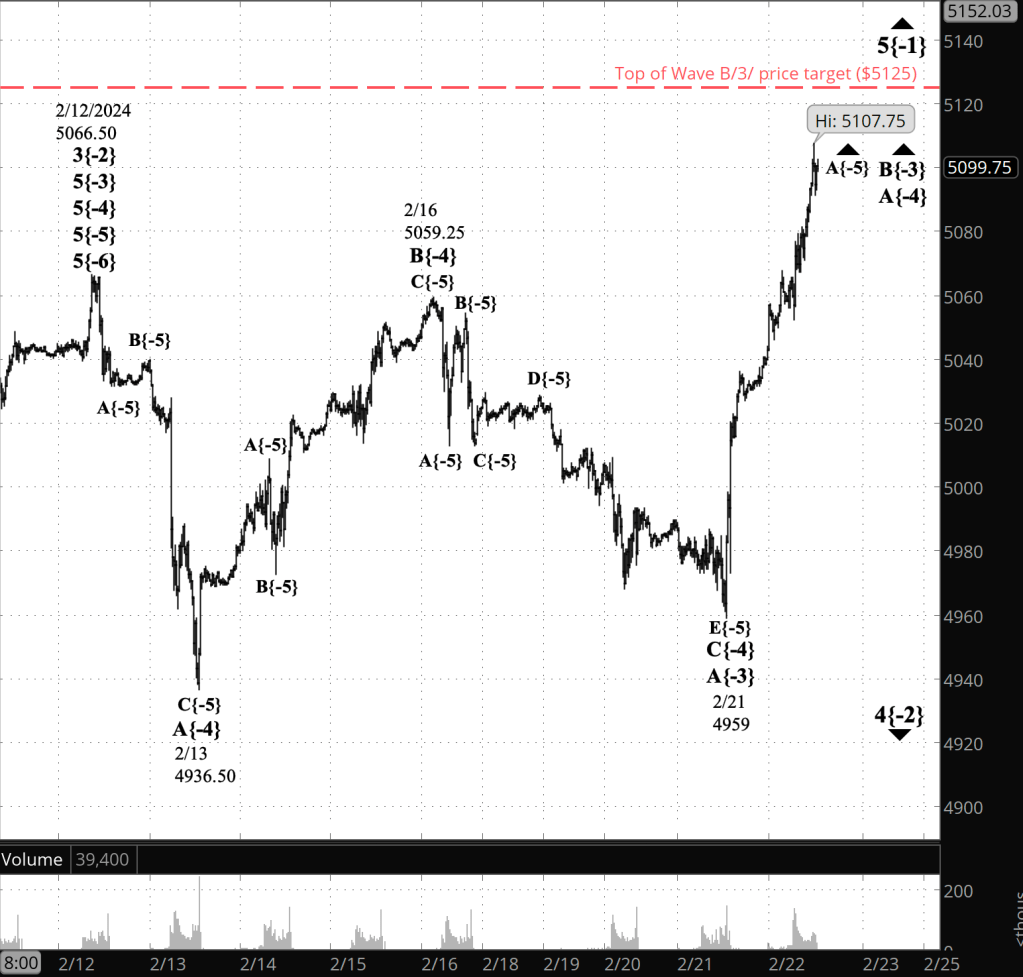
What’s happening now? The S&P 500 E-mini futures rose sharply as the closing bell approached in yesterday’s session, and kept shooting higher overnight.

What does it mean? Within the 4th-wave downward correction, wave 4, that began on February 12, the 1st subwave, an A wave, came to an end at 4959 and the middle subwave, a B wave, began. The B wave has so far reached into the 5060s, and it is within its first subwave.

As I did in yesterday’s Elliott Wave Analysis, for the rest of this discussion I’ll use the wave degrees as designated on the chart. The degrees are displayed just after each wave number, as subscripts within curly brackets, showing each degrees distance from the Intermediate degree, which is presently wave 5{0}, an expanding Diagonal Triangle that began in December 2018.

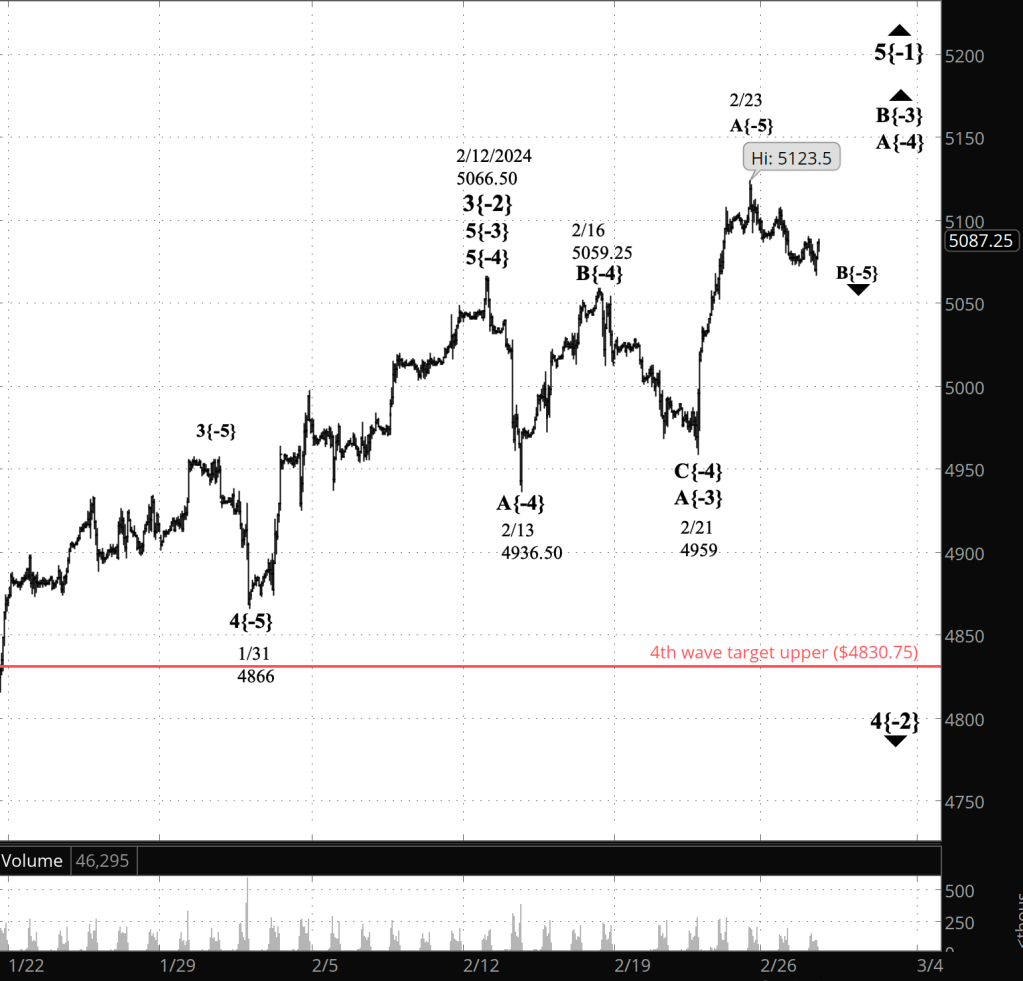
The largest wave included in this discussion is wave 4{-2}, a downward correction that began February 12. It’s first subwave, wave A{-3], ended late in yesterday’s session at 4959, and from that point rising wave B{-3} began, carrying the price up by more than 2%.

Whatever the form of a correction, a B wave has three subwaves. The first subwave is still underway, rising wave B{-4}.

A 4th-wave correction generally takes the from of a Flat, with three waves within the first subwave, although sometimes they take the form of a Zigzag, with five waves within the first subwave. The principal analysis considers it more likely that wave 4{-2} has taken the from of a Flat.

Whatever the form, the middle subwave — wave B{-3} in this case — will have three subwaves.

The B wave in a Flat always retraces 90% or more of the preceding A wave of the same degree, and usually retraces between 100% and 138%. These observations of Elliott Wave Theory tell us that wave B{-3} is far from having finished its rise.

Wave A{-3} covered 120 points during its nine-day existence. Wave B{-3}, an hour before the opening bell, has so far has covered 108.75 points during its existence, which is measured in hours, not days.

Wave B{-3} has in that brief time met the minimum requirement of a B wave in a Flat correction. It has retraced 90% of the preceding A wave. A retracement of 138% would carry the price up 166 points, to 5125. I’ve marked that point, the top of the wave B price target range, with a dashed line on the chart.

Like all waves the B wave will be built from a series of rises and falls. The B wave is highly unlikely to reach its end point without slides to the downside.

In other business, business as usual in the world of Elliott Wave Theory

What are the alternatives? Yesterday’s alternative — that wave 4{-2] is taking the form of a Zigzag, with all of its implications, such as a smaller retracement — is seeming increasingly unlikely, and I’m removing it from the mix. If it appears more viable later, I’ll restore it.

[S&P 500 E-mini futures at 3:30 p.m., 20-minute bars, with volume]

What does Elliott wave theory say? Here are the waves that underly the analyses.

Principal Analysis:

  • Wave 5{0}, an expanding Diagonal Triangle, began on December 26, 2018.
  • Within it, an uptrend, wave 5{-1}, began on October 13, 2022 and is underway.
  • Wave 5{-1} is the parent wave of a downward correction, wave 4{-2}, that began on February 12, 2024.
  • Wave 4{-2} is in its second subwave, wave B{-3}, which in turn is in wave A{-4}, its first subwave.

We Are Here.

These are the waves currently in progress under my principal analysis. Each line on the list shows the wave number, with the subscript in curly brackets, the traditional degree name, the starting date, the starting price of the S&P 500 E-mini futures, and the direction of the wave.

  • S&P 500 Index:
  • 5{+3} Supercycle, 7/8/1932, 4.40 (up)
  • 5{+2} Cycle, 12/9/1974, 60.96 (up)
  • 5{+1} Primary, 3/6/2009, 666.79 (up)
  • 5{0} Intermediate, 12/26/2018, 2346.58 (up)
  • S&P 500 Futures and index:
  • 5{-1} Minor, 10/13/2022, 3502 (up) (futures), 3491.58 (up) (index)
  • S&P 500 Futures:
  • 4{-2} Minute, 2/12/2024, 5066.50 (down)
  • B{-3} Minuette, 2/21/2024, 4959 (up)

Reading the chart. Price movements — waves – – in Elliott wave analysis are labeled with numbers within trending waves and letters with corrective waves. The subscripts — numbers in curly brackets — designate the wave’s degree, which, in Elliott wave analysis, means the relative position of a wave within the larger and smaller structures that make up the chart. R.N. Elliott, who in the 1930s developed the form of analysis that bears his name, viewed the chart as a complex structure of smaller waves nested within larger waves, which in turn are nested within still larger waves. In mathematics it’s called a fractal structure, where at every scale the pattern is similar to the others.

Learning and other resources. Elliott wave analysis provides context, not prophecy. As the 20th century semanticist Alfred Korzybski put it in his book Science and Sanity (1933), “The map is not the territory … The only usefulness of a map depends on similarity of structure between the empirical world and the map.” And I would add, in the ever-changing markets, we can judge that similarity of structure only after the fact.

See the menu page Analytical Methods for a rundown on where to go for information on Elliott wave analysis.

By Tim Bovee, Portland, Oregon, February 22, 2024

Disclaimer

Tim Bovee, Private Trader tracks the analysis and trades of a private trader for his own accounts. Nothing in this blog constitutes a recommendation to buy or sell stocks, options or any other financial instrument. The only purpose of this blog is to provide education and entertainment.

No trader is ever 100 percent successful in his or her trades. Trading in the stock and option markets is risky and uncertain. Each trader must make trading decisions for his or her own account, and take responsibility for the consequences.

License
Creative Commons License

All content on Tim Bovee, Private Trader by Timothy K. Bovee is licensed under a Creative Commons Attribution-ShareAlike 4.0 International License.

Based on a work at www.timbovee.com.

Trader’s Notebook

3:30 p.m. New York time

Half an hour before the closing bell. The S&P 500 futures dipped a bit more during the session, from the 4970s into the 4950s. I’ve added an additional, smaller wave degree to the analysis, showing the subwaves of wave E{-5}, the lowest-level wave in this morning’s discussion. Wave E{-5}, which began on February 19, is in its final subwave, wave E{-6}, which began the next day, on February 20. When wave E{-6} reaches its end, the event will cascade up the fractal hierarchy, ending the parent, wave E{-5}, and waves higher up as described in this morning’s analysis, below.

I’ve updated the chart.

9:35 a.m. New York time

What’s happening now? The S&P 500 E-mini futures worked its way slightly lower overnight, from the 4990s to the 4970s.

What does it mean? The end game continues within the first subwave, wave A, of a 4th-wave downward correction that began on February 12 from 5066.50.

I’ve expanded the waves I’m tracking to encompass four Elliott Wave degrees, that is, four relative levels in the fractal hierarchy of the chart. The wave degrees are designated on the chart and in this discussion by subscripts within curly brackets showing each degrees distance from the Intermediate degree, which is presently wave 5{0}, an expanding Diagonal Triangle that began in December 2018 and that encompasses all that has happened since.

Wit that in mind, the largest wave, the downward correction, is wave 4{-2}. It is in its first subwave, wave A{-3}, which in turn is in its final subwave, wave C{-4}.

Wave C{-4} is in its endgame. The C wave has five subwaves, and this C wave is in its fifth, wave E{-5}, the smallest degree covered by this analysis.

What happens next? The end of wave E{-5} will cascade up the fractal hierarchy, also marking the end of waves C{-4} and A{-3}, and the beginning of rising wave B{-3}, the second of three subwaves within the correction, wave 4{-2}.

In corrections that take the form of a Flat, B waves are powerhouses, always retracing 90% of the preceding A wave and usually retracing 100% to 138%. This B wave, B{-3}, is part of a 4th wave correction, and 4th waves tend to be Flats. The A wave in a Flat has three subwaves. It is on wave C{-4}, so it is within this rule.

But sometimes 4th waves take the form of a Zigzag, with five subwaves within the A-wave. What if wave C{-4} isn’t the end of wave A{-3}? That leads to an alternative…

What is the alternative? If wave 4{-2} is in fact taking the form of a Zigzag, then the end of wave E{-5} will the the end of wave C{-4}, but not the end of wave A{-3}. Instead, wave rising wave D{-4} will follow, and when it is complete, then declining wave E{-4} will carry its parent, wave A{-3}, to its end. Only then, under this alternative scenario, does rising wave B{-3} begin.

B waves within Zigzags are less energetic than the Flat variety. They typically retrace 38% to 79% of wave A.

[S&P 500 E-mini futures at 3:30 p.m., 20-minute bars, with volume]

What does Elliott wave theory say? There are two

Principal Analysis: Flat correction scenario

  • Wave 5{0}, an expanding Diagonal Triangle, began on December 26, 2018.
  • Within it, an uptrend, wave 5{-1}, began on October 13, 2022 and is underway.
  • Wave 5{-1} is the parent wave of a downward correction, wave 4{-2}, that began on February 12, 2024.
  • Wave 4{-2} is in its first subwave, wave A{-3}, which in turn is in wave C{-4}, its third and final subwave.
  • Within Wave C{-4}, the middle wave of five subwaves, declining wave E{-5}, is underway and is in its final subwave, wave E{-6}..

Alternative Analysis: Zigzag correction scenario

  • Wave 4{-2} is in its first subwave, wave A{-3}, which in turn is in wave C{-4}, its middle of five subwaves.
  • Within Wave C{-4}, the middle wave of five subwaves, declining wave E{-5}, is underway and is in its final subwave, wave E{-6}.

We Are Here.

These are the waves currently in progress under my principal analysis. Each line on the list shows the wave number, with the subscript in curly brackets, the traditional degree name, the starting date, the starting price of the S&P 500 E-mini futures, and the direction of the wave.

  • S&P 500 Index:
  • 5{+3} Supercycle, 7/8/1932, 4.40 (up)
  • 5{+2} Cycle, 12/9/1974, 60.96 (up)
  • 5{+1} Primary, 3/6/2009, 666.79 (up)
  • 5{0} Intermediate, 12/26/2018, 2346.58 (up)
  • S&P 500 Futures and index:
  • 5{-1} Minor, 10/13/2022, 3502 (up) (futures), 3491.58 (up) (index)
  • S&P 500 Futures:
  • 4{-2} Minute, 2/12/2024, 5066.50 (down)
  • A{-3} Minuette, 2/12/2024, 5066.60 (down)

Reading the chart. Price movements — waves – – in Elliott wave analysis are labeled with numbers within trending waves and letters with corrective waves. The subscripts — numbers in curly brackets — designate the wave’s degree, which, in Elliott wave analysis, means the relative position of a wave within the larger and smaller structures that make up the chart. R.N. Elliott, who in the 1930s developed the form of analysis that bears his name, viewed the chart as a complex structure of smaller waves nested within larger waves, which in turn are nested within still larger waves. In mathematics it’s called a fractal structure, where at every scale the pattern is similar to the others.

Learning and other resources. Elliott wave analysis provides context, not prophecy. As the 20th century semanticist Alfred Korzybski put it in his book Science and Sanity (1933), “The map is not the territory … The only usefulness of a map depends on similarity of structure between the empirical world and the map.” And I would add, in the ever-changing markets, we can judge that similarity of structure only after the fact.

See the menu page Analytical Methods for a rundown on where to go for information on Elliott wave analysis.

By Tim Bovee, Portland, Oregon, February 21, 2024

Disclaimer

Tim Bovee, Private Trader tracks the analysis and trades of a private trader for his own accounts. Nothing in this blog constitutes a recommendation to buy or sell stocks, options or any other financial instrument. The only purpose of this blog is to provide education and entertainment.

No trader is ever 100 percent successful in his or her trades. Trading in the stock and option markets is risky and uncertain. Each trader must make trading decisions for his or her own account, and take responsibility for the consequences.

License
Creative Commons License

All content on Tim Bovee, Private Trader by Timothy K. Bovee is licensed under a Creative Commons Attribution-ShareAlike 4.0 International License.

Based on a work at www.timbovee.com.