Trader’s Notebook

3:30 p.m. New York time

Half an hour before the closing bell. The S&P 500 futures fell during the session from the 5640s to slightly below 5610. The initial subwave of an uptrending 5th wave that began on August 5 continues.

9:35 a.m. New York time

What’s happening now? The S&P 500 E-mini futures moved sideways overnight reaching a low in the 5620s and a high in the 5640s

What does it mean? Elliott Wave Theory sees the pause as part of a subwave within the uptrending 5th ewave that began on August 5.

Which subwave? There’s the problem. In the early stages of a wave, the degree of the subwave –how many levels lower — is more a guess than a calculation. And the only way to come up with reasonable guess is to calculate the duration of the waves that came before, and then to label the current subwave so that it is more or less proportional to the earlier waves.

Which I have done. Here’s a spreadsheet showing the duration of the prior waves and what they imply for the duration of the present 5th wave, labeled wave 5{-5} on the chart. Wave 5{-5} is a subwave of wave 5{-4}, which began on April 18, and I’ve also calculated the length of that larger 5th wave as a total of the subwaves

Prior waves duration
WAVEDEGREESTARTENDDAYSTOTAL
154/18/20245/23/202435
255/23/20245/31/20248
355/31/20247/16/202446
457/16/20248/5/202420
Total109
Current wave duration scenarios
WAVEDEGREESTARTENDDAYSSCENARIO TOTALS
558/5/20249/9/202435144
558/5/20248/13/20248117
558/5/20249/20/202446155
558/5/20248/25/202420129

The four scenarios for the smaller 5th wave — wave 5{-5} — has endings running from August 13 — which means wave 5 has the duration of the previous 2nd wave is already complete — to September 20, meaning the duration is that of the previous 3rd wave.

The present wave 5{-5} has so far lasted for 15 days, far to short a time, it seems to me, for a proportional 5th wave. The most likely comparison among the prior waves is wave 3, usually one of the two longest waves within a trend.

Fifth waves have a lot of variety. There lengths will usually move above the end of the prior 3rd wave, but sometimes a 5th falls short — a truncated wave — and sometimes it goes wildly beyond — extension.

Assuming a 5th of normal duration, I’m redoing the number to assume that wave 5’s length will be similar to that of the prior 3rd wave, with an ending around September 20.

I’ve renumbered the chart to show that the present wave is the 3rd subwave — wave 3{-7} — within the larger 1st subwave — wave 1{-6} — within the uptrending 5th wave — wave 5{-5} — that began on August 5.

If it turns out that the map doesn’t match the terrain — the analysis doesn’t match the chart — then I’ll adjust the wave numbers to conform.

The Chart.
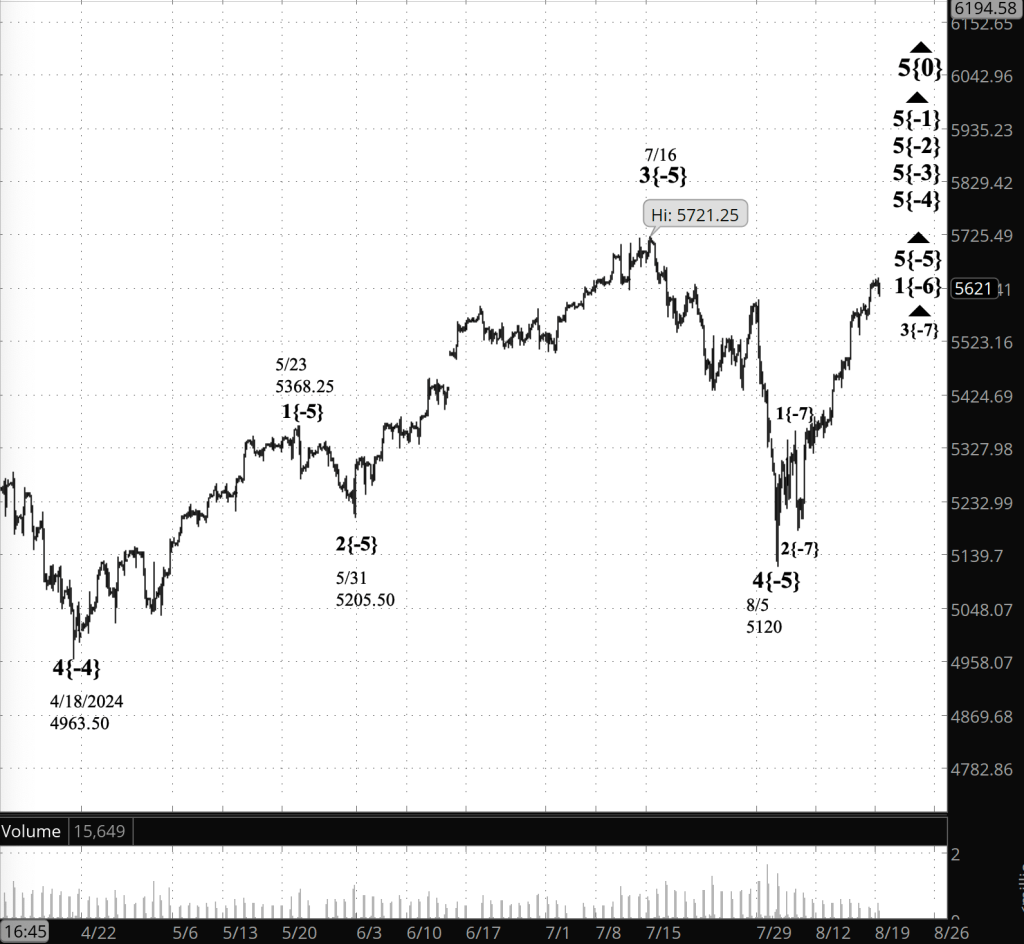
[S&P 500 E-mini futures at 3:30 p.m., 225-minute bars, with volume]

What are the alternatives? See the “Which subwave?” section, above.

What does Elliott wave theory say? Here are the waves that underly the analyses.

Principal Analysis:

  • Rising wave 5{0} is underway. It is a wave of Intermediate degree that began in December 2018.
  • It is in its final subwave, wave 5{-1}.
  • Within wave 5{-1}, rising waves 5{-2}, 5{-3} and 5{-4} are underway, as is wave 5{-5}.
  • Wave 5{-5} is in its initial subwave, wave 1{-6}, which in turn is in its middle subwave, wave 3{-7}.

Reading the chart. Price movements — waves – – in Elliott wave analysis are labeled with numbers within trending waves and letters with corrective waves. The subscripts — numbers in curly brackets — designate the wave’s degree, which, in Elliott wave analysis, means the relative position of a wave within the larger and smaller structures that make up the chart. R.N. Elliott, who in the 1930s developed the form of analysis that bears his name, viewed the chart as a complex structure of smaller waves nested within larger waves, which in turn are nested within still larger waves. In mathematics it’s called a fractal structure, where at every scale the pattern is similar to the others.

Learning and other resources. Elliott wave analysis provides context, not prophecy. As the 20th century semanticist Alfred Korzybski put it in his book Science and Sanity (1933), “The map is not the territory … The only usefulness of a map depends on similarity of structure between the empirical world and the map.” And I would add, in the ever-changing markets, we can judge that similarity of structure only after the fact.

See the menu page Analytical Methods for a rundown on where to go for information on Elliott wave analysis.

By Tim Bovee, Portland, Oregon, August 20, 2024

Disclaimer

Tim Bovee, Private Trader tracks the analysis and trades of a private trader for his own accounts. Nothing in this blog constitutes a recommendation to buy or sell stocks, options or any other financial instrument. The only purpose of this blog is to provide education and entertainment.

No trader is ever 100 percent successful in his or her trades. Trading in the stock and option markets is risky and uncertain. Each trader must make trading decisions for his or her own account, and take responsibility for the consequences.

License
Creative Commons License

All content on Tim Bovee, Private Trader by Timothy K. Bovee is licensed under a Creative Commons Attribution-ShareAlike 4.0 International License.

Based on a work at www.timbovee.com.
Trader’s Notebook

3:30 p.m. New York time

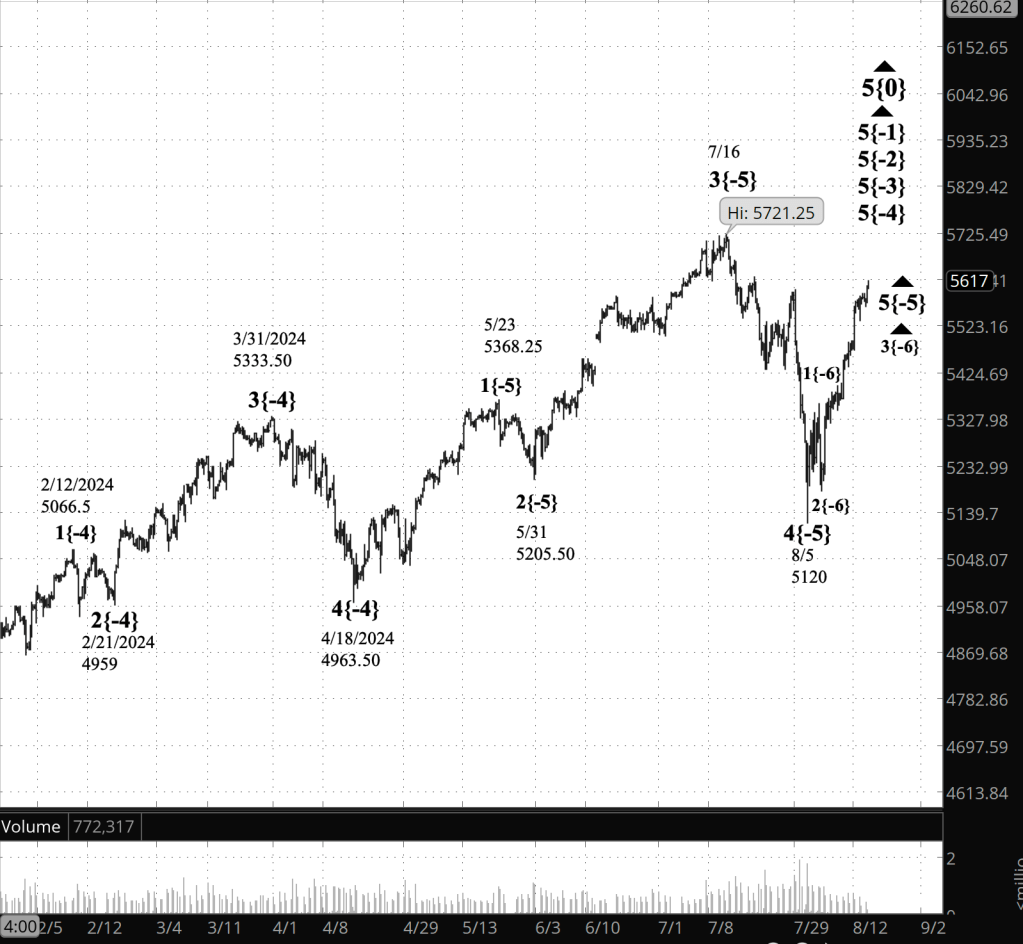
Half an hour before the closing bell. The S&P 500 futures rose during the session, reaching into the 5620s. Elliott Wave Theory: The 5th-wave uptrend that began on August 5 continues and is in its 3rd subwave.

How small are the waves? It’s possible that what I’ve abled as wave 3{-6} is actually wave 1{-6} and it’s in its 3rd subwave, wave 1{-7}.

12:35 a.m. New York time

Elliott Wave Theory rule broken. Shortly after 11 a.m. the S&P 500, index and futures saw the rising 4th-wave on their respective charts move beyond the end of the preceding 1st wave, thereby breaking a firm rule of Elliott Wave Analysis and invalidating this morning’s analysis.

One of the strong points of Elliott Wave Theory is that when the map no longer matches the territory — when the analysis no longer matches the reality of the chart — the situation and the reason is perfectly clear, and the map must be redrawn in order to have a valid analysis.

Compare that to any number of technical analysis tools, where when the predicted uptrend quickly turns into a downtrend, the only clarity is for the trader to nod wisely and mutter, “Ah, a whipsaw”.

A new analysis. To make a new analysis that stayed in compliance with the rules of Elliott Wave Theory, I reworked the analysis from the start of rising wave 3 on February 21. The goal of the relabelling was to ensure that the rise that began on August 5 wasn’t a 4th wave, and so wouldn’t break the rule that invalidated the prior analysis.

Under the new principal analysis, the present rise from August 5 is an uptrending 5th wave that is in its middle subwave, wave 3.

The chart labels are a wave number followed by a subscript in curly brackets showing how many degrees (or levels) the wave is from Intermediate degree. The present Intermediate degree is wave 5{0}. The uptrending 5th wave now underway is wave 5{-5}, and its current subwave is wave 3{-6}.

All of this is happening within a series of 5th waves covering five degrees in the fractal structure. When the present wave 5{-5} is complete, it will cascade up the structure and simultaneously trigger the end of those five larger degrees: waves 5{-4}, 5{-3}, 5{-2}, 5{-1} and the Intermediate degree, wave 5{0}, which began in December 2018.

Moreover, there are three larger 5th waves above wave 5{0}. They will also be triggered by the end of wave 5{-5}. From smaller to larger, they are wave 5{+1}, Primary degree, which began in March 2009, wave 5{+2}, Cycle degree, which began in December 1974, and wave 5{+3}, Supercycle degree, which began in July 1932. Not a typo. The present Supercycle degree wave began in the Great Depression of the 1930s the year before Franklin D. Roosevelt took the oath of office as president.

Is this nuts? All of that seems a bit crazy, but has been baked into the fractal model of Elliott Wave Theory from its development by R.N. Elliott in the 1930s. A look at any chart — long term or short — clearly shows that larger waves have smaller subwaves, which in turn has subwaves that are smaller still.

And so it goes, from the smallest level to the largest. Elliott Wave Theory, by recognizing this complexity rather than seeing the chart as merely a squiggly line, makes it possible for us to do an analysis wherein a relatively small 5th wave ends and in so doing, triggers the end of a 5th wave eight degrees higher whose begining was eight years ago.

Out of caution, I intend to spend this week working with very long charts to ensure that this underlying structure of this analysis is valid, and shall report any findings here in Trader’s Notebook.

9:35 a.m. New York time

What’s happening now? The S&P 500 E-mini futures set a new high on Friday, 5593.75, half an hour before the closing bell. When trading resumed overnight the price pulled back slightly, into the 5560s, before rersing slightly.

What does it mean? Friday’s high is important because of a rule of Elliott Wave Theory. Applied to the chart, it goes like this:

  • A 4th-wave upward correction began on August 5th and is still underway.
  • The preceding 1st wave ended on April 1 at 3600.75.
  • A 4th wave can never move beyond the end of the preceding 3rd wave.
  • Friday’s high is fewer than 10 points away of breaking that rule.

If the price does move above 3600.75, then the analysis no longer matches the reality of the chart and will be revised. Maybe. The S&P 500 futures are one of many products tied to the S&P 500 index. The futures move in 25-cent increments, the index in 1-cent increments. If the futures move above the end of wave 1 but the index does not, then perhaps it’s a case of rounding error. After all, which S&P 500 product set sets the standard? The futures, the SPY ETF, or the S&P 500 the index itself. I tend to give greatest credence to the index, but when there’s a divergence, I look hard at the problem to see if that approach is wrong.

On the index, Friday’s peak was 5554.25 and wave 1 ended on August 1 at 5566.16. If the index moves above 5554.25, then it has validated a rule of Elliott Wave Theory and there is no ambiguity about the analysis requiring revisions.

I’ve simplified the Fibonacci retracement ladder, in red, that appeared on earlier futures charts to show the 100% retracement: 5600.75, beyond which the 4th-wave cannot rise, and the top two Fibonacci retracement levels: 78.6% and 61.8%.

See the “What does it mean?” section in Friday’s Trader’s Notebook for a discussion of what happens after wave 4 ends.

[S&P 500 E-mini futures at 3:30 p.m., 360-minute bars, with volume]

What does Elliott wave theory say? Here are the waves that underly the analyses.

Principal Analysis:

[I have redone this to conform to the new analysis.]

  • Rising wave 5{0} is underway. It is a wave of Intermediate degree that began in December 2018.
  • It is in its final subwave, wave 5{-1}.
  • Within wave 5{-1}, rising waves 5{-2}, 5{-3} and 5{-4} are underway, as is wave 5{-5}.
  • Wave 5{-5} is in its middle subwave, wave 3{-6}.

Reading the chart. Price movements — waves – – in Elliott wave analysis are labeled with numbers within trending waves and letters with corrective waves. The subscripts — numbers in curly brackets — designate the wave’s degree, which, in Elliott wave analysis, means the relative position of a wave within the larger and smaller structures that make up the chart. R.N. Elliott, who in the 1930s developed the form of analysis that bears his name, viewed the chart as a complex structure of smaller waves nested within larger waves, which in turn are nested within still larger waves. In mathematics it’s called a fractal structure, where at every scale the pattern is similar to the others.

Learning and other resources. Elliott wave analysis provides context, not prophecy. As the 20th century semanticist Alfred Korzybski put it in his book Science and Sanity (1933), “The map is not the territory … The only usefulness of a map depends on similarity of structure between the empirical world and the map.” And I would add, in the ever-changing markets, we can judge that similarity of structure only after the fact.

See the menu page Analytical Methods for a rundown on where to go for information on Elliott wave analysis.

By Tim Bovee, Portland, Oregon, August 19, 2024

Disclaimer

Tim Bovee, Private Trader tracks the analysis and trades of a private trader for his own accounts. Nothing in this blog constitutes a recommendation to buy or sell stocks, options or any other financial instrument. The only purpose of this blog is to provide education and entertainment.

No trader is ever 100 percent successful in his or her trades. Trading in the stock and option markets is risky and uncertain. Each trader must make trading decisions for his or her own account, and take responsibility for the consequences.

License
Creative Commons License

All content on Tim Bovee, Private Trader by Timothy K. Bovee is licensed under a Creative Commons Attribution-ShareAlike 4.0 International License.

Based on a work at www.timbovee.com.
Trader’s Notebook

3:30 p.m.. New York time

Half an hour before the closing bell. In this morning’s alternative analysis I wrote, “It’s almost always possible for a price to reverse and go a little bit higher”. And so it did.

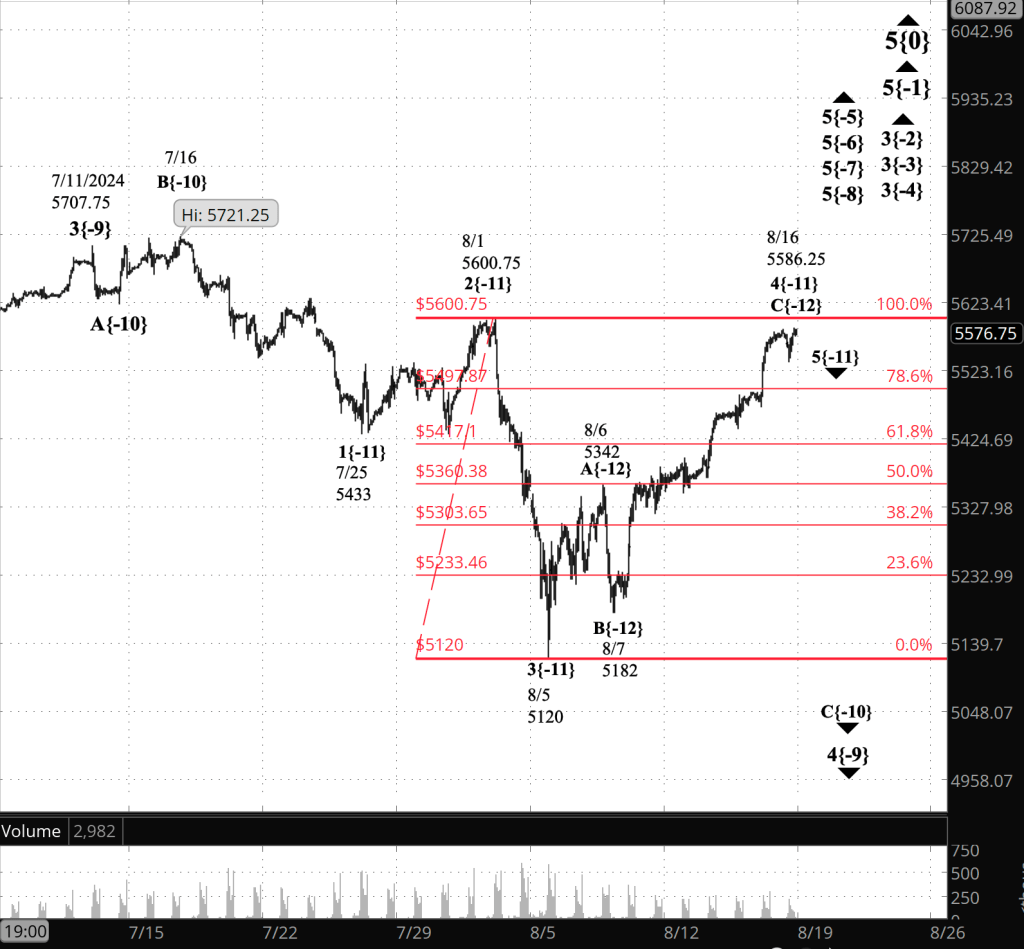
During the session the S&P 500 futures reversed and rose three points higher than the overnight peak, reaching 5586.25. It was a continuation of the final subwave, wave C, within the 4th-wave upward upward correction that began on August 5.

Did the 4th wave end at the new peak, or can it still go a bit higher? A 4th wave can’t move beyond the end of preceding 1st wave. That’s a firm rule in Elliott Wave Theory. The 1st wave ended at 5600.75, and so anywhere below that level there’s still the chance that wave 4 will go a bit higher.

Nonetheless, given how close as the price is to that rule-based upper barrier, I’ve decided to retain this morning’s analysis, marking the session peak as the end of the 4th-wave upward correction and the beginning of downtrending 5th wave.

Three possible outcomes:

  • The price continues to decline, meaning wave 5 is underway
  • The price goes a bit higher but remains at or below 5600.75, meaning wave 4 continued.
  • The price rises beyond 5600.75, meaning the present analysis gets tossed in the trash in favor of a new analysis in which the price complies with the rule.

Time will tell.

9:35 a.m. New York time

What’s happening now? The S&P 500 E-mini futures fell overnight, from 5583.25 into the 5530s.

What does it mean? Using Elliott Wave Theory for the analysis, I’ve concluded that the 4th-wave upward correction that began on August 5 ended at the overnight high, 5583.25, and a downtrending 5th wave has begun.

Fifth waves have a tendency to move beyond the end of the preceding 3rd wave, although sometimes a 5th wave will come up short, a condition called “truncation” by R.N. Elliott, who the developed the theory that bears his name.

In the case of the current 5th wave, the preceding 3rd wave ended at 5120. Elliott Wave Theory is silent on how far below that level the 5th wave might travel.

The preceding 3rd wave took five days to reach completion, and the 4th wave that followed took twice as long, which gives a hit at how long the 5th wave will continue — call it one or two weeks. However, some 5th waves are extended, covering more distance over more time that a trader would expect. So the future of this wave 5 is a matter of tendencies, not rules.

After the 5th wave. Truth be told, wave 5 is of a rather small degree within the fractal structure of the chart. However, its end will trigger much larger events as it cascades up the fractal structure.

Waves on the chart are labeled with the wave number and a subscript in curly brackets denoting the wave’s distance from Intermediate degree. The present Intermediate degree movment is wave 5{0}, which began in December 2018.

The downtrending 5th-wave now underway is wave 5{-11}. It is a subwave of wave C{-10}, the final wave of a downward correction, wave 4{-9}, which began on June 11.

Wave 4{-9} will be followed by uptrend wave 5{-9}, which, if typical, will move above 5707.75, the end of the preceding 3rd wave. The end of wave 5{-9} will trigger the end of a series of 5th waves, each one degree larger than the one before: Wave 5{-8} through wave 5{-5}.

It will also be the end of the parent wave 3{-4}, which began on February 21 and which will be followed by a downward correction, wave 4{-4}, which is seven degrees larger than the 4th-wave upward correction just ended.

[S&P 500 E-mini futures at 3:30 p.m., 70-minute bars, with volume]

What are the alternatives? Identifying the end of a wave is often little more than an educated guess. It’s almost always possible for a price to reverse and go a little bit higher. That may be the case with the overnight high.

I’ve chosen to mark that high as the end of the 4th wave for two reasons: First, the downward movement is larger than those we’ve previously seen within wave C{-12}, the final subwave of the 4th-wave upward correction, wave 4{-11}, and second, by a firm rule of Elliott Wave Theory, wave 4{-11} cannot move beyond the start of the previous 3rd wave, 5600.25. The overnight high is less than 20 points away from that firm endpoint, and so in any case, wave 4{-11} would have very little upside left.

On the chart I’ve retained the Fibonacci ladder, in red, for the 4th-wave retracement of the preceding 3rd wave, to show how close wave 4{-11} came to a 100% retracement, the absolute boundary beyond which it could not rise.

What does Elliott wave theory say? Here are the waves that underly the analyses.

Principal Analysis:

  • Rising wave 5{0} is underway. It is a wave of Intermediate degree that began in December 2018.
  • It is in its final subwave, wave 5{-1}.
  • Within wave 5{-1}, rising waves 3{-2}, 3{-3} and 3{-4} are underway, as is wave 5{-5}.
  • Wave 5{-6} is underway and is in its final subwave, uptrending wave 5{-7}, which in turn is in its final subwave, uptrending wave 5{-8}.
  • Within wave 5{-8}, wave 4{-9}, a downward correction, is in progress.
  • Wave 4{-9} is in its final subwave, wave C{-10}.
  • Wave C{-10} is in its final subwave, wave 5{-11}.

Reading the chart. Price movements — waves – – in Elliott wave analysis are labeled with numbers within trending waves and letters with corrective waves. The subscripts — numbers in curly brackets — designate the wave’s degree, which, in Elliott wave analysis, means the relative position of a wave within the larger and smaller structures that make up the chart. R.N. Elliott, who in the 1930s developed the form of analysis that bears his name, viewed the chart as a complex structure of smaller waves nested within larger waves, which in turn are nested within still larger waves. In mathematics it’s called a fractal structure, where at every scale the pattern is similar to the others.

Learning and other resources. Elliott wave analysis provides context, not prophecy. As the 20th century semanticist Alfred Korzybski put it in his book Science and Sanity (1933), “The map is not the territory … The only usefulness of a map depends on similarity of structure between the empirical world and the map.” And I would add, in the ever-changing markets, we can judge that similarity of structure only after the fact.

See the menu page Analytical Methods for a rundown on where to go for information on Elliott wave analysis.

By Tim Bovee, Portland, Oregon, August 16, 2024

Disclaimer

Tim Bovee, Private Trader tracks the analysis and trades of a private trader for his own accounts. Nothing in this blog constitutes a recommendation to buy or sell stocks, options or any other financial instrument. The only purpose of this blog is to provide education and entertainment.

No trader is ever 100 percent successful in his or her trades. Trading in the stock and option markets is risky and uncertain. Each trader must make trading decisions for his or her own account, and take responsibility for the consequences.

License
Creative Commons License

All content on Tim Bovee, Private Trader by Timothy K. Bovee is licensed under a Creative Commons Attribution-ShareAlike 4.0 International License.

Based on a work at www.timbovee.com.

Trader’s Notebook

3:30 p.m. New York time

Half an hour before the closing bell. The S&P 500 futures continued to rise during the session, reaching into the 5560s. This morning’s analysis stands: The 4th-wave upward correction that began on August 5 continues to work through its endgame.

9:35 a.m. New York time

What is a trend? Look below for “A note on inflation”, a discussion of yesterday’s inflation data. My conclusion: It’s not yet time to declare victory over inflation.

What’s happening now? The S&P 500 E-mini futures rose sharply an hour before the opening bell after the weekly Jobless Claims Report showed a decline. The price reached the 5530s in the overnight session, pushing above the 78.6% Fibonacci retracement level.

What does it mean? The sharp rise, seen through the lens of Elliott Wave Theory, increases the likelihood that the final subwave — wave 5 — within the final subwave — wave C — within the 4th-wave upward correction that began on August 5 is underway.

One rule of Elliott Wave Theory says that a 4th-wave never moves beyond the end of the preceding 1st wave. The preceding 1st wave in this case ended at 5600.75. If the price moves beyond that level, then the analysis will need to be redone.

[S&P 500 E-mini futures at 3:30 p.m., 70-minute bars, with volume]

What are the alternatives? We’re at a point where the present low-degree C wave — wave C{-12} — is routinely reaching new highs, and in high carries the possibility that it is the end of wave C and of its parent 4th wave. Only the price movements that follow each high can tell us whether wave C has in fact ended.

What does Elliott wave theory say? Here are the waves that underly the analyses.

Principal Analysis:

  • Rising wave 5{0} is underway. It is a wave of Intermediate degree that began in December 2018.
  • It is in its final subwave, wave 5{-1}.
  • Within wave 5{-1}, rising waves 3{-2}, 3{-3} and 3{-4} are underway, as is wave 5{-5}.
  • Wave 5{-6} is underway and is in its final subwave, uptrending wave 5{-7}, which in turn is in its final subwave, uptrending wave 5{-8}.
  • Within wave 5{-8}, wave 4{-9}, a downward correction, is in progress.
  • Wave 4{-9} is in its final subwave, wave C{-10}.
  • Wave C{-10} is in its next-to-the-last subwave, wave 4{-11}, which in turn is in its final subwave, wave C{-12}.
  • Wave C{-12} is in its final subwave, wave 5{-13}.

A note on inflation. Yesterday’s Consumer Price Index report for July prompted many happy-talk headlines noting that inflation had fallen below 3% for the first time since 2021. I’m all for happy talk, but I don’t think that the latest inflation numbers deserve it.

Inflation, like stock prices, is about trends. When I was a rookie trader, one of my wise mentors quite often said, “It takes three prices to make a trend.” A single rise, or a year-over-year comparison of a price, doesn’t tell the trader anything about a trend that’s useful for the next trade. Same thing goes for economic data released monthly, such as inflation,

So I downloaded the CPI data into a spreadsheet and did some math that applied the 3-data-point method.

First interesting finding: Using the 3-data-point method, there has never been a downtrend in inflation since the first month for which we have records, January 1947. So if this tendency holds, the prices we have when inflation is over will likely be the prices, more or less, that we’ll be living with until the next inflation kicks in.

Yesterday’s inflation report, for July, did not indicate an uptrend. The last three monthly reports have two inflation increases (including the most recent one) and one decrease. So there is no trend at present. The June report wasn’t part of an uptrend, either; those three months had two increases and one decrease.

The most recent trend was the May 2024 inflation report, which was part of three uptrending months in a row. It was the final month of an uptrend that began in October 2022 and lasted 20 months, through last May. Before that there were three trendless months, and then another series of trending months lasting from August 2020 to August 2020, lasting 23 months.

Out of 931 months since records began in January 1947, there have been uptrends in 624 months, or 67.2% of the 931-month total, and no trends in 305 months, or 32.8% of the total.

Bottom line: Happy talk makes me nervous, and when I hear it, I look for verification. This data shows there is no uptrend to justify happy talk as of yet.

For anyone interested, the spreadsheet may be viewed here.

Reading the chart. Price movements — waves – – in Elliott wave analysis are labeled with numbers within trending waves and letters with corrective waves. The subscripts — numbers in curly brackets — designate the wave’s degree, which, in Elliott wave analysis, means the relative position of a wave within the larger and smaller structures that make up the chart. R.N. Elliott, who in the 1930s developed the form of analysis that bears his name, viewed the chart as a complex structure of smaller waves nested within larger waves, which in turn are nested within still larger waves. In mathematics it’s called a fractal structure, where at every scale the pattern is similar to the others.

Learning and other resources. Elliott wave analysis provides context, not prophecy. As the 20th century semanticist Alfred Korzybski put it in his book Science and Sanity (1933), “The map is not the territory … The only usefulness of a map depends on similarity of structure between the empirical world and the map.” And I would add, in the ever-changing markets, we can judge that similarity of structure only after the fact.

See the menu page Analytical Methods for a rundown on where to go for information on Elliott wave analysis.

By Tim Bovee, Portland, Oregon, August 15, 2024

Disclaimer

Tim Bovee, Private Trader tracks the analysis and trades of a private trader for his own accounts. Nothing in this blog constitutes a recommendation to buy or sell stocks, options or any other financial instrument. The only purpose of this blog is to provide education and entertainment.

No trader is ever 100 percent successful in his or her trades. Trading in the stock and option markets is risky and uncertain. Each trader must make trading decisions for his or her own account, and take responsibility for the consequences.

License
Creative Commons License

All content on Tim Bovee, Private Trader by Timothy K. Bovee is licensed under a Creative Commons Attribution-ShareAlike 4.0 International License.

Based on a work at www.timbovee.com.

Trader’s Notebook

3:30 p.m. New York time

Half an hour before the closing bell. The S&P 500 futures rose into the 5480s during the session and then drew back into the 5460s. This morning’s Elliott Wave Theory analysis is unchanged: The final subwave within the 4th-wave upward correction that began on August 5 continues. The session rise brought the 4th-wave close to the 78.6% Fibonacci retracement level.

9:35 a.m. New York time

What’s happening now? The S&P 500 E-mini futures traded sideways in a narrow range overnight until the latest Consumer Price Index data was released an hour before the opening bell. At that point the price whipsawed between the 5470s and the 5440s before coming to a rest in the 5460s, about where it had been before the release.

What does it mean? Elliott Wave Theory, when applied to the chart, sees the brief overnight drama as being a subwave buried in the final subwave of the 4th-wave upward correction that began on August 5.

The correction is of fairly low degree. When it is complete, a 5th wave downtrend will follow, bringing to an end the final subwave of a larger 4th-wave downward correction that began on July 11.

The end of that larger correction will be followed by a 5th-wave uptrend that will carry the price back into the 5700s or higher.

And the end of that 5th wave will trigger the end of a series of four other 5th waves of increasing size, which will also be the end of the wave that encompasses all that’s happening on the chart, a 3rd-wave uptrend that began on February 21 from 4959. A sizable 4th-wave downward correction will follow.

All in all, it should be quite a roller-coaster ride.

The whipsaw left the price midway between between the 61.8% and a 71.6% Fibonacci retracement levels of the 3rd-wave that preceded wave 4. The Fibonacci ladder is shown on the chart in read.

[S&P 500 E-mini futures at 3:30 p.m., hourly bars, with volume]

What are the alternatives? Unchanged from yesterday. We’re at a point where the present low-degree C wave — wave C{-12} — is routinely reaching new highs, and in high carries the possibility that it is the end of wave C and of its parent 4th wave. Only the price movements that follow each high can tell us whether wave C has in fact ended.

What does Elliott wave theory say? Here are the waves that underly the analyses.

Principal Analysis:

  • Rising wave 5{0} is underway. It is a wave of Intermediate degree that began in December 2018.
  • It is in its final subwave, wave 5{-1}.
  • Within wave 5{-1}, rising waves 3{-2}, 3{-3} and 3{-4} are underway, as is wave 5{-5}.
  • Wave 5{-6} is underway and is in its final subwave, uptrending wave 5{-7}, which in turn is in its final subwave, uptrending wave 5{-8}.
  • Within wave 5{-8}, wave 4{-9}, a downward correction, is in progress.
  • Wave 4{-9} is in its final subwave, wave C{-10}.
  • Wave C{-10} is in its next-to-the-last subwave, wave 4{-11}, which in turn is in its final subwave, wave C{-12}.

Reading the chart. Price movements — waves – – in Elliott wave analysis are labeled with numbers within trending waves and letters with corrective waves. The subscripts — numbers in curly brackets — designate the wave’s degree, which, in Elliott wave analysis, means the relative position of a wave within the larger and smaller structures that make up the chart. R.N. Elliott, who in the 1930s developed the form of analysis that bears his name, viewed the chart as a complex structure of smaller waves nested within larger waves, which in turn are nested within still larger waves. In mathematics it’s called a fractal structure, where at every scale the pattern is similar to the others.

Learning and other resources. Elliott wave analysis provides context, not prophecy. As the 20th century semanticist Alfred Korzybski put it in his book Science and Sanity (1933), “The map is not the territory … The only usefulness of a map depends on similarity of structure between the empirical world and the map.” And I would add, in the ever-changing markets, we can judge that similarity of structure only after the fact.

See the menu page Analytical Methods for a rundown on where to go for information on Elliott wave analysis.

By Tim Bovee, Portland, Oregon, August 14, 2024

Disclaimer

Tim Bovee, Private Trader tracks the analysis and trades of a private trader for his own accounts. Nothing in this blog constitutes a recommendation to buy or sell stocks, options or any other financial instrument. The only purpose of this blog is to provide education and entertainment.

No trader is ever 100 percent successful in his or her trades. Trading in the stock and option markets is risky and uncertain. Each trader must make trading decisions for his or her own account, and take responsibility for the consequences.

License
Creative Commons License

All content on Tim Bovee, Private Trader by Timothy K. Bovee is licensed under a Creative Commons Attribution-ShareAlike 4.0 International License.

Based on a work at www.timbovee.com.

Trader’s Notebook

3:30 p.m. New York time

Half an hour before the closing bell. The S&P 500 futures have risen into the 5450s during the session. Elliott Wave Theory analysis suggests that today’s rise is the final subwave — wave 5 — within the larger final subwave — wave C — within the 4th-wave upward correction that began on August 5, although there is a bit of ambiguity in the pattern traced by the smaller subwaves. The rise has taken the price above the 61.8% Fibonacci retracement level without a pause.

9:35 a.m. New York time

What’s happening now? The S&P 500 E-mini futures zig-zagged overnight, rising to nearly 5410 with the release of new Producer Price Index statistics as the opening bell approached.

What does it mean? Elliott Wave Theory analysis shows that the 4th-wave upward correction that began on August 5 continues and is in its final subwave, wave C.

I’ve placed a Fibonacci ladder on the chart, in red, to measure how much of the preceding 3rd the current 4th wave has retraced. Wave 4 turns out to be something of an over-performer. A 4th wave tends to retrace a Fibonacci 38.2% of the 3rd wave. The present retracement is approaching 61.8%.

In Elliott Wave Theory, Fibonacci retracement levels are tendencies, not firm rules. Nonetheless, the present retracement level suggests that wave 4 is very near its end. When the 4th-wave is complete, a 5th-wave downtrend will follow.

See the August 12 Trader’s Notebook for a discussion of what happens after that.

[S&P 500 E-mini futures at 3:30 p.m., hourly bars, with volume]

What are the alternatives? Unchanged from yesterday. We’re at a point where the present low-degree C wave — wave C{-12} — is routinely reaching new highs, and in high carries the possibility that it is the end of wave C and of its parent 4th wave. Only the price movements that follow each high can tell us whether wave C has in fact ended.

What does Elliott wave theory say? Here are the waves that underly the analyses.

Principal Analysis:

  • Rising wave 5{0} is underway. It is a wave of Intermediate degree that began in December 2018.
  • It is in its final subwave, wave 5{-1}.
  • Within wave 5{-1}, rising waves 3{-2}, 3{-3} and 3{-4} are underway, as is wave 5{-5}.
  • Wave 5{-6} is underway and is in its final subwave, uptrending wave 5{-7}, which in turn is in its final subwave, uptrending wave 5{-8}.
  • Within wave 5{-8}, wave 4{-9}, a downward correction, is in progress.
  • Wave 4{-9} is in its final subwave, wave C{-10}.
  • Wave C{-10} is in its next-to-the-last subwave, wave 4{-11}, which in turn is in its final subwave, wave C{-12}.

Reading the chart. Price movements — waves – – in Elliott wave analysis are labeled with numbers within trending waves and letters with corrective waves. The subscripts — numbers in curly brackets — designate the wave’s degree, which, in Elliott wave analysis, means the relative position of a wave within the larger and smaller structures that make up the chart. R.N. Elliott, who in the 1930s developed the form of analysis that bears his name, viewed the chart as a complex structure of smaller waves nested within larger waves, which in turn are nested within still larger waves. In mathematics it’s called a fractal structure, where at every scale the pattern is similar to the others.

Learning and other resources. Elliott wave analysis provides context, not prophecy. As the 20th century semanticist Alfred Korzybski put it in his book Science and Sanity (1933), “The map is not the territory … The only usefulness of a map depends on similarity of structure between the empirical world and the map.” And I would add, in the ever-changing markets, we can judge that similarity of structure only after the fact.

See the menu page Analytical Methods for a rundown on where to go for information on Elliott wave analysis.

By Tim Bovee, Portland, Oregon, August 13, 2024

Disclaimer

Tim Bovee, Private Trader tracks the analysis and trades of a private trader for his own accounts. Nothing in this blog constitutes a recommendation to buy or sell stocks, options or any other financial instrument. The only purpose of this blog is to provide education and entertainment.

No trader is ever 100 percent successful in his or her trades. Trading in the stock and option markets is risky and uncertain. Each trader must make trading decisions for his or her own account, and take responsibility for the consequences.

License
Creative Commons License

All content on Tim Bovee, Private Trader by Timothy K. Bovee is licensed under a Creative Commons Attribution-ShareAlike 4.0 International License.

Based on a work at www.timbovee.com.
Trader’s Notebook

3:30 p.m. New York time

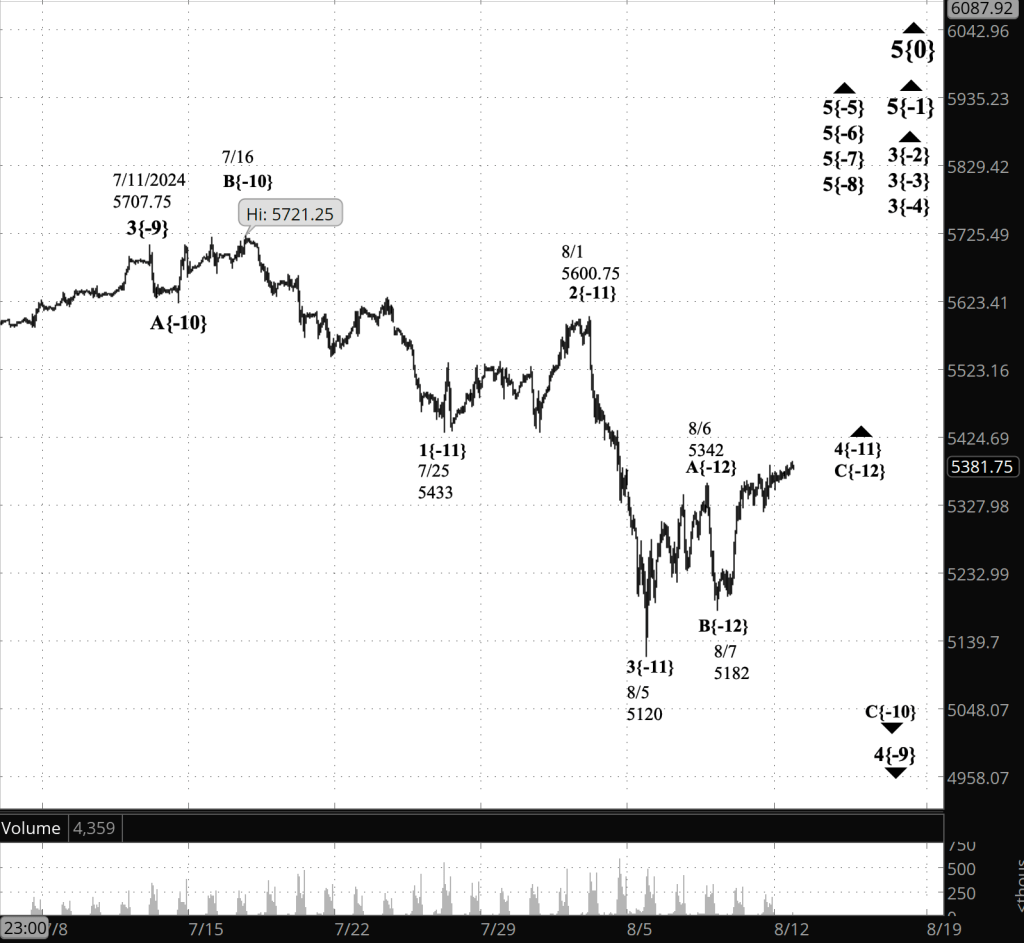
Half an hour before the closing bell. The S&P 500 futures reached a high in the 5390s during the session and then withdrew, so far reaching the 5350s. This morning’s Elliott Wave Theory analysis stands unchanged. The final subwave, wave C, of the 4th wave upward correction that began on August 5 continues to work through its endgame.

9:35 a.m. New York time

What’s happening now? The S&P 500 E-mini futures crept higher after trading resumed overnight, from the 5350s to the 5380s.

What does it mean? Elliott Wave Theory analysis sees the movement as follows: The final subwave of a low-degree 4th-wave upward correction continues. The 4th wave began on August 5 and the final subwave, wave C, on August 7.

When wave C is complete, it will be the end of the parent 4th wave and the beginning of a 5th-wave downtrend that will most likely carry the pride below 5120 — the end of the preceding 3rd wave — and perhaps significantly below that level. Occasionally, 5th waves are truncated, and if that’s the case with this wave, then it will end somewhere above 5120.

The waves are labeled on the chart with the wave number and a subscript in curly brackets showing the degree’s distance from Intermediate degree. The present Intermediate degree wave, labeled 5{0}, began in December 2018.

The 4th-wave downward correction is labeled 4{-11} and its final subwave, wave C{-12}. The future 5th wave is wave 5{-12}.

After the 5th. Those waves are all part of the final subwave, wave C, of a larger 4th-wave downward correction that began on July 11 — wave C{-10} within wave 4{-9} on the chart.

The end of that larger 4th wave will be followed by a rising 5th wave that will carry the price above 5707.75, and perhaps significantly above that level. Unless, of course, the 5th wave truncates — comes up short — as some 5th waves do. The rising 5th wave is labeled wave 5{-9} on the chart.

The end of that 5th wave will be like a bowling ball hitting the pins. The event will be the end of a series of four 5th waves, each “pin” falling against a 5th-wave one-degree higher, in a series of endings. The four 5th waves, on the chart, are labeled waves 5{-8}, 5{-7}, 5{-6} and 5{-5}.

Above them all is a rising 3rd wave — wave 3{-4} on the chart — which began on February 21 from 4959. The 4th-wave downward correction that follows — wave 4{-4} — will be of significant size and duration.

[S&P 500 E-mini futures at 3:30 p.m., hourly bars, with volume]

What are the alternatives? We’re at a point where the present low-degree C wave — wave C{-12} — is routinely reaching new highs, and in high carries the possibility that it is the end of wave C and of its parent 4th wave. Only the price movements that follow each high can tell us whether wave C has in fact ended. It’s an example of the ambiguity that is part of Elliott Wave Theory.

What does Elliott wave theory say? Here are the waves that underly the analyses.

Principal Analysis:

  • Rising wave 5{0} is underway. It is a wave of Intermediate degree that began in December 2018.
  • It is in its final subwave, wave 5{-1}.
  • Within wave 5{-1}, rising waves 3{-2}, 3{-3} and 3{-4} are underway, as is wave 5{-5}.
  • Wave 5{-6} is underway and is in its final subwave, uptrending wave 5{-7}, which in turn is in its final subwave, uptrending wave 5{-8}.
  • Within wave 5{-8}, wave 4{-9}, a downward correction, is in progress.
  • Wave 4{-9} is in its final subwave, wave C{-10}.
  • Wave C{-10} is in its next-to-the-last subwave, wave 4{-11}, which in turn is in its final subwave, wave C{-12}.

Reading the chart. Price movements — waves – – in Elliott wave analysis are labeled with numbers within trending waves and letters with corrective waves. The subscripts — numbers in curly brackets — designate the wave’s degree, which, in Elliott wave analysis, means the relative position of a wave within the larger and smaller structures that make up the chart. R.N. Elliott, who in the 1930s developed the form of analysis that bears his name, viewed the chart as a complex structure of smaller waves nested within larger waves, which in turn are nested within still larger waves. In mathematics it’s called a fractal structure, where at every scale the pattern is similar to the others.

Learning and other resources. Elliott wave analysis provides context, not prophecy. As the 20th century semanticist Alfred Korzybski put it in his book Science and Sanity (1933), “The map is not the territory … The only usefulness of a map depends on similarity of structure between the empirical world and the map.” And I would add, in the ever-changing markets, we can judge that similarity of structure only after the fact.

See the menu page Analytical Methods for a rundown on where to go for information on Elliott wave analysis.

By Tim Bovee, Portland, Oregon, August 12, 2024

Disclaimer

Tim Bovee, Private Trader tracks the analysis and trades of a private trader for his own accounts. Nothing in this blog constitutes a recommendation to buy or sell stocks, options or any other financial instrument. The only purpose of this blog is to provide education and entertainment.

No trader is ever 100 percent successful in his or her trades. Trading in the stock and option markets is risky and uncertain. Each trader must make trading decisions for his or her own account, and take responsibility for the consequences.

License
Creative Commons License

All content on Tim Bovee, Private Trader by Timothy K. Bovee is licensed under a Creative Commons Attribution-ShareAlike 4.0 International License.

Based on a work at www.timbovee.com.
Trader’s Notebook

3:30 p.m. New York time

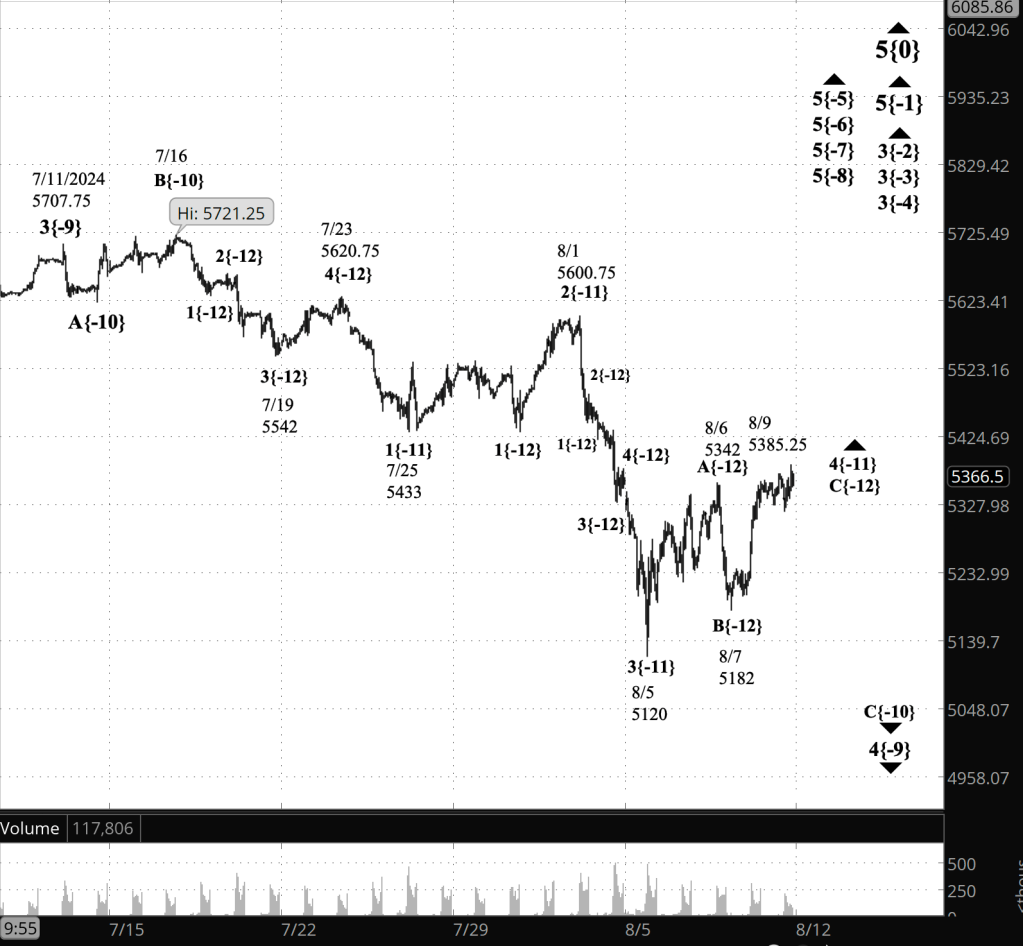
Half an hour before the closing bell. The S&P 500 futures rose higher during the session, reaching 5385.25 and then reversing a little.

The day session brought no change to the Elliott Wave Theory analysis. Wave C of the 4th-wave upward correction that began on July 11 continues.

A calming end to a dramatic week.

9:35 a.m. New York time

What’s happening now? The S&P 500 E-mini futures reached a turning point at 5372 overnight, thereafter falling to slightly below 5320.

What does it mean? Using Elliott Wave Theory, I’ve reworked the subwave labeling within the 4th-wave decline that began on July 11. The prior numbering had a 3rd subwave that was the shortest of the set, something disallowed by the rule sof Elliott Wave Theory.

The end result is unchanged from yesterday’s analysis: The 4th-wave upward correction that began on August 5 continues and is in its final subwave, rising wave C. The degree labeling of some of the waves have been raised by one degree from yesterday’s analysis.

See Thursday’s Trader’s Notebook to compare this altered analysis with the prior analysis.

[S&P 500 E-mini futures at 3:30 p.m., 55-minute bars, with volume]

What are the alternatives? It is possible that the rising C wave ended at the overnight high, 5372, ending the rising upward correction and beginning the final subwave within the final subwave within larger 4th-wave downward correction that began on July 16.

What does Elliott wave theory say? Here are the waves that underly the analyses.

Principal Analysis:

  • Rising wave 5{0} is underway. It is a wave of Intermediate degree that began in December 2018.
  • It is in its final subwave, wave 5{-1}.
  • Within wave 5{-1}, rising waves 3{-2}, 3{-3} and 3{-4} are underway, as is wave 5{-5}.
  • Wave 5{-6} is underway and is in its final subwave, uptrending wave 5{-7}, which in turn is in its final subwave, uptrending wave 5{-8}.
  • Within wave 5{-8}, wave 4{-9}, a downward correction, is in progress.
  • Wave 4{-9} is in its final subwave, wave C{-10}.
  • Wave C{-10} is in its next-to-the-last subwave, wave 4{-11}, which in turn is in its final subwave, wave C{-12}.

Reading the chart. Price movements — waves – – in Elliott wave analysis are labeled with numbers within trending waves and letters with corrective waves. The subscripts — numbers in curly brackets — designate the wave’s degree, which, in Elliott wave analysis, means the relative position of a wave within the larger and smaller structures that make up the chart. R.N. Elliott, who in the 1930s developed the form of analysis that bears his name, viewed the chart as a complex structure of smaller waves nested within larger waves, which in turn are nested within still larger waves. In mathematics it’s called a fractal structure, where at every scale the pattern is similar to the others.

Learning and other resources. Elliott wave analysis provides context, not prophecy. As the 20th century semanticist Alfred Korzybski put it in his book Science and Sanity (1933), “The map is not the territory … The only usefulness of a map depends on similarity of structure between the empirical world and the map.” And I would add, in the ever-changing markets, we can judge that similarity of structure only after the fact.

See the menu page Analytical Methods for a rundown on where to go for information on Elliott wave analysis.

By Tim Bovee, Portland, Oregon, August 9, 2024

Disclaimer

Tim Bovee, Private Trader tracks the analysis and trades of a private trader for his own accounts. Nothing in this blog constitutes a recommendation to buy or sell stocks, options or any other financial instrument. The only purpose of this blog is to provide education and entertainment.

No trader is ever 100 percent successful in his or her trades. Trading in the stock and option markets is risky and uncertain. Each trader must make trading decisions for his or her own account, and take responsibility for the consequences.

License
Creative Commons License

All content on Tim Bovee, Private Trader by Timothy K. Bovee is licensed under a Creative Commons Attribution-ShareAlike 4.0 International License.

Based on a work at www.timbovee.com.
Trader’s Notebook

3:30 p.m. New York time

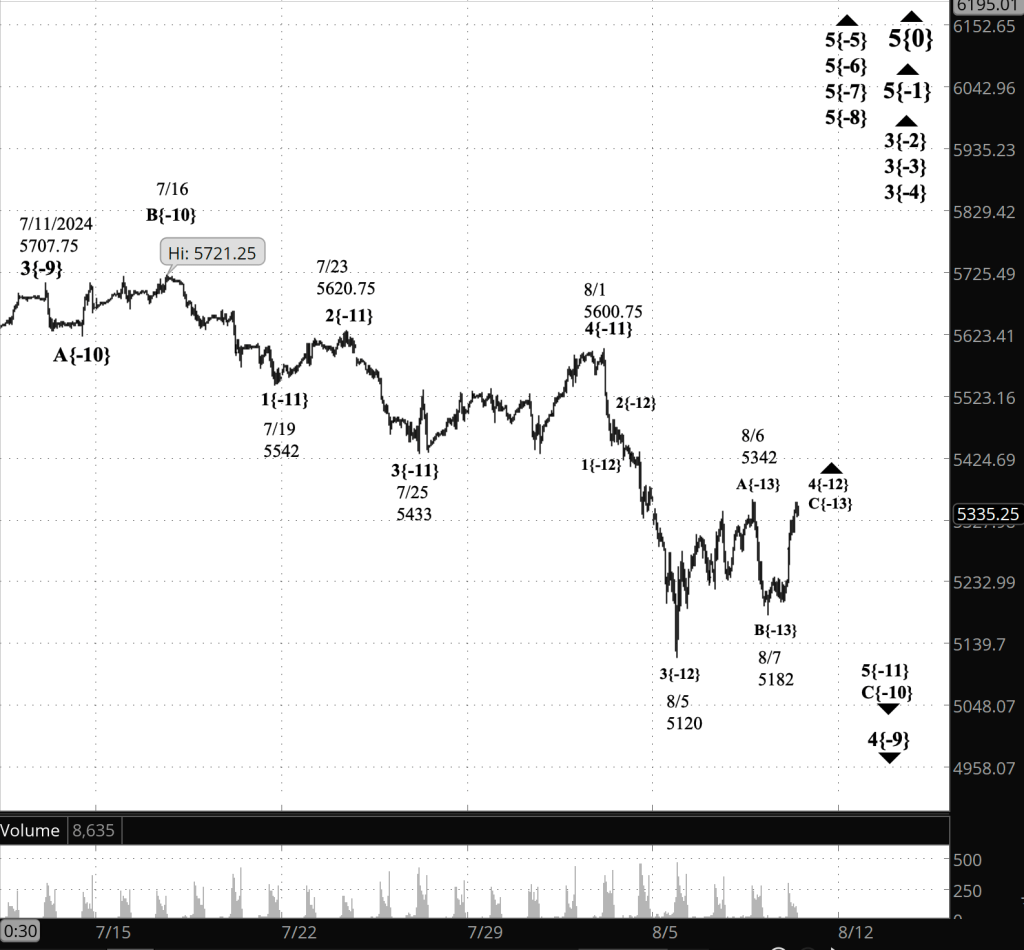
Half an hour before the closing bell. The S&P 500 futures rose during the session, reaching into the 5350s.

Elliott Wave Theory. The rise carried the price above the starting point of wave A, a subwave of the low-degree 4th-wave upward correction that began on August 5.

That’s persuasive enough to trigger this morning’s alternative analysis: Declining wave B within the upward correction ended on August 7 at 5182, and rising wave C is now underway. The C-wave will have five subwaves.

9:35 a.m. New York time

What’s happening now? The S&P 500 E-mini traded in a narrow range overnight, spiking up into the 5270s when the Initial Jobless Claims weekly statistics were published an hour before the opening bell.

What does it mean? The take-away from all the Elliott Wave Theory detail that follows is that the S&P 500 and its related products have been declining in a correction since mid-July. The complex structure of waves it contains show us that the correction, wave 4, is working through its end game and will soon reach its end.

A complex strucuture. The rise took back a portion of what Elliott Wave Theory sees as the second subwave, wave B, within the 4th-wave upward correction that began on August 5. That upward correction is a subwave of the final subwave of a declining 5th wave, which in turn is the final subwave of wave C, the final subwave of a 4th-wave downward correction that began on July 11.

Using the wave labels that appear on the chart, the line up, smaller to larger, is wave B{-13} within wave 4{-12} within wave 5{-11} within wave C{-10}, the final wave of the downward correction, wave 4{-9}

The chart’s waves and labeled by a wave number followed by a subscript in curly brackets showing the distance from the current Intermediate wave, wave 5{0}, which began in December 2018.

And after the correction. The larger 4th-wave downward correction that has defined the markets since mid-July will be followed by an uptrendng wave 5, that if typical will retrace all of decline of wave 4 and will then rise some more. Fifth waves are fickle beasts. This one could truncate, coming up short of the prior wave-4 peak. Or it could extend, moving far higher than expected.

In any case, the end of the uptrending wave 5 will also be the end of a series of nested 5th waves covering four degrees within the fractal structure of the chart. They are waves 5{-8} to wave 5{-5} in the chart’s labeling system.

Enclosing them all is rising wave 3{-4}, which began on February 21 from 4959 and which will also end simultaneously with the smaller waves it contains. A very large 4th-wave downward correction, wave 4{-4}, will follow, taking back a portion of a rise of the last six months.

[S&P 500 E-mini futures at 3:30 p.m., 50-minute bars, with volume]

What are the alternatives? It’s possible that the August 6 session high, labeled wave A{-13} on the chart, is the end of the low 4th-wave upward correction. If so, then the 5th-wave uptrend that follows will likely carry the price back into the 5600s, although it could fall short or it could go much higher.

I’ve rejected this because the rise to August 6 appears to have five subwaves, which is more typical of an A-wave in a Zigzag structure than it is an entire correction. None the less, there are ways to analyze it as a full correction.

Another possibility: Wave B ended on the August 7 session low, and rising wave C is underway, an interpretation that seems out of proprotion to me.

What does Elliott wave theory say? Here are the waves that underly the analyses.

Principal Analysis:

  • Rising wave 5{0} is underway. It is a wave of Intermediate degree that began in December 2018.
  • It is in its final subwave, wave 5{-1}.
  • Within wave 5{-1}, rising waves 3{-2}, 3{-3} and 3{-4} are underway, as is wave 5{-5}.
  • Wave 5{-6} is underway and is in its final subwave, uptrending wave 5{-7}, which in turn is in its final subwave, uptrending wave 5{-8}.
  • Within wave 5{-8}, wave 4{-9}, a downward correction, is in progress.
  • Wave 4{-9} is in its final subwave, wave C{-10}.
  • Wave C{-10} is in its final subwave, wave 5{-11}.
  • Wave 5{-11} is in its next-to-the-last subwave, a rising correction, wave 4{-12}.
  • At the lowest level analyzed, decliinng wave B{-13} is underway.

Alternative Analysis:

  • Wave 5{-11} is in its final subwave, a rising correction, wave 4{-12}.
  • At the lowest level analyzed, rising wave C{-13} is underway.

Reading the chart. Price movements — waves – – in Elliott wave analysis are labeled with numbers within trending waves and letters with corrective waves. The subscripts — numbers in curly brackets — designate the wave’s degree, which, in Elliott wave analysis, means the relative position of a wave within the larger and smaller structures that make up the chart. R.N. Elliott, who in the 1930s developed the form of analysis that bears his name, viewed the chart as a complex structure of smaller waves nested within larger waves, which in turn are nested within still larger waves. In mathematics it’s called a fractal structure, where at every scale the pattern is similar to the others.

Learning and other resources. Elliott wave analysis provides context, not prophecy. As the 20th century semanticist Alfred Korzybski put it in his book Science and Sanity (1933), “The map is not the territory … The only usefulness of a map depends on similarity of structure between the empirical world and the map.” And I would add, in the ever-changing markets, we can judge that similarity of structure only after the fact.

See the menu page Analytical Methods for a rundown on where to go for information on Elliott wave analysis.

By Tim Bovee, Portland, Oregon, August 8, 2024

Disclaimer

Tim Bovee, Private Trader tracks the analysis and trades of a private trader for his own accounts. Nothing in this blog constitutes a recommendation to buy or sell stocks, options or any other financial instrument. The only purpose of this blog is to provide education and entertainment.

No trader is ever 100 percent successful in his or her trades. Trading in the stock and option markets is risky and uncertain. Each trader must make trading decisions for his or her own account, and take responsibility for the consequences.

License
Creative Commons License

All content on Tim Bovee, Private Trader by Timothy K. Bovee is licensed under a Creative Commons Attribution-ShareAlike 4.0 International License.

Based on a work at www.timbovee.com.
Trader’s Notebook

3:30 p.m. New York time

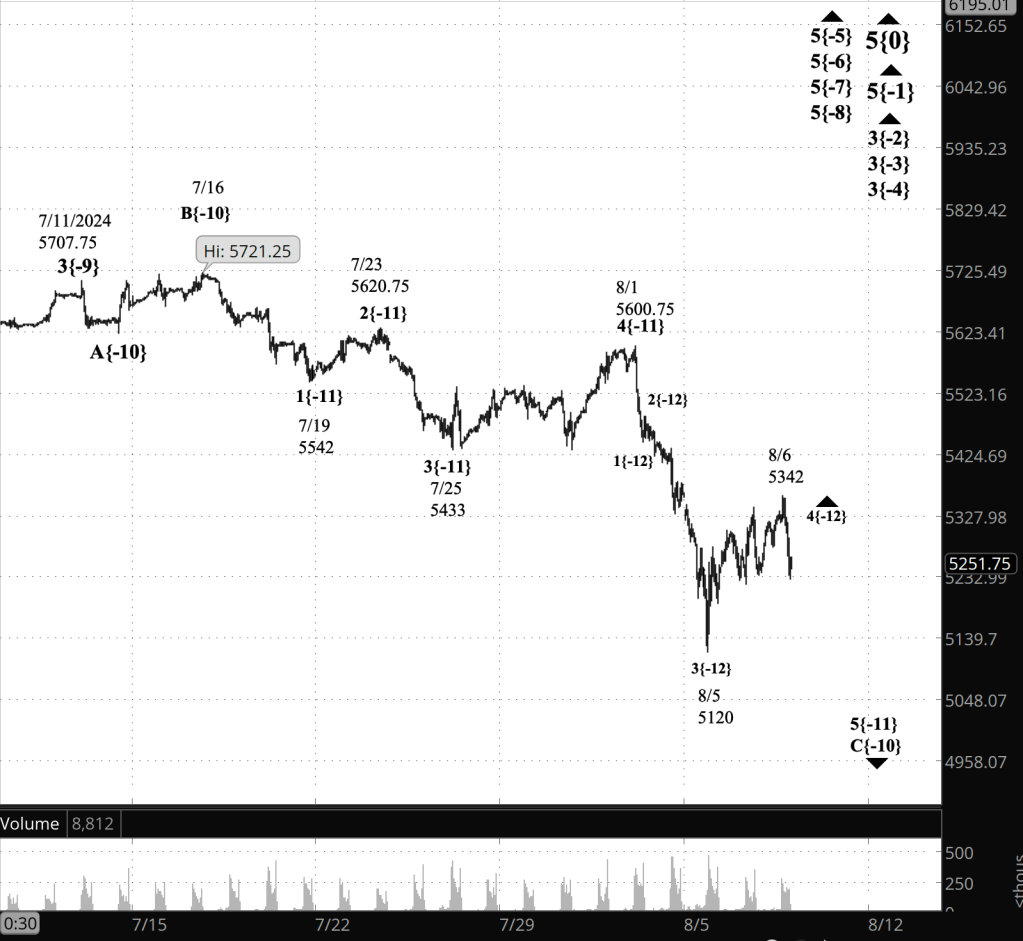
Half an hour before the closing bell.The S&P 500 futures declined during the session, returning to the 5230s. The lower the decline, the greater the support it lends to the alternative analysis, which says that that the low-grade 4th-wave upward correction that began on August 5 ended at the overnight high, 5342, and a downtrending 5th wave has begun.

However, I’m not yet persuaded, and for now I’m leaving the chart as it was, reflecting this morning’s principal analysis, which says that the 4th-wave upward correction continues.

9:35 a.m. New York time

What’s happening now? The S&P 500 E-mini futures rose overnight, reaching into the 5330s. The price approached but remained below the August 6 session high, 5342.

What does it mean? After applying Elliott Wave Theory to the chart, I’ve concluded that the low-degree 4th-wave upward correction that began on August 5 is still underway.

Any move of the price above the August 6 session high creates the possibility that the 4th-wave has ended and an uptrending 5th wave of the same degree has begun. See “What are the alternatives”, below, for more.e

Waves within waves. The correction is part of of the end game of a larger downtrending 5th wave that began on August 1, the final wave of a declining C-wave, which is the final wave of a larger 4th-wave downward correction that began on July 11.

That C wave has carried the price, so far, from the July 16 all time high, 5721.25, down to the August 5 low, 5120.

On a larger scale. The end of the 4th-wave downward correction from July 11 will be followed by a 5th-wave uptrend of roughly similar scale. When that 5th-wave is complete, it will also be the end of a series of four nested 5th waves, each larger than the one before it, and of the still larger 3rd wave that encompasses them, which began on February 21 from 4959

A similarly larger 4th-wave downward correction will then begin and will be on a sale similar to the preceding 3rd wave. Switching to wise-guy talk: If you think Friday’s steep decline was big, you ain’t seen nothing yet. Just wait for this future 4th wave.

[S&P 500 E-mini futures at 3:30 p.m., 50-minute bars, with volume]

What are the alternatives? It’s possible that the August 6 session high is the end of the low 4th-wave correction. If so, then the 5th-wave uptrend that follows will likely carry the price back into the 5600s, although it could fall short or it could go much higher.

What does Elliott wave theory say? Here are the waves that underly the analyses.

Principal Analysis:

  • Rising wave 5{0} is underway. It is a wave of Intermediate degree that began in December 2018.
  • It is in its final subwave, wave 5{-1}.
  • Within wave 5{-1}, rising waves 3{-2}, 3{-3} and 3{-4} are underway, as is wave 5{-5}.
  • Wave 5{-6} is underway and is in its final subwave, uptrending wave 5{-7}, which in turn is in its final subwave, uptrending wave 5{-8}.
  • Within wave 5{-8}, wave 4{-9}, a downward correction, is in progress.
  • Wave 4{-9} is in its final subwave, wave C{-10}.
  • Wave C{-10} is in its final subwave, wave 5{-11}.
  • At the lowest level analyzed, rising wave 4{-12} is underway.

Reading the chart. Price movements — waves – – in Elliott wave analysis are labeled with numbers within trending waves and letters with corrective waves. The subscripts — numbers in curly brackets — designate the wave’s degree, which, in Elliott wave analysis, means the relative position of a wave within the larger and smaller structures that make up the chart. R.N. Elliott, who in the 1930s developed the form of analysis that bears his name, viewed the chart as a complex structure of smaller waves nested within larger waves, which in turn are nested within still larger waves. In mathematics it’s called a fractal structure, where at every scale the pattern is similar to the others.

Learning and other resources. Elliott wave analysis provides context, not prophecy. As the 20th century semanticist Alfred Korzybski put it in his book Science and Sanity (1933), “The map is not the territory … The only usefulness of a map depends on similarity of structure between the empirical world and the map.” And I would add, in the ever-changing markets, we can judge that similarity of structure only after the fact.

See the menu page Analytical Methods for a rundown on where to go for information on Elliott wave analysis.

By Tim Bovee, Portland, Oregon, August 7, 2024

Disclaimer

Tim Bovee, Private Trader tracks the analysis and trades of a private trader for his own accounts. Nothing in this blog constitutes a recommendation to buy or sell stocks, options or any other financial instrument. The only purpose of this blog is to provide education and entertainment.

No trader is ever 100 percent successful in his or her trades. Trading in the stock and option markets is risky and uncertain. Each trader must make trading decisions for his or her own account, and take responsibility for the consequences.

License
Creative Commons License

All content on Tim Bovee, Private Trader by Timothy K. Bovee is licensed under a Creative Commons Attribution-ShareAlike 4.0 International License.

Based on a work at www.timbovee.com.