Trader’s Notebook

3:30 p.m. New York time

Half an hour before the closing bell. The S&P 500 futures have continued to rise during the session, coming close to 5630 before reversing slightly. Elliott Wave Theory: The 5th-wave uptrend that began on July 19 continues and is in its 1st subwave.

I’ve updated the chart.

9:35 a.m. New York time

What’s happening now? The S&P 500 E-mini futures rose overnight, approaching 5620 as the opening bell drew near.

What does it mean? The 5th-wave uptrend that began on July 19 continues and is in its initial subwave, according to Elliott Wave Theory. The trend has progressed sufficiently so that I’m comfortable removing the July 22 alternative analysis, which concluded that the previous 4th is underway. It’s not.

The next milestone ahead for wave 5 is to exceed the price where the prior 3rd wave ended, 5707.75. I’ve marked that level on the chart with a dashed line. Typically, a 5th wave will move beyond the 3rd wave’s endpoint, although not always. A rise above that level suggests that this wave 5 isn’t truncated. Whether it will be extended is still an open question.

The financial press will focus on the moment the price moves above 5721.25, the S&P 500 future’s all-time high. In Elliott Wave Theory, that point is the peak of a subwave of the preceding 4th wave, wave B, and so is of little significance to the journey wave 5. It could end up being a pause, the start of a small correction, perhaps a 4th wave following the trend’s 3rd subwave, but perhaps not.

The present 5th wave is rather small in the general scheme of things, two degrees below the Minuscule degree, the smallest degree in Elliott Wave Theory to have a name. Its end of the 5th wave will trigger the completion of a series of larger waves stretching up five degrees, to Subminuette degree within the fractal structure of the chart and the beginning of a large 4th-wave downward correction, also of Subminuette degree. See the “Looking Ahead” section of yesterday’s Trader’s Notebook for a detailed discussion
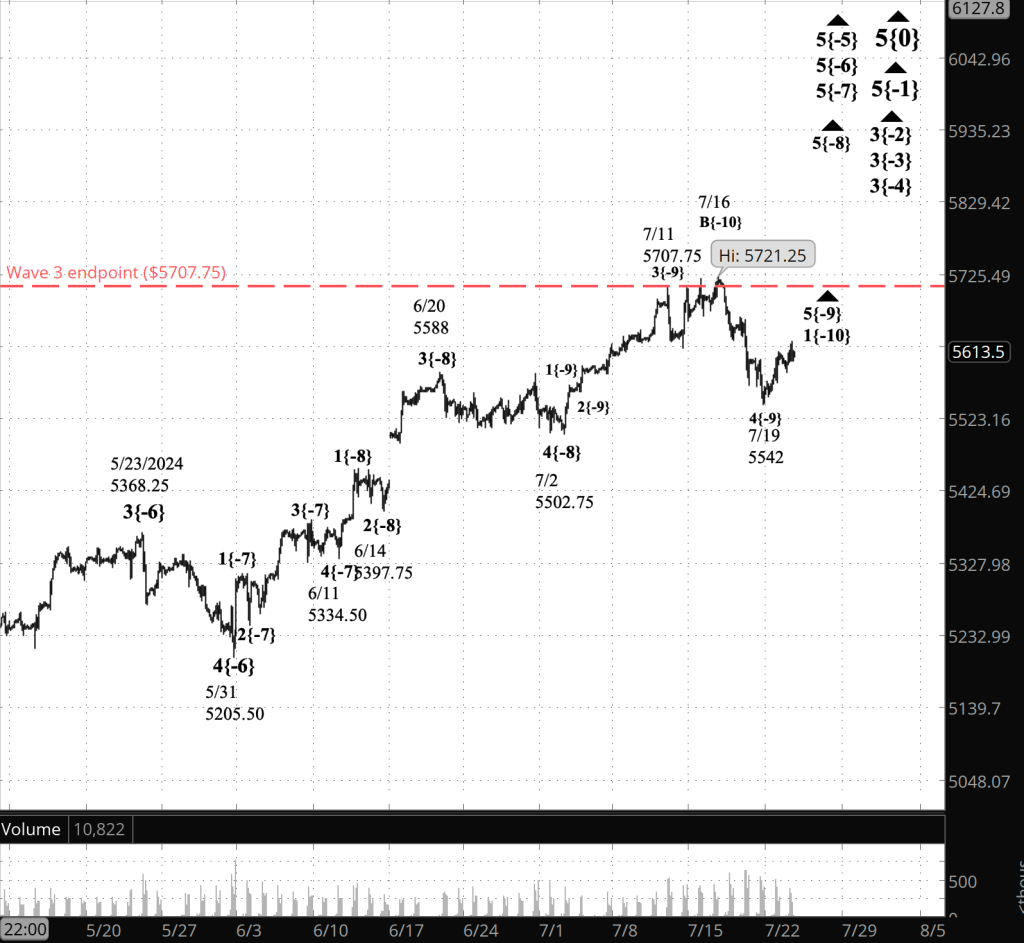
[S&P 500 E-mini futures at 3:35 p.m., 2-hour bars, with volume]

What are the alternatives? None at present. Ambiguities will surely develop, as they always do.

What does Elliott wave theory say? Here are the waves that underly the analyses.

Principal Analysis:

  • Rising wave 5{0} is underway. It is a wave of Intermediate degree that began in December 2018.
  • It is in its final subwave, wave 5{-1}.
  • Within wave 5{-1}, rising waves 3{-2}, 3{-3} and 3{-4} are underway, as is wave 5{-5}.
  • Wave 5{-6} is underway and is in its final subwave, uptrending wave 5{-7}, which in turn is in its final subwave, uptrending wave 5{-8}.
  • Within wave 5{-8}, uptrendng wave 5{-9}, is in progress.
  • Wave 5{-9} is in its initial subwave, wave 1{-10}.

Reading the chart. Price movements — waves – – in Elliott wave analysis are labeled with numbers within trending waves and letters with corrective waves. The subscripts — numbers in curly brackets — designate the wave’s degree, which, in Elliott wave analysis, means the relative position of a wave within the larger and smaller structures that make up the chart. R.N. Elliott, who in the 1930s developed the form of analysis that bears his name, viewed the chart as a complex structure of smaller waves nested within larger waves, which in turn are nested within still larger waves. In mathematics it’s called a fractal structure, where at every scale the pattern is similar to the others.

Learning and other resources. Elliott wave analysis provides context, not prophecy. As the 20th century semanticist Alfred Korzybski put it in his book Science and Sanity (1933), “The map is not the territory … The only usefulness of a map depends on similarity of structure between the empirical world and the map.” And I would add, in the ever-changing markets, we can judge that similarity of structure only after the fact.

See the menu page Analytical Methods for a rundown on where to go for information on Elliott wave analysis.

By Tim Bovee, Portland, Oregon, July 23, 2024

Disclaimer

Tim Bovee, Private Trader tracks the analysis and trades of a private trader for his own accounts. Nothing in this blog constitutes a recommendation to buy or sell stocks, options or any other financial instrument. The only purpose of this blog is to provide education and entertainment.

No trader is ever 100 percent successful in his or her trades. Trading in the stock and option markets is risky and uncertain. Each trader must make trading decisions for his or her own account, and take responsibility for the consequences.

License
Creative Commons License

All content on Tim Bovee, Private Trader by Timothy K. Bovee is licensed under a Creative Commons Attribution-ShareAlike 4.0 International License.

Based on a work at www.timbovee.com.
Trader’s Notebook

3:30 p.m. New York time

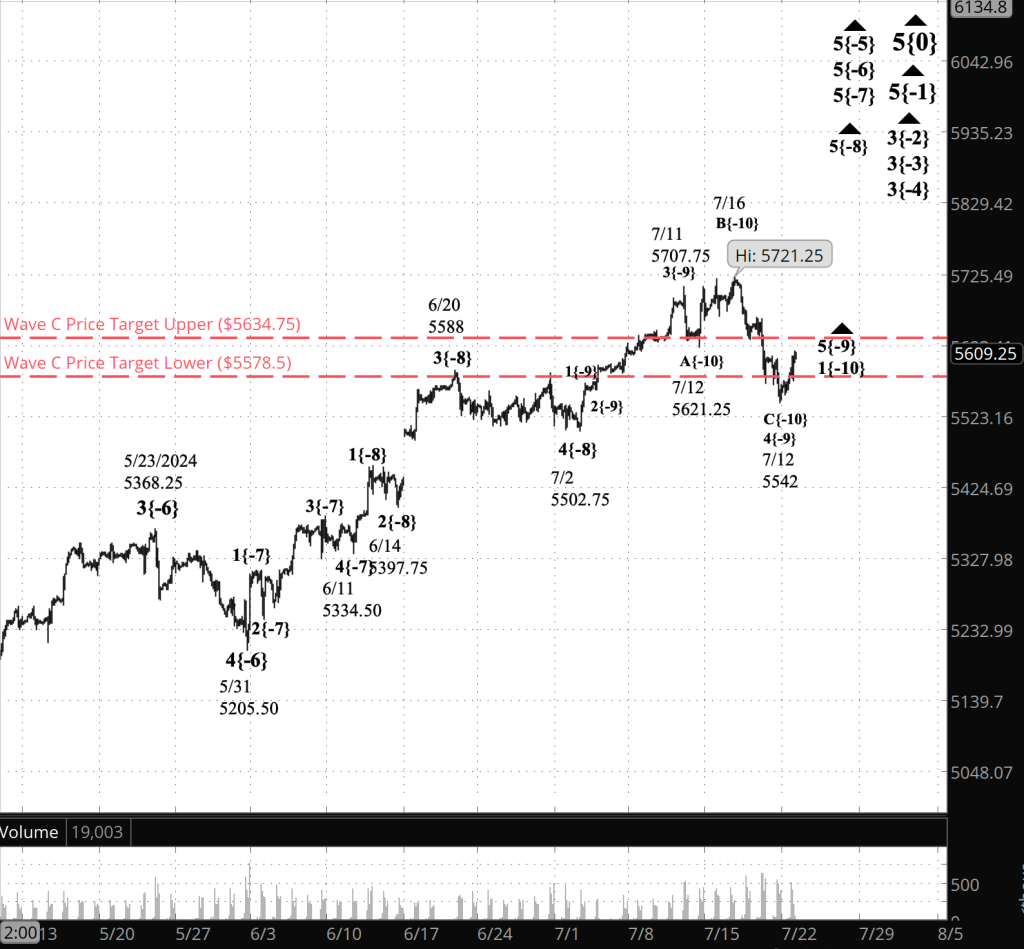
Half an hour before the closing bell. The S&P 500 futures rose during the session into the 5610s. The movement is consistent with this morning’s Elliott Wave Theory principal analysis: The 4th-wave downward correction that began on July 11 ended on July 19 and a the initial subwave of a 5th-wave uptrend has begun.

I’ve updated the chart.

9:35 a.m. New York time

What’s happening now? The S&P 500 E-mini futures rose after trading resumed overnight, from the 5950s into the 5590s.

What does it mean? Seen through the lens of Elliott Wave Theory, the best analysis of the chart, in my opinion, is that the low of July 19 was the end of the 4th-wave downward correction that began on July 11, and the beginning of an uptrendng 5th wave.

Unsurprisingly, there is an alternative analysis, which sees the July 19 low as a smaller subwave within the C wave, the final subwave of the 4th-wave correction. More on that below.

The 5th wave began from 5542, slightly below the price target range of the preceding 4th wave. The rise that began from that point is taking the form of a trend (rather than a correction). The upper and lower boundaries of the price target range are marked on the chart with red dashed lines.

The wave labels on the chart show the wave number and a subscript showing the wave’s distance from the Intermediate degree within the fractal structure of the chart. The 4th wave that ended on July 19 is wave 4{-9} and the 5th wave that followed is wave 5{-9}.

Looking ahead.The present Intermediate-degree wave is wave 5{0}, which began on December 26, 2018, from the 2340s. So the correction just ended and the 5th wave just begun are small movements within a complex, much larger structure of waves within waves.

The main question for traders is how are far will wave 5{-9} travel. Fifth waves usually move beyond the end of the preceding 3rd wave of the same degree. Wave 3{-9} ended at 5707.75 on July 11. That means that if typical, this 5th wave will rise by at least 179.25 points, or 3.2% from its July 19 starting point.

Sometimes 5th wave fall short of that goal, a condition known as “truncation” among Ellioticians. Usually it move farther, and sometimes much farther in a condition known as extension.

Which variety this 5th wave is, only time will tell.

Big picture. This 5th wave is relatively small, but it will have a large impact. This is a scenario that I’ve described several times, and it bear repeating.

The end of the wave 5{-9} will also be the end of four nested 5th waves of increasing degree, wave 5{-8}, 5{-7}, 5{-6} and 5{-5}. They are all subwaves of wave 3{-4}, one degree higher, which will also end along with those 5th waves.

With 3{-4}, a 4th-wave downward correction, wave 4{-4}, will begin. Wave 3{-4} began on February 21 from 4959, and the 4th-wave correction will be of a similar magnitude. It will, for traders unfamiliar with Elliott Wave Theory, be an OMG! moment.

[S&P 500 E-mini futures at 3:30 p.m., 2-hour bars, with volume]

What are the alternatives? If wave C within the 4th-wave correction is not over, then it is in its 4th of five subwaves, giving the downward correction a bit more time to play through its endgame.

What does Elliott wave theory say? Here are the waves that underly the analyses.

Principal Analysis:

  • Rising wave 5{0} is underway. It is a wave of Intermediate degree that began in December 2018.
  • It is in its final subwave, wave 5{-1}.
  • Within wave 5{-1}, rising waves 3{-2}, 3{-3} and 3{-4} are underway, as is wave 5{-5}.
  • Wave 5{-6} is underway and is in its final subwave, uptrending wave 5{-7}, which in turn is in its final subwave, uptrending wave 5{-8}.
  • Within wave 5{-8}, uptrendng wave 5{-9}, is in progress.
  • Wave 5{-9} is in its initial subwave, wave 1{-10}.

Alternative Analysis:

  • Within wave 5{-8}, downward correction wave 4{-9}, is in progress.
  • Wave 4{-9} is in its final subwave, wave C{-10}

.Reading the chart. Price movements — waves – – in Elliott wave analysis are labeled with numbers within trending waves and letters with corrective waves. The subscripts — numbers in curly brackets — designate the wave’s degree, which, in Elliott wave analysis, means the relative position of a wave within the larger and smaller structures that make up the chart. R.N. Elliott, who in the 1930s developed the form of analysis that bears his name, viewed the chart as a complex structure of smaller waves nested within larger waves, which in turn are nested within still larger waves. In mathematics it’s called a fractal structure, where at every scale the pattern is similar to the others.

Learning and other resources. Elliott wave analysis provides context, not prophecy. As the 20th century semanticist Alfred Korzybski put it in his book Science and Sanity (1933), “The map is not the territory … The only usefulness of a map depends on similarity of structure between the empirical world and the map.” And I would add, in the ever-changing markets, we can judge that similarity of structure only after the fact.

See the menu page Analytical Methods for a rundown on where to go for information on Elliott wave analysis.

By Tim Bovee, Portland, Oregon, July 22, 2024

Disclaimer

Tim Bovee, Private Trader tracks the analysis and trades of a private trader for his own accounts. Nothing in this blog constitutes a recommendation to buy or sell stocks, options or any other financial instrument. The only purpose of this blog is to provide education and entertainment.

No trader is ever 100 percent successful in his or her trades. Trading in the stock and option markets is risky and uncertain. Each trader must make trading decisions for his or her own account, and take responsibility for the consequences.

License
Creative Commons License

All content on Tim Bovee, Private Trader by Timothy K. Bovee is licensed under a Creative Commons Attribution-ShareAlike 4.0 International License.

Based on a work at www.timbovee.com.
Trader’s Notebook

3:30 p.m. New York time

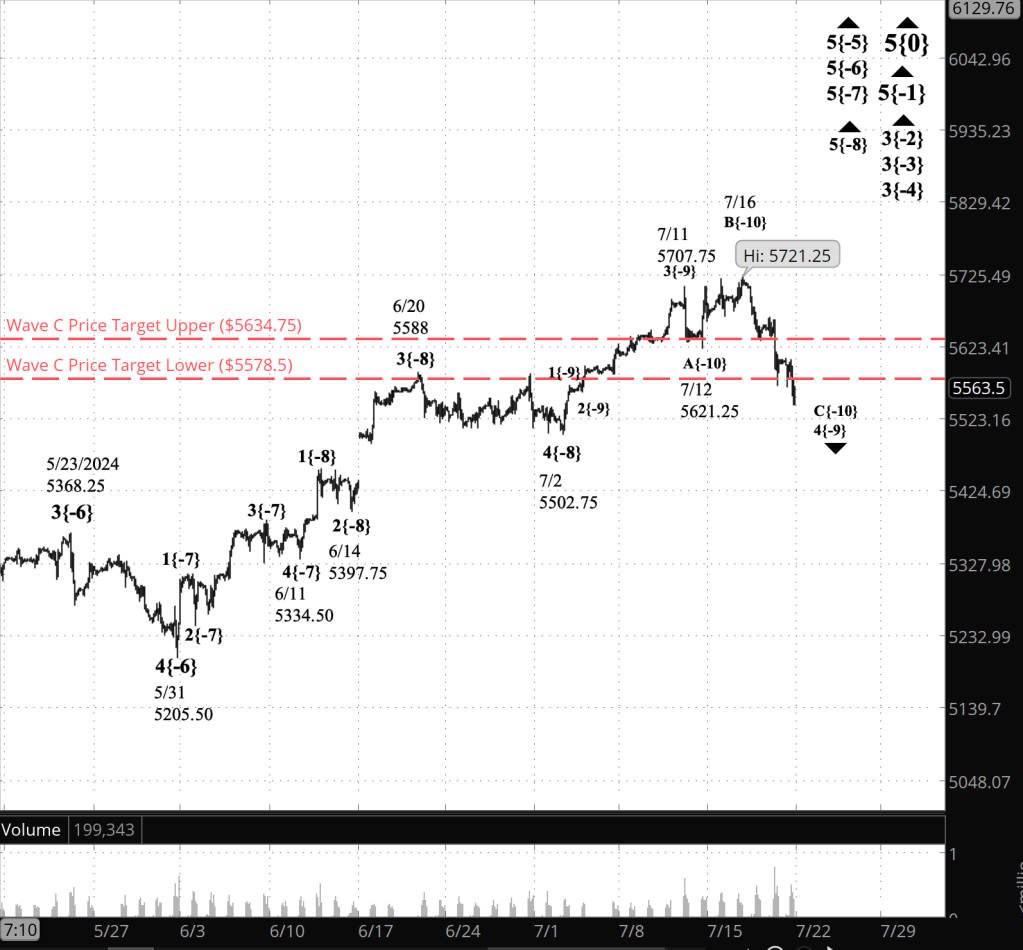
Half an hour before the closing bell. The S&P 500 futures continued to fall during the session, breaking below the lower boundary of the price target range. Elliott Wave Theory: The 4th-wave downward correction that began on July 11 is in its final subwave — wave C.

In his morning’s post I gave two possible interpretations of wave C’s internal structure, saying that the overnight decline was either a subwave within the 3rd subwave of wave C, or is itself wave C’s 4th subwave. The session decline resolves the ambiguity in favor of the 4th subwave within wave C.

I’ve updated the hart.

9:35 a.m. New York time

What’s happening now? The S&P 500 E-mini futures declined overnight, testing the lower boundary of the price target range, and then rose in what ended up being a net sideways movement.

What does it mean? Elliott Wave Theory sees the movement as a very small correction within the final subwave — wave C — of the 4th-wave downward correction that began on July 11. Wave C will have five subwaves. The target range marked on the chart in red are the typical end point of a C wave, although its not a firm rule.

The overnight pause is either a subwave within the 3rd subwave of wave C, or is itself wave C’s 4th subwave. In either case, the correction that began on July 11 is nearing its end.

Long story short. Nothing has changed in the analysis, nor in the scenario for the future. The correction of the past eight days will be followed by a 5th-wave uptrend. The end of this smaller 5th wave will also be the end of a series of four 5th waves of increasing size, and of a still larger 3rd-wave uptrend that began on February 21. That larger 3rd wave will be followed by a 4th-wave downward correction quite a bit larger than the one we’re seeing now.

[S&P 500 E-mini futures at 3:30 p.m., 110-minute bars, with volume]

What are the alternatives? There may be a 1st wave on the chart, between wave 5{-6} and 5{-5}. If that’s the proper count, then it would delay the onset or the 4th-wave downward correction, wave 4{-4}. See the June 18 Trader’s Notebook for a more detailed discussion.

What does Elliott wave theory say? Here are the waves that underly the analyses.

Principal Analysis:

  • Rising wave 5{0} is underway. It is a wave of Intermediate degree that began in December 2018.
  • It is in its final subwave, wave 5{-1}.
  • Within wave 5{-1}, rising waves 3{-2}, 3{-3} and 3{-4} are underway, as is wave 5{-5}.
  • Wave 5{-6} is underway and is in its final subwave, uptrending wave 5{-7}, which in turn is in its final subwave, uptrending wave 5{-8}.
  • Within wave 5{-8}, a downward correction, wave 4{-9}, is in progress.
  • Wave 4{-9} is in its final subwave, wave C{-10}

Reading the chart. Price movements — waves – – in Elliott wave analysis are labeled with numbers within trending waves and letters with corrective waves. The subscripts — numbers in curly brackets — designate the wave’s degree, which, in Elliott wave analysis, means the relative position of a wave within the larger and smaller structures that make up the chart. R.N. Elliott, who in the 1930s developed the form of analysis that bears his name, viewed the chart as a complex structure of smaller waves nested within larger waves, which in turn are nested within still larger waves. In mathematics it’s called a fractal structure, where at every scale the pattern is similar to the others.

Learning and other resources. Elliott wave analysis provides context, not prophecy. As the 20th century semanticist Alfred Korzybski put it in his book Science and Sanity (1933), “The map is not the territory … The only usefulness of a map depends on similarity of structure between the empirical world and the map.” And I would add, in the ever-changing markets, we can judge that similarity of structure only after the fact.

See the menu page Analytical Methods for a rundown on where to go for information on Elliott wave analysis.

By Tim Bovee, Portland, Oregon, July 19, 2024

Disclaimer

Tim Bovee, Private Trader tracks the analysis and trades of a private trader for his own accounts. Nothing in this blog constitutes a recommendation to buy or sell stocks, options or any other financial instrument. The only purpose of this blog is to provide education and entertainment.

No trader is ever 100 percent successful in his or her trades. Trading in the stock and option markets is risky and uncertain. Each trader must make trading decisions for his or her own account, and take responsibility for the consequences.

License
Creative Commons License

All content on Tim Bovee, Private Trader by Timothy K. Bovee is licensed under a Creative Commons Attribution-ShareAlike 4.0 International License.

Based on a work at www.timbovee.com.

Trader’s Notebook

3:30 p.m. New York time

Half an hour before the closing bell. The S&P 500 futures has continued to fall during the session. Elliott Wave Theory: It has dropped below the lower boundary of the price target range. The decline is the final subwave, wave C, of the 4th-wave downward correction that began on July 11.

I’ve updated the chart.

9:35 a.m. New York time

What’s happening now? The S&P 500 E-mini futures traced a sideways path overnight.

What does it mean? The overnight pattern, in Elliott Wave Theory, is the final subwave of a 4th-wave downward correction that began on July 11. The price fluctuated just above upper boundary of the price target for that subwave, wave C, which began on July 16. (See the July 17 Trader’s Notebook for a discussion of how the price target was calculated.) The target has boundaries at 5634.75 and 5578.50, which are marked on the chart in red.

Looking ahead. As noted in earlier analyses, the end of wave C will also be the end of the 4th-wave upward correction and the beginning of a 5th-wave uptrend. These are all small waves. However, the end of that small wave 5 will have large consequences,

The present waves are nested within a series of increasingly larger 5th waves, which will all come to and end the moment the small wave 5 is complete. The still larger 3rd wave that encompasses them all will also end, and a 4th-wave downward correction will begin.

The larger 3rd wave began on February 21 from February 21 from 4959, and a 4th-wave correction retracing a portion of that 3rd wave will be noticeably larger than the small 4th wave that is reaching its end.

[S&P 500 E-mini futures at 3:30 p.m., 100-minute bars, with volume]

What are the alternatives? There may be a 1st wave on the chart, between wave 5{-6} and 5{-5}. If that’s the proper count, then it would delay the onset or the 4th-wave downward correction, wave 4{-4}. See the June 18 Trader’s Notebook for a more detailed discussion. As the uptrend progresses, this alternative is appearing to be less likely.

What does Elliott wave theory say? Here are the waves that underly the analyses.

Principal Analysis:

  • Rising wave 5{0} is underway. It is a wave of Intermediate degree that began in December 2018.
  • It is in its final subwave, wave 5{-1}.
  • Within wave 5{-1}, rising waves 3{-2}, 3{-3} and 3{-4} are underway, as is wave 5{-5}.
  • Wave 5{-6} is underway and is in its final subwave, uptrending wave 5{-7}, which in turn is in its final subwave, uptrending wave 5{-8}.
  • Within wave 5{-8}, a downward correction, wave 4{-9}, is in progress.
  • Wave 4{-9} is in its final subwave, wave C{-10}

Reading the chart. Price movements — waves – – in Elliott wave analysis are labeled with numbers within trending waves and letters with corrective waves. The subscripts — numbers in curly brackets — designate the wave’s degree, which, in Elliott wave analysis, means the relative position of a wave within the larger and smaller structures that make up the chart. R.N. Elliott, who in the 1930s developed the form of analysis that bears his name, viewed the chart as a complex structure of smaller waves nested within larger waves, which in turn are nested within still larger waves. In mathematics it’s called a fractal structure, where at every scale the pattern is similar to the others.

Learning and other resources. Elliott wave analysis provides context, not prophecy. As the 20th century semanticist Alfred Korzybski put it in his book Science and Sanity (1933), “The map is not the territory … The only usefulness of a map depends on similarity of structure between the empirical world and the map.” And I would add, in the ever-changing markets, we can judge that similarity of structure only after the fact.

See the menu page Analytical Methods for a rundown on where to go for information on Elliott wave analysis.

By Tim Bovee, Portland, Oregon, July 18, 2024

Disclaimer

Tim Bovee, Private Trader tracks the analysis and trades of a private trader for his own accounts. Nothing in this blog constitutes a recommendation to buy or sell stocks, options or any other financial instrument. The only purpose of this blog is to provide education and entertainment.

No trader is ever 100 percent successful in his or her trades. Trading in the stock and option markets is risky and uncertain. Each trader must make trading decisions for his or her own account, and take responsibility for the consequences.

License
Creative Commons License

All content on Tim Bovee, Private Trader by Timothy K. Bovee is licensed under a Creative Commons Attribution-ShareAlike 4.0 International License.

Based on a work at www.timbovee.com.

Trader’s Notebook

3:30 p.m. New York time

Half an hour before the closing bell. The S&P 500 futures fell further during the session, into the 5630s.

The decline reinforces this morning’s Elliott Wave Theory analysis the sees the the 4th-wave downward correction that began on July 11 as being in its final subwave, wave C. The decline has carried the price below the upper boundary, 5634.75, of the price target. See this morning’s analysis below.

I’ve updated the chart.

9:35 a.m. New York time

What’s happening now? The S&P 500 E-mini futures reached a new peak, 5721.25, minutes before the closing bell on Tuesday, and then began to decline, reaching into the 5650s as today’s opening bell sounded.

What does it mean? The 4th-wave downward correction that began on July 11 continues. My Elliott Wave Theory analyses over the last few days have repeatedly moved the end of the middle subwave — wave B — as each new peak developed. The move to the Tuesday’s peak, late in the session, has been followed by a an energetic decline, suggesting that this time the final subwave — wave C — really has begun.

Price target. As noted in yesterday’s analysis, the 4th-wave correction is taking the Flat form, and the C-wave within a Flat typically retraces from the length of the preceding A wave to 165% of that length. It’s a tendency not a firm rule.

Under that tendency, wave C will be somewhere between 86.50 points and 142.75 points in length. The target range, based on wave C’s higher starting point, will typically range from 5634.75 and 5578.50. The range boundaries have been rounded to conform the the futures’ 25-cent increment in price changes.

Looking forward. The C wave, when complete, will be the end of the 4th-wave correction and the start of a 5th-wave uptrend. Fifth waves tend to have a lot of variety, sometimes fallling short of the peak of the preceding 3rd wave — 5707.75 in this case — and sometimes extending well beyond that level.

The end of the 5th-wave uptrend will cascade up the fractal structure of the chart, also marking the end of a series of 5th wave of increasing size overing four degrees, and also the end of a still larger 3rd-wave uptrend that began on February 21. A large 4th-wave downward correction will follow.

[S&P 500 E-mini futures at 3:30 p.m., 100-minute bars, with volume]

What are the alternatives? There may be a 1st wave on the chart, between wave 5{-6} and 5{-5}. If that’s the proper count, then it would delay the onset or the 4th-wave downward correction, wave 4{-4}. See the June 18 Trader’s Notebook for a more detailed discussion. As the uptrend progresses, this alternative is appearing to be less likely.

What does Elliott wave theory say? Here are the waves that underly the analyses.

Principal Analysis:

  • Rising wave 5{0} is underway. It is a wave of Intermediate degree that began in December 2018.
  • It is in its final subwave, wave 5{-1}.
  • Within wave 5{-1}, rising waves 3{-2}, 3{-3} and 3{-4} are underway, as is wave 5{-5}.
  • Wave 5{-6} is underway and is in its final subwave, uptrending wave 5{-7}, which in turn is in its final subwave, uptrending wave 5{-8}.
  • Within wave 5{-8}, a downward correction, wave 4{-9}, is in progress.
  • Wave 4{-9} is in its final subwave, wave C{-10}

Reading the chart. Price movements — waves – – in Elliott wave analysis are labeled with numbers within trending waves and letters with corrective waves. The subscripts — numbers in curly brackets — designate the wave’s degree, which, in Elliott wave analysis, means the relative position of a wave within the larger and smaller structures that make up the chart. R.N. Elliott, who in the 1930s developed the form of analysis that bears his name, viewed the chart as a complex structure of smaller waves nested within larger waves, which in turn are nested within still larger waves. In mathematics it’s called a fractal structure, where at every scale the pattern is similar to the others.

Learning and other resources. Elliott wave analysis provides context, not prophecy. As the 20th century semanticist Alfred Korzybski put it in his book Science and Sanity (1933), “The map is not the territory … The only usefulness of a map depends on similarity of structure between the empirical world and the map.” And I would add, in the ever-changing markets, we can judge that similarity of structure only after the fact.

See the menu page Analytical Methods for a rundown on where to go for information on Elliott wave analysis.

By Tim Bovee, Portland, Oregon, July 17, 2024

Disclaimer

Tim Bovee, Private Trader tracks the analysis and trades of a private trader for his own accounts. Nothing in this blog constitutes a recommendation to buy or sell stocks, options or any other financial instrument. The only purpose of this blog is to provide education and entertainment.

No trader is ever 100 percent successful in his or her trades. Trading in the stock and option markets is risky and uncertain. Each trader must make trading decisions for his or her own account, and take responsibility for the consequences.

License
Creative Commons License

All content on Tim Bovee, Private Trader by Timothy K. Bovee is licensed under a Creative Commons Attribution-ShareAlike 4.0 International License.

Based on a work at www.timbovee.com.
Trader’s Notebook

3:30 p.m. New York time

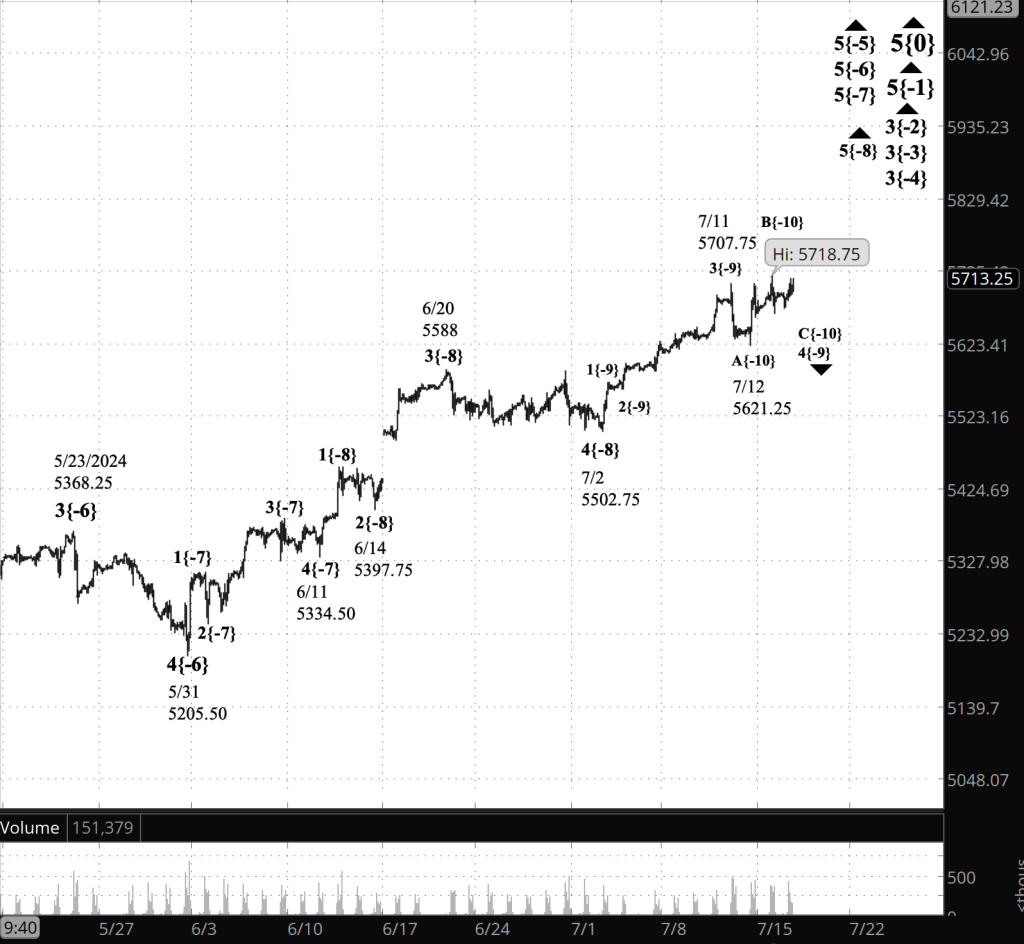
Half an hour before the closing bell. The S&P 500 futures climbed back into the 5710s during the session, so far remaining below the overnight high by a few points.

This morning’s Elliott Wave Theory analysis is unchanged: Wave C within the 4th-wave upward correction that began on July 11 continues.

I’ve updated the chart.

9:35 a.m. New York time

What’s happening now? The S&P 500 E-mini futures traded in a narrow range overnight, remaining in the 5690s except for a decline into the 5670s and then back.

What does it mean? Elliott Wave Theory sees the pause as part of the third subwave — wave C — within the 4th-wave downward correction that began on July 11. The correction is taking the form of a Flat, with waves A and B having three subwaves and wave C, five subwaves.

A C wave within a Flat typically is equal to the length of wave A or up to 65% longer. The A wave in this correction covered 86.5 points. Multiplying by 1.65 gives a length of 142.73.

Wave C began from 5718.75. That gives a range for wave C of between 5632.25 and 5576 (rounding the results to the 25-cent increments used by the S&P 500 futures), which at its longest would bring the price down to where it was in early July.

As I’ve noted in earlier posts, this is a small correction. However, there is a much larger correction in view.

The present 4th-wave corection will be followed by a small 5th-wave uptrend, whose end will also be the end of four 5th waves of increasing size, and of a still larger 3rd wave. that began on February 21. A 4th-wave downward correction of the larger 3rd wave will begin. That 4th-wave correction will be five degrees (or levels) larger than the present 4th-wave correction within the fractal structure of the chart.

[S&P 500 E-mini futures at 3:30 p.m., 100-minute bars, with volume]

What are the alternatives? Unchanged for the past few weeks. There may be a 1st wave on the chart, between wave 5{-6} and 5{-5}. If that’s the proper count, then it would delay the onset or the 4th-wave downward correction, wave 4{-4}. See the June 18 Trader’s Notebook for a more detailed discussion. As the uptrend progresses, this alternative is appearing to be less likely.

What does Elliott wave theory say? Here are the waves that underly the analyses.

Principal Analysis:

  • Rising wave 5{0} is underway. It is a wave of Intermediate degree that began in December 2018.
  • It is in its final subwave, wave 5{-1}.
  • Within wave 5{-1}, rising waves 3{-2}, 3{-3} and 3{-4} are underway, as is wave 5{-5}.
  • Wave 5{-6} is underway and is in its final subwave, uptrending wave 5{-7}, which in turn is in its final subwave, uptrending wave 5{-8}.
  • Within wave 5{-8}, a downward correction, wave 4{-9}, is in progress.
  • Wave 4{-9} is in its final subwave, wave C{-10}

Reading the chart. Price movements — waves – – in Elliott wave analysis are labeled with numbers within trending waves and letters with corrective waves. The subscripts — numbers in curly brackets — designate the wave’s degree, which, in Elliott wave analysis, means the relative position of a wave within the larger and smaller structures that make up the chart. R.N. Elliott, who in the 1930s developed the form of analysis that bears his name, viewed the chart as a complex structure of smaller waves nested within larger waves, which in turn are nested within still larger waves. In mathematics it’s called a fractal structure, where at every scale the pattern is similar to the others.

Learning and other resources. Elliott wave analysis provides context, not prophecy. As the 20th century semanticist Alfred Korzybski put it in his book Science and Sanity (1933), “The map is not the territory … The only usefulness of a map depends on similarity of structure between the empirical world and the map.” And I would add, in the ever-changing markets, we can judge that similarity of structure only after the fact.

See the menu page Analytical Methods for a rundown on where to go for information on Elliott wave analysis.

By Tim Bovee, Portland, Oregon, July 16, 2024

Disclaimer

Tim Bovee, Private Trader tracks the analysis and trades of a private trader for his own accounts. Nothing in this blog constitutes a recommendation to buy or sell stocks, options or any other financial instrument. The only purpose of this blog is to provide education and entertainment.

No trader is ever 100 percent successful in his or her trades. Trading in the stock and option markets is risky and uncertain. Each trader must make trading decisions for his or her own account, and take responsibility for the consequences.

License
Creative Commons License

All content on Tim Bovee, Private Trader by Timothy K. Bovee is licensed under a Creative Commons Attribution-ShareAlike 4.0 International License.

Based on a work at www.timbovee.com.
Trader’s Notebook

3:30 p.m. New York time

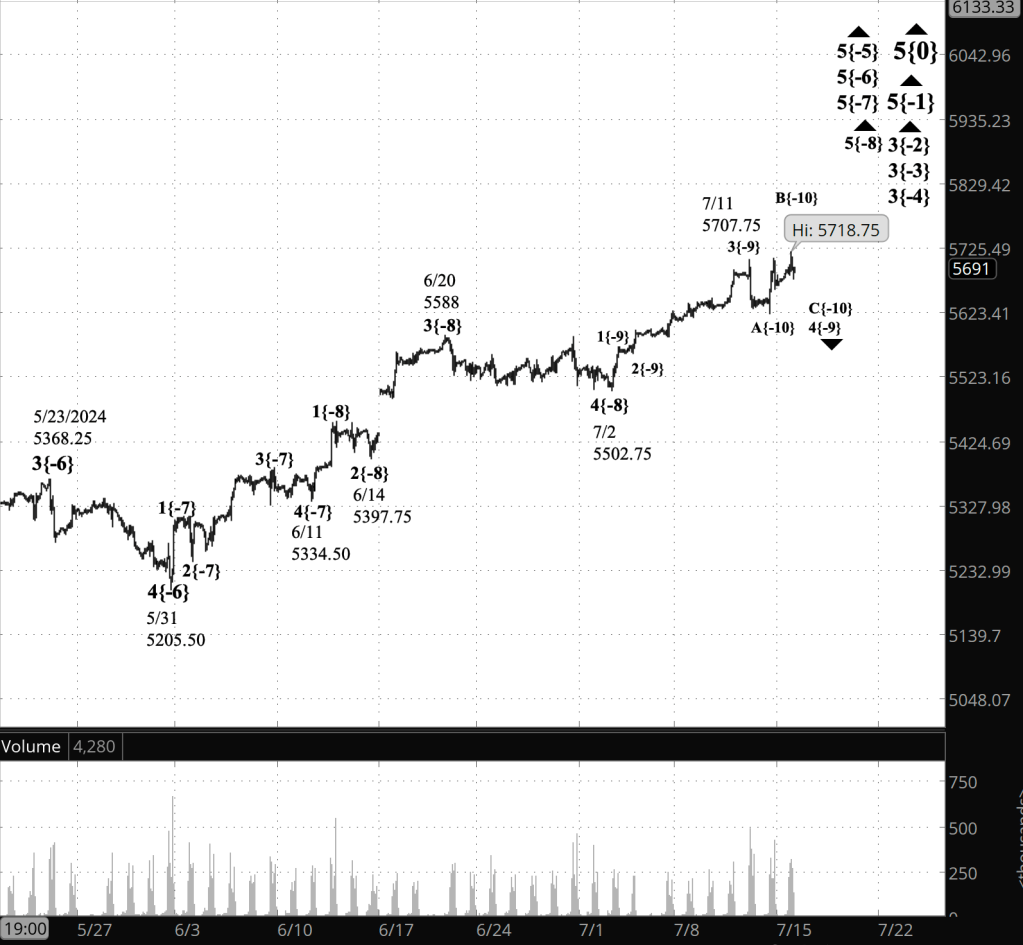
Half an hour before the closing bell. The S&P 500 futures has risen above the overnight high during the session, into the 5710s. Elliott Wave Theory: Within the 4th-wave downward correction that began on July 11, I’ve moved the end point of the rising B wave — the middle subwave — to the session high, and consider the falling C wave — the final subwave — to have begun from that point. Otherwise, the morning analysis is unchanged.

I’ve updated the chart.

9:35 a.m. New York time

What’s happening now? The S&P 500 E-mini futures rose overnight into the 5690s and then pulled back slightly.

What does it mean? The small downward correction that began on July 11 is now in its final subwave, according to Elliott Wave Theory analysis. The correction will be followed by a small 5th-wave uptrend that, if typical, will take a week or so to reach completion.

At that point, things get interesting. When the small 5th-wave uptrend reaches its endpoint, it will also be the end of a series of 5th waves of increasing degree within the fractal structure of the chart, up to a 5th wave four degrees higher. Up one more degree, and a 3rd wave that began in February will also reach its end, and a declining 4th-wave correction, far larger than the one now underway, will begin.

[S&P 500 E-mini futures at 3:30 p.m., 90-minute bars, with volume]

What are the alternatives? Unchanged for the past few weeks. There may be a 1st wave on the chart, between wave 5{-6} and 5{-5}. If that’s the proper count, then it would delay the onset or the 4th-wave downward correction, wave 4{-4}. See the June 18 Trader’s Notebook for a more detailed discussion. As the uptrend progresses, this alternative is appearing to be less likely.

What does Elliott wave theory say? Here are the waves that underly the analyses.

Principal Analysis:

  • Rising wave 5{0} is underway. It is a wave of Intermediate degree that began in December 2018.
  • It is in its final subwave, wave 5{-1}.
  • Within wave 5{-1}, rising waves 3{-2}, 3{-3} and 3{-4} are underway, as is wave 5{-5}.
  • Wave 5{-6} is underway and is in its final subwave, uptrending wave 5{-7}, which in turn is in its final subwave, uptrending wave 5{-8}.
  • Within wave 5{-8}, a downward correction, wave 4{-9}, is in progress.
  • Wave 4{-9} is in its final subwave, wave C{-10}

Reading the chart. Price movements — waves – – in Elliott wave analysis are labeled with numbers within trending waves and letters with corrective waves. The subscripts — numbers in curly brackets — designate the wave’s degree, which, in Elliott wave analysis, means the relative position of a wave within the larger and smaller structures that make up the chart. R.N. Elliott, who in the 1930s developed the form of analysis that bears his name, viewed the chart as a complex structure of smaller waves nested within larger waves, which in turn are nested within still larger waves. In mathematics it’s called a fractal structure, where at every scale the pattern is similar to the others.

Learning and other resources. Elliott wave analysis provides context, not prophecy. As the 20th century semanticist Alfred Korzybski put it in his book Science and Sanity (1933), “The map is not the territory … The only usefulness of a map depends on similarity of structure between the empirical world and the map.” And I would add, in the ever-changing markets, we can judge that similarity of structure only after the fact.

See the menu page Analytical Methods for a rundown on where to go for information on Elliott wave analysis.

By Tim Bovee, Portland, Oregon, July 15, 2024

Disclaimer

Tim Bovee, Private Trader tracks the analysis and trades of a private trader for his own accounts. Nothing in this blog constitutes a recommendation to buy or sell stocks, options or any other financial instrument. The only purpose of this blog is to provide education and entertainment.

No trader is ever 100 percent successful in his or her trades. Trading in the stock and option markets is risky and uncertain. Each trader must make trading decisions for his or her own account, and take responsibility for the consequences.

License
Creative Commons License

All content on Tim Bovee, Private Trader by Timothy K. Bovee is licensed under a Creative Commons Attribution-ShareAlike 4.0 International License.

Based on a work at www.timbovee.com.
Trader’s Notebook

3:30 p.m. New York time

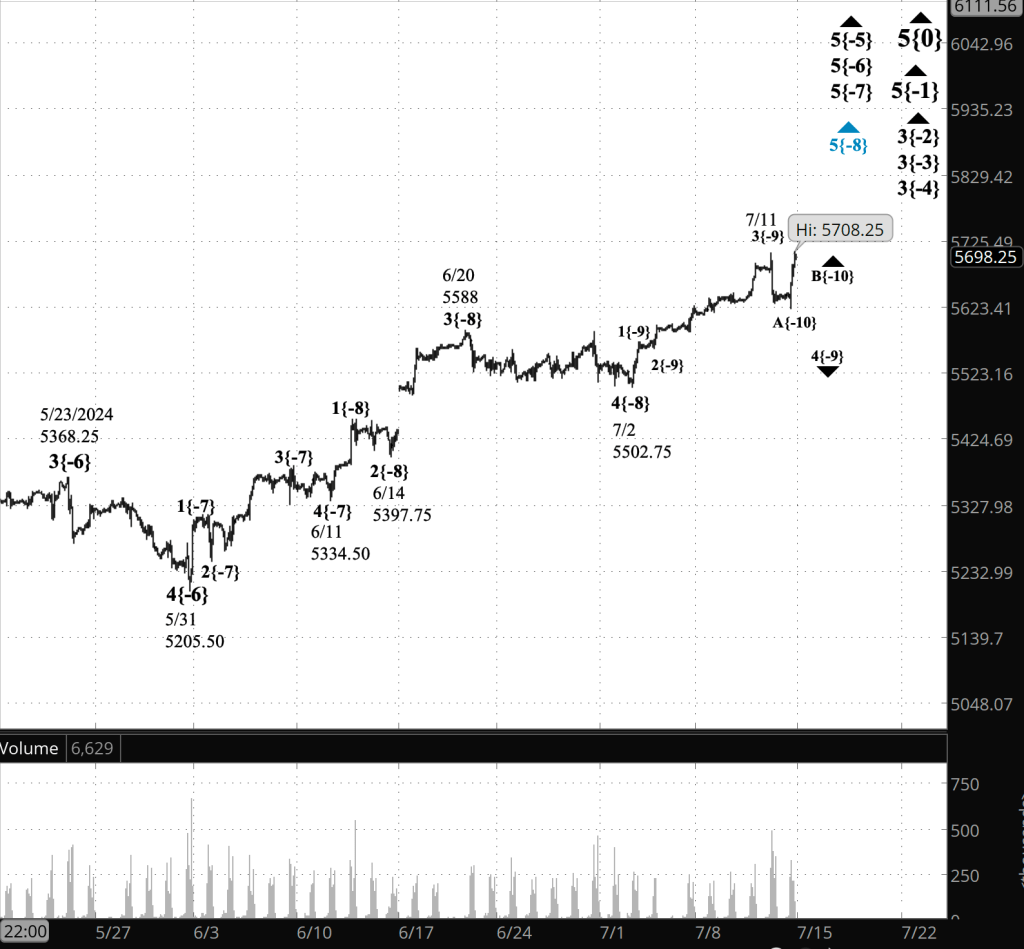
Half an hour before the closing bell. The S&P 500 futures continued to rise during the session, reaching above 5700. The chart has the look-and-feel, to me, at least, of another head-fake in the making, a repeat of yesterday’s need to correct the morning analysis.

For this afternoon’s Elliott Wave Theory analysis, I’ve retained labeling that has a 4th-wave downward correction that began on July 11 in progress. It’s a subwave of a larger 5th-wave uptrend that began on July 2.

Fourth waves have three subwaves within the initial wave, and I’ve labeled that subwave, wave A, as having ended at the overnight low. With that labeling, wave A has three subwaves, meaning that the correction is taking the form of a Flat.

The rise that followed is the B wave, the second subwave within the correction. In the Flat form, a B wave can move above the start of the preceding A wave, and that is what has happened. The B wave will have three subwaves. If this count turns out to match the future course of the chart, then the rising B wave will followed by a declining C wave with five subwaves that will complete the 4th-wave correction.

Now to the potential head-fake: It’s possible to count the wave A decline, as discussed above, as being the entire 4th-wave correction, with three subwaves and a lack of clarity within those subwaves. That lack of clarity has led me to demote this second analysis to an Alternative status. Under this scenario, today’s rise during the session is a 5th-wave uptrend, the final subwave of the larger 5th wave that began on July 2.

And now we wait for the unfolding reality of the chart to grade our work.

I’ve updated the chart.

9:35 a.m. New York time

What’s happening now? The S&P 500 E-mini futures traded sideways overnight, dropping by 18 points when new Producer Price Index data was released. The price returned to its prior level in the next minute.

What does it mean? Analysis based on Elliott Wave Theory concludes that a low-degree 4th-wave downward correction that began on July 11 continues. when it is complete, a 5th-wave uptrend will following, bringing the parent wave — also a 5th-wave uptrend — to a conclusion.

A series of three nested 5th wave, each a degree higher than the one before, will simultaneously com to an end. The entire structure is within a 3rd wave uptrend that began on February 21. When those 5th waves end, the larger 3rd wave will also end and a large 4th-wave downtrend will begin.

[S&P 500 E-mini futures at 3:30 p.m., 90-minute bars, with volume]

What are the alternatives? There may be a 1st wave on the chart, between wave 5{-6} and 5{-5}. If that’s the proper count, then it would delay the onset or the 4th-wave downward correction, wave 4{-4}. See the June 18 Trader’s Notebook for a more detailed discussion. As the uptrend progresses, this alternative is appearing to be less likely.

What does Elliott wave theory say? Here are the waves that underly the analyses.

Principal Analysis:

  • Rising wave 5{0} is underway. It is a wave of Intermediate degree that began in December 2018.
  • It is in its final subwave, wave 5{-1}.
  • Within wave 5{-1}, rising waves 3{-2}, 3{-3} and 3{-4} are underway, as is wave 5{-5}.
  • Wave 5{-6} is underway and is in its final subwave, uptrending wave 5{-7}, which in turn is in its final subwave, uptrending wave 5{-8}.
  • Within wave 5{-8}, a downward correction, wave 4{-9}, is in progress.

Reading the chart. Price movements — waves – – in Elliott wave analysis are labeled with numbers within trending waves and letters with corrective waves. The subscripts — numbers in curly brackets — designate the wave’s degree, which, in Elliott wave analysis, means the relative position of a wave within the larger and smaller structures that make up the chart. R.N. Elliott, who in the 1930s developed the form of analysis that bears his name, viewed the chart as a complex structure of smaller waves nested within larger waves, which in turn are nested within still larger waves. In mathematics it’s called a fractal structure, where at every scale the pattern is similar to the others.

Learning and other resources. Elliott wave analysis provides context, not prophecy. As the 20th century semanticist Alfred Korzybski put it in his book Science and Sanity (1933), “The map is not the territory … The only usefulness of a map depends on similarity of structure between the empirical world and the map.” And I would add, in the ever-changing markets, we can judge that similarity of structure only after the fact.

See the menu page Analytical Methods for a rundown on where to go for information on Elliott wave analysis.

By Tim Bovee, Portland, Oregon, July 12, 2024

Disclaimer

Tim Bovee, Private Trader tracks the analysis and trades of a private trader for his own accounts. Nothing in this blog constitutes a recommendation to buy or sell stocks, options or any other financial instrument. The only purpose of this blog is to provide education and entertainment.

No trader is ever 100 percent successful in his or her trades. Trading in the stock and option markets is risky and uncertain. Each trader must make trading decisions for his or her own account, and take responsibility for the consequences.

License
Creative Commons License

All content on Tim Bovee, Private Trader by Timothy K. Bovee is licensed under a Creative Commons Attribution-ShareAlike 4.0 International License.

Based on a work at www.timbovee.com.

Trader’s Notebook

3:30 p.m. New York time

Half an hour before the closing bell. The S&P 500 futures fell during the session, reaching 5630. The decline adds sufficient doubt of the accuracy of this morning’s analysis that I’ve made some revisions to the subwaves within the 5th-wave uptrend that began on July 2, as follows:

  • The end of the 3rd subwave, and uptrend, moves to the overnight peak, 5707.75.
  • The decline that followed is the 4th subwave, a downward correction.

Under this scenario, the small 4th-wave correction will be followed by a 5th wave uptrend. The 4th-wave correction is labelled wave 4{-9} on the chart, and the wave that follows will be wave 5{-9}. At this low level within the fractal structure of the chart we’re tracking wave movements that last days, maybe a week, so it shouldn’t take long.

I’ve updated the chart.

9:35 a.m. New York time

What’s happening now? The S&P 500 E-mini futures rose sharply an hour before the opening bell after the release of the Consumer Price Index, the most extensive measure of inflation in the United States. The price leapt within a minute from 5681.27 to 5707.25 and then fell back, almost returning to the starting point.

What does it mean? [The following analysis has been superseded by the afternoon analysis, above.] In Elliott Wave Theory analysis, the rapid rise marks the beginning of the final subwave within an uptrending 5th wave that began on July 2.

The 5th wave that began overnight is labeled wave 5{-9} on the chart, the subscript in curly brackets referrng to the wave’s distance from the Intermediate degree within the fractal structure of the chart. The present wave of Intermediate degree is wave 5{0}, which began in December 2018. Wave 5{-9} is nine degrees lower in the fractal structure.

The larger 5th wave, which began on July 2, is labeled wave 5{-8}. When it is complete, it will also mark the end of three 5th waves of increasingly larger size, waves 5{-7}, 5{-6} and 5{-5}. All of these waves are subwaves of a larger 3rd wave, wave 3{-4}, which began on February 21. The simultaneous completion of 5th waves covering five degrees will also be the end of wave 3{-4}, and the beginning of a downward correction, wave 4{-4}, which will be far more impressive than any correction we’ve seen since winter.

[S&P 500 E-mini futures at 3:30 p.m., 90-minute bars, with volume]

What are the alternatives? There are two, one concerning the near-term chart and a second concerning the larger movements.

Alternative #1 [Superseded by the afternoon analysis, above.-

Wave 5{-8} is in its initial subwave, and the decline from the peak is a 2nd-wave correction. One firm rule of Elliott Wave Theory is that a 2nd wave can’t move beyond the start of the preceding 1st wave; in this case, the price before the one-minute rise overnight to a new high. If the price falls below 4677.25, then my analysis above is incorrect — the middle subwave, wave 3{-9} within wave 5{-8} is still underway.

Alternative #2

Another alternative: There may be a 1st wave on the chart, between wave 5{-6} and 5{-5}. If that’s the proper count, then it would delay the onset or the 4th-wave downward correction, wave 4{-4}. See the June 18 Trader’s Notebook for a more detailed discussion. As the uptrend progresses, this alternative is appearing to be less likely.

What does Elliott wave theory say? Here are the waves that underly the analyses.

Principal Analysis:

  • Rising wave 5{0} is underway. It is a wave of Intermediate degree that began in December 2018.
  • It is in its final subwave, wave 5{-1}.
  • Within wave 5{-1}, rising waves 3{-2}, 3{-3} and 3{-4} are underway, as is wave 5{-5}.
  • Wave 5{-6} is underway and is in its final subwave, uptrending wave 5{-7}, which in turn is in its final subwave, uptrending wave 5{-8}.
  • Within wave 5{-8}, an uptrending subwave, wave 5{-9}, is in progress.

Alternative #1 Analysis [Superseded by the afternoon analysis, above]

  • Within wave 5{-8}, an uptrending subwave, wave 3{-9}, is in progress.

Reading the chart. Price movements — waves – – in Elliott wave analysis are labeled with numbers within trending waves and letters with corrective waves. The subscripts — numbers in curly brackets — designate the wave’s degree, which, in Elliott wave analysis, means the relative position of a wave within the larger and smaller structures that make up the chart. R.N. Elliott, who in the 1930s developed the form of analysis that bears his name, viewed the chart as a complex structure of smaller waves nested within larger waves, which in turn are nested within still larger waves. In mathematics it’s called a fractal structure, where at every scale the pattern is similar to the others.

Learning and other resources. Elliott wave analysis provides context, not prophecy. As the 20th century semanticist Alfred Korzybski put it in his book Science and Sanity (1933), “The map is not the territory … The only usefulness of a map depends on similarity of structure between the empirical world and the map.” And I would add, in the ever-changing markets, we can judge that similarity of structure only after the fact.

See the menu page Analytical Methods for a rundown on where to go for information on Elliott wave analysis.

By Tim Bovee, Portland, Oregon, July 11, 2024

Disclaimer

Tim Bovee, Private Trader tracks the analysis and trades of a private trader for his own accounts. Nothing in this blog constitutes a recommendation to buy or sell stocks, options or any other financial instrument. The only purpose of this blog is to provide education and entertainment.

No trader is ever 100 percent successful in his or her trades. Trading in the stock and option markets is risky and uncertain. Each trader must make trading decisions for his or her own account, and take responsibility for the consequences.

License
Creative Commons License

All content on Tim Bovee, Private Trader by Timothy K. Bovee is licensed under a Creative Commons Attribution-ShareAlike 4.0 International License.

Based on a work at www.timbovee.com.
Trader’s Notebook

3:30 p.m. New York time

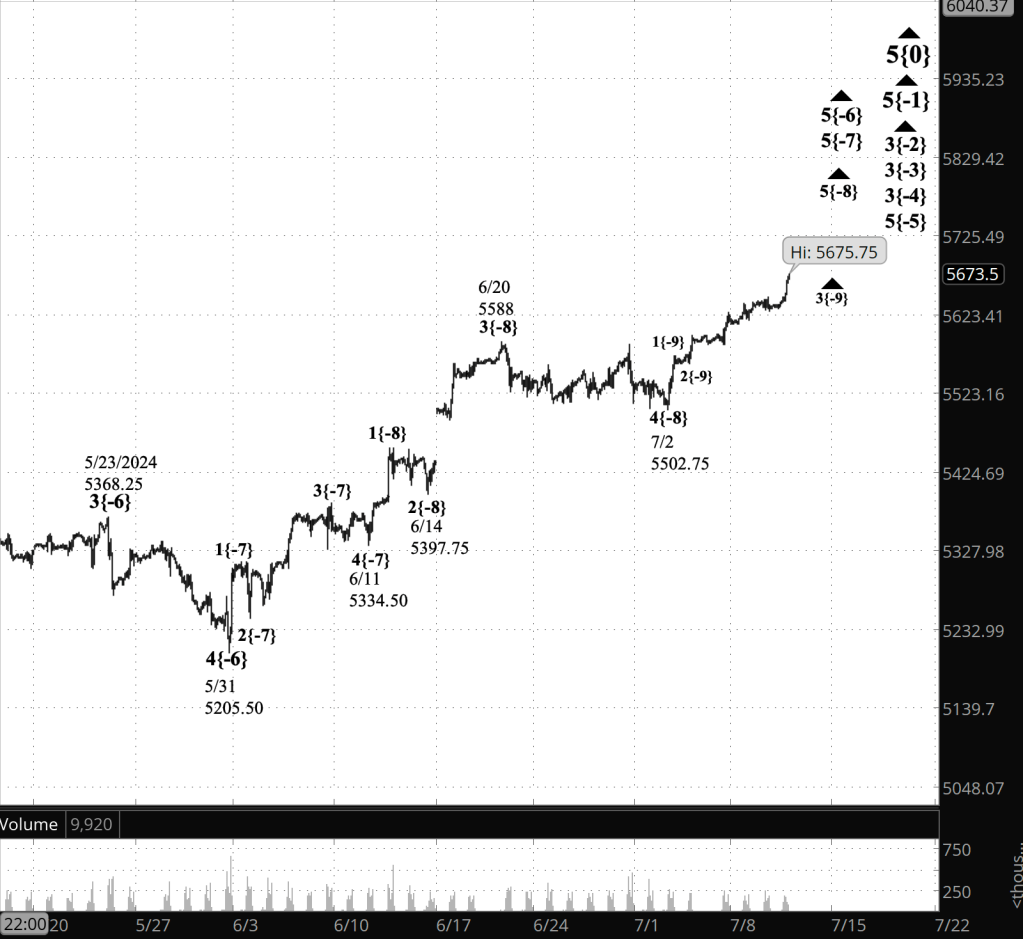
Half an hour before the closing bell. The S&P 500 futures rose during the session, reaching into the 5670s. The middle subwave within the 5th wave uptrend that began on July 2 continues. This morning’s analysis stands unchanged.

I’ve updated the chart.

9:35 a.m. New York time

What’s happening now? The S&P 500 E-mini futures returned to the 5640s overnight, reachng a slightly higher peak.

What does it mean? The 5th wave uptrend that began on July 2, identified through Elliott Wave Theory analysis, continues to work its way higher. It is presently in its 3rd subwave of five.

Wave 5’s completion will also be the end of three larger 5th waves, each degree high than its predecessor in the fractal pattern formed by market prices over time. A 3rd degree, one degree higher, will also end at that point, to be followed by a 4th-wave downtrend of greater magnitude than we’ve seen since February.

[S&P 500 E-mini futures at 3:30 p.m., 90-minute bars, with volume]

What are the alternatives?

There may be a 1st wave on the chart, between wave 5{-6} and 5{-5}. If that’s the proper count, then it would delay the onset or the 4th-wave downward correction, wave 4{-4}. See the June 18 Trader’s Notebook for a more detailed discussion. As the uptrend progresses, this alternative is appearing to be less likely.

What does Elliott wave theory say? Here are the waves that underly the analyses.

Principal Analysis:

  • Rising wave 5{0} is underway. It is a wave of Intermediate degree that began in December 2018.
  • It is in its final subwave, wave 5{-1}.
  • Within wave 5{-1}, rising waves 3{-2}, 3{-3} and 3{-4} are underway, as is wave 5{-5}.
  • Wave 5{-6} is underway and is in its final subwave, uptrending wave 5{-7}, which in turn is in its final subwave, uptrending wave 5{-8}.
  • Within wave 5{-8}, an uptrending subwave, wave 3{-9}, is in progress.

We Are Here.

These are the waves currently in progress under my principal analysis. Each line on the list shows the wave number, with the subscript in curly brackets, the traditional degree name, the starting date, the starting price of the S&P 500 E-mini futures, and the direction of the wave.

Reading the chart. Price movements — waves – – in Elliott wave analysis are labeled with numbers within trending waves and letters with corrective waves. The subscripts — numbers in curly brackets — designate the wave’s degree, which, in Elliott wave analysis, means the relative position of a wave within the larger and smaller structures that make up the chart. R.N. Elliott, who in the 1930s developed the form of analysis that bears his name, viewed the chart as a complex structure of smaller waves nested within larger waves, which in turn are nested within still larger waves. In mathematics it’s called a fractal structure, where at every scale the pattern is similar to the others.

Learning and other resources. Elliott wave analysis provides context, not prophecy. As the 20th century semanticist Alfred Korzybski put it in his book Science and Sanity (1933), “The map is not the territory … The only usefulness of a map depends on similarity of structure between the empirical world and the map.” And I would add, in the ever-changing markets, we can judge that similarity of structure only after the fact.

See the menu page Analytical Methods for a rundown on where to go for information on Elliott wave analysis.

By Tim Bovee, Portland, Oregon, July 10, 2024

Disclaimer

Tim Bovee, Private Trader tracks the analysis and trades of a private trader for his own accounts. Nothing in this blog constitutes a recommendation to buy or sell stocks, options or any other financial instrument. The only purpose of this blog is to provide education and entertainment.

No trader is ever 100 percent successful in his or her trades. Trading in the stock and option markets is risky and uncertain. Each trader must make trading decisions for his or her own account, and take responsibility for the consequences.

License
Creative Commons License

All content on Tim Bovee, Private Trader by Timothy K. Bovee is licensed under a Creative Commons Attribution-ShareAlike 4.0 International License.

Based on a work at www.timbovee.com.