3:30 p.m. New York time
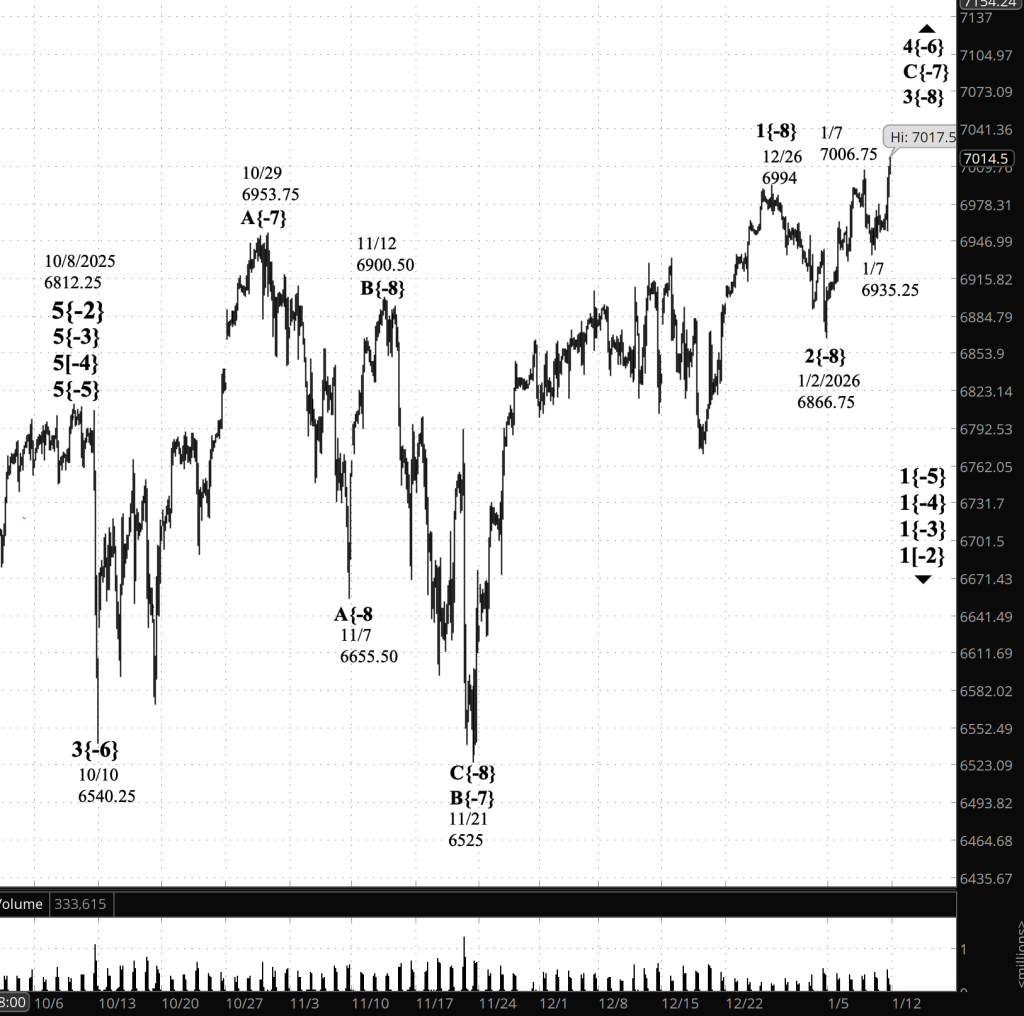
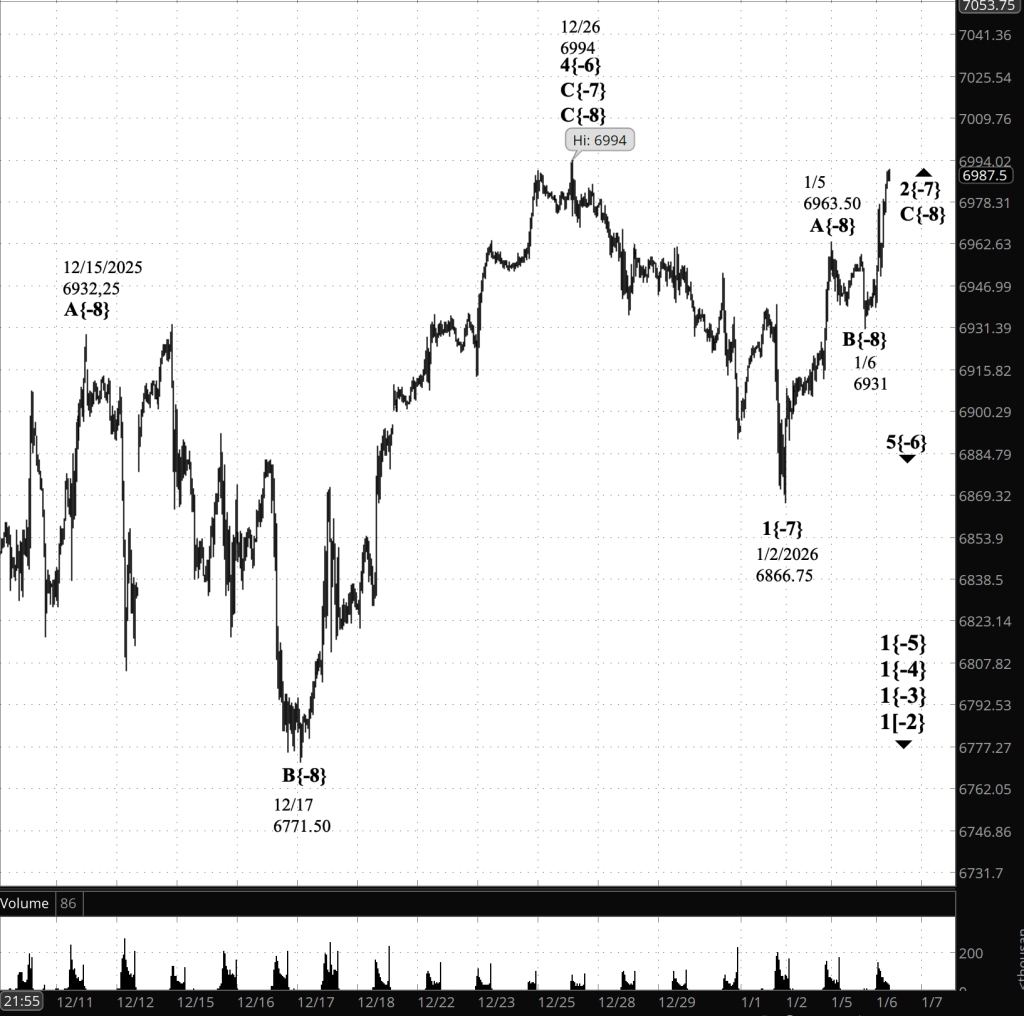
Half an hour before the closing bell. The S&P 500 futures continued rising during the session, reaching 7017.25, and then reversed sharply, falling back into the 6970s.
Elliott Wave Theory. The key feature today is not the new high, but the character of the decline that followed it. The reversal was fast and decisive, which argues for a turn in trend rather than a routine dip within an ongoing advance. In that light, today’s decline looks more like a resumption of declining wave 4{-8} than a temporary pullback within rising wave 3{-8}.
If the decline extends and sustains beneath 6986, and especially if it presses toward yesterday’s low zone, the case for wave 4{-8} strengthens. Conversely, if the market recovers late and retakes the 7010–7017 area with staying power, then the “wave 3{-8} continues” scenario remains viable.
Key levels. Two price zones matter most. First is the recovery ceiling, 7010–7017.25. If the market can reclaim that zone and hold it, then the case for rising wave 3{-8} revives. Second is the support shelf in the high-6900s, centered on 6986. A sustained break below 6986 strengthens the wave 4{-8} interpretation, and a renewed break beneath 6923.25 would move it from “likely” to “confirmed.”
Likelihoods. At mid-session the evidence is mixed, but the character of the move matters. A slow drift lower would fit the idea of a pullback within an ongoing rise. That is not what we saw. The decline off 7017.25 was abrupt and impulsive, which leans toward a larger trend change. For that reason, the odds now favor the view that wave 4{-8} is resuming, unless buyers can reverse the reversal and retake the 7010–7017 zone before the close.
Today’s sharp reversal shifts the edge back toward declining wave 4{-8}, but the final decision remains price-driven into the close.
9:35 a.m. New York time.
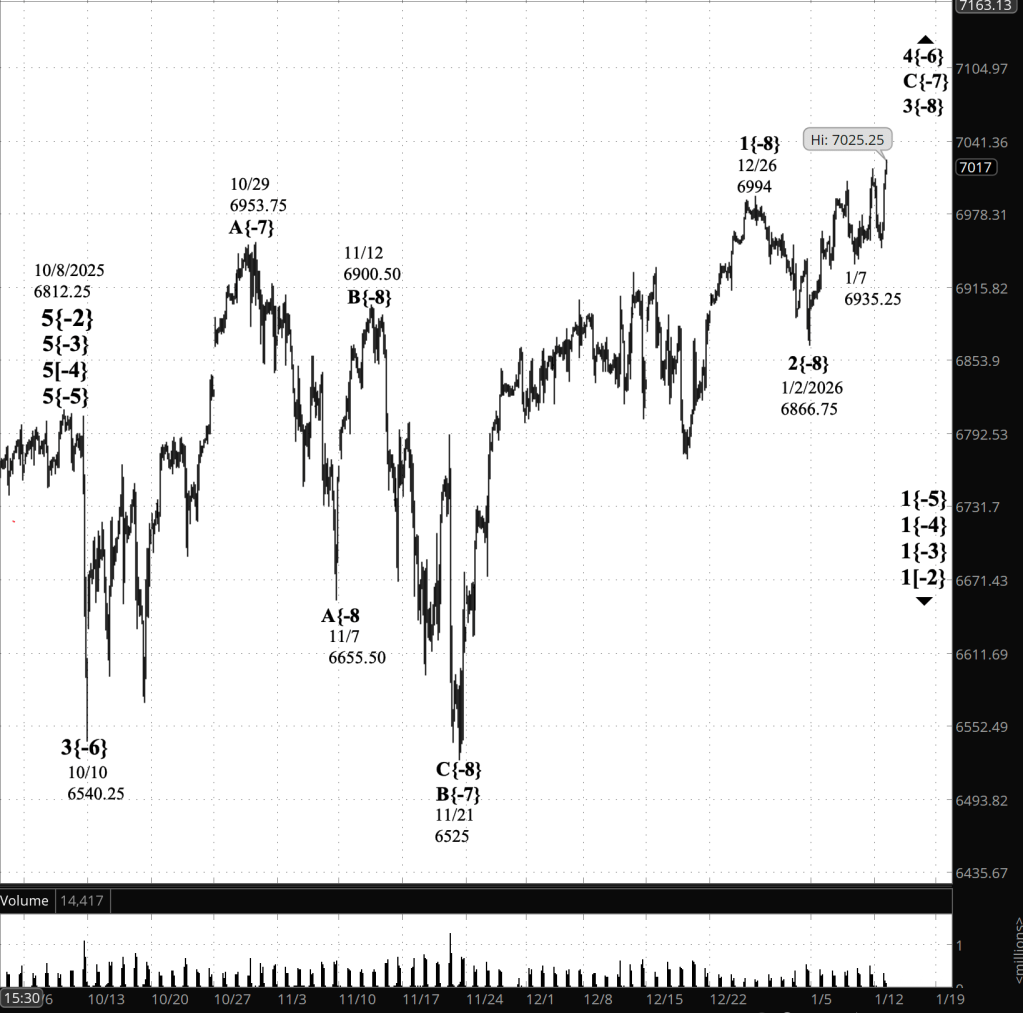
What’s happening now. The S&P 500 E-mini futures rose overnight from 6949.50 and has so far reached a high of 7002.
What does it mean? The question posed by Elliott Wave Theory analysis remains the same: does rising wave 3{-8} continue, or has it ended with declining wave 4{-8} now underway?
Yesterday’s decline was sufficient to tilt the analysis in favor of wave 4{-8}, and I adjusted the chart labeling to reflect it. Overnight, however, the market reversed higher. That recovery increases the likelihood that wave 3{-8} is still underway, with wave 4{-8} delayed into the future.
Levels to watch. Yesterday’s closing analysis concluded: “A break to a new low beneath 6923.25 would further confirm wave 4{-8}; a sustained recovery back above 6986.00 would weaken that conclusion.” Overnight, the market held above 6923.25 and recovered above 6986.00, weakening the wave 4{-8} case.
From here, two price tests matter most:
- 7036.25 (the January 13 peak). A push to new highs above 7036.25 would strongly favor the view that wave 3{-8} is still advancing.
- 6923.25 (yesterday’s key low). A renewed break below 6923.25 would put wave 4{-8} back in the driver’s seat.
Bottom line. Overnight price action has materially weakened yesterday’s wave 4{-8} conclusion. I’ll decide in today’s closing analysis whether to revert the labeling back to the wave 3{-8} continues scenario.
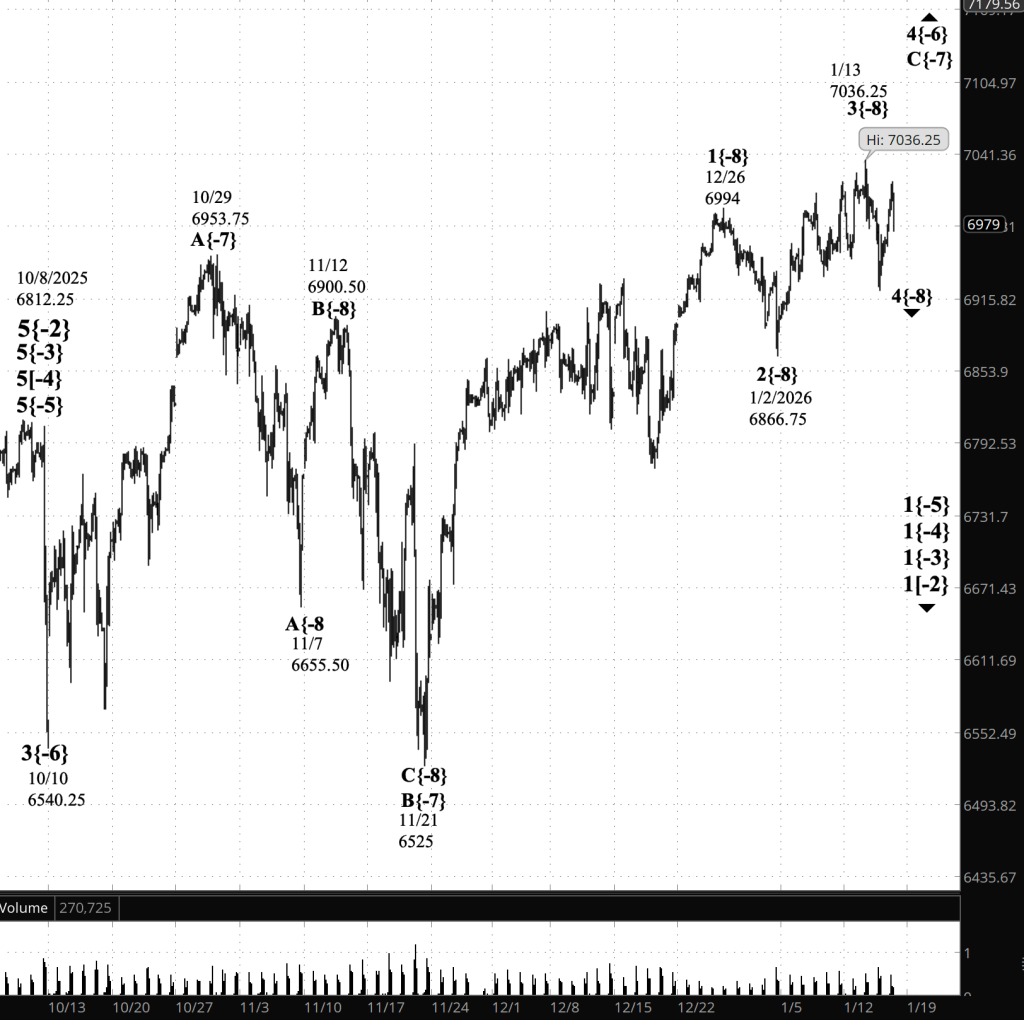
[S&P 500 E-mini futures at 3:30 p.m., 159-minute bars, with volume]
Waves Now Underway
These are the waves currently in progress under my principal analysis. Each line on the list shows the wave number, with the subscript in curly brackets, the traditional degree name, the starting date, the starting price of the S&P 500 E-mini futures, and the direction of the wave.
Most of the waves began not long ago, on October 8, 2025. See my essay posted on October 12, 2025, “The End of the Rise from 1932? Elliott Wave Theory Says ‘Yes’”, for a discussion of how that happened.
The difficult problem of estimating when a wave change should be accept as real rather than a headfake is addressed by the essay titled, “Is This Reversal Real?: How to Tell Without Being Whipsawed”.
- 1{+4} Supermillennium, (unknown start date or start price) {down}
- A hypothetical wave one degree higher than Supercyle, needed to make the wave analysis complete.
- S&P 500 Index:
- 1{+3} Supercycle, 10/8/2025, 6812.25 (down}
- 1{+2} Cycle, 10/8/2025, 6812.25 (down}
- 1{+1} Primary, 10/8/2025, 6812.25 (down}
- 1{0} Intermediate, 10/8/2025, 6812.25 (down}
- 1{-1} Minor, 10/8/2025, 6812.25 (down}
- 1{-2} Minute, 10/8/2025, 6812.25 (down}
- S&P 500 Futures
- 1{-3} Minuette 10/8/2025, 6812.25 (down}
- 1{-4} Subminutte 10/8/2025, 6812.25 (down}
- 1{-5} Micro, 10/8/2025, 6812.25 (down}
- 4{-6} Submicro, 10/10/2025, 6540.25 (up)
- C{-7} Minuscule, 11/21/2025, 6525 (up)
- 4{-8} (none), 1/13/2026, 7036.25 (down)
Reading the chart. Price movements — waves – – in Elliott Wave Theory analysis are labeled with numbers within trending waves and letters with corrective waves. The subscripts — numbers in curly brackets — designate the wave’s degree, which, in Elliott Wave analysis, means the relative position of a wave within the larger and smaller structures that make up the chart. R.N. Elliott, who in the 1930s developed the form of analysis that bears his name, viewed the chart as a complex structure of smaller waves nested within larger waves, which in turn are nested within still larger waves. In mathematics it’s called a fractal structure, where at every scale the pattern is similar to the others.
Learning and other resources. Elliott Wave analysis provides context, not prophecy. As the 20th century semanticist Alfred Korzybski put it in his book Science and Sanity (1933), “The map is not the territory … The only usefulness of a map depends on similarity of structure between the empirical world and the map.” And I would add, in the ever-changing markets, we can judge that similarity of structure only after the fact.
See the menu page Analytical Methods for a rundown on where to go for information on Elliott Wave analysis.
By Tim Bovee, Portland, Oregon, January 15, 2026
Disclaimer
Tim Bovee, Private Trader tracks the analysis and trades of a private trader for his own accounts. Nothing in this blog constitutes a recommendation to buy or sell stocks, options or any other financial instrument. The only purpose of this blog is to provide education and entertainment.
No trader is ever 100 percent successful in his or her trades. Trading in the stock and option markets is risky and uncertain. Each trader must make trading decisions for his or her own account, and take responsibility for the consequences.
All content on Tim Bovee, Private Trader by Timothy K. Bovee is licensed under a Creative Commons Attribution-ShareAlike 4.0 International License.
Based on work at www.timbovee.com

You must be logged in to post a comment.