3:30 p.m. New York time
Half an hour before the opening bell. The S&P 500 futures traded sideways during the session, moving up at one point to set a new high for the upward correction, of 4802.25.
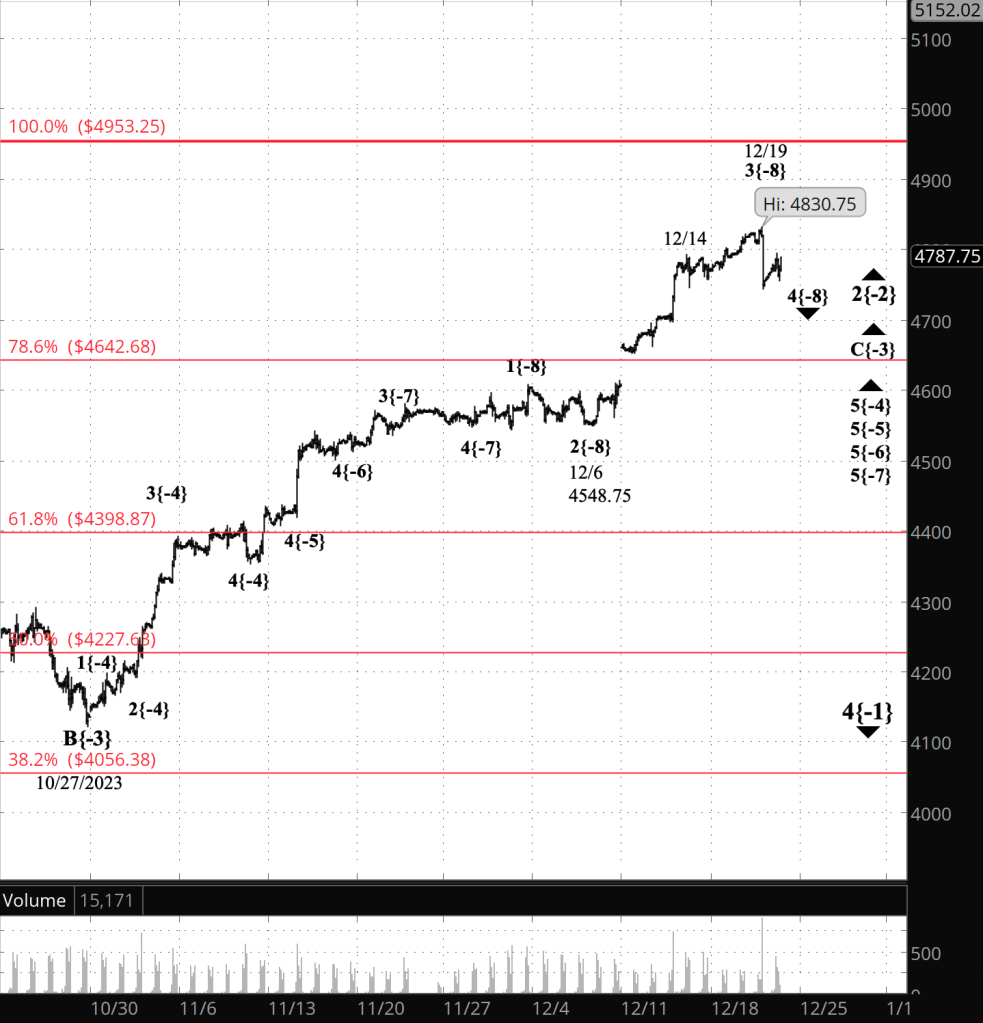
This morning’s analysis stands unchanged, along with all of the ambiguities. I’ve updated the upper chart, showing wave C within the correction, and left unchanged the lower chart, showing the entire Diagonal Triangle discussed this morning.
2:05 p.m. New York time
Trades. Two trades today: One out, one in, both short Iron Fly positions.
My position on SPY expired after the close on December 15 for an 8.3% loss. I had intended to hold the position over the weekend and exit at the opening bell on December 18, but I erred in setting up the trade.
I entered a position on XSP, which expires on December 19 (1DTE).
I’ve updated the trade analysis on SPY with full results and posted a trade analysis on XSP.
9:35 a.m. New York time
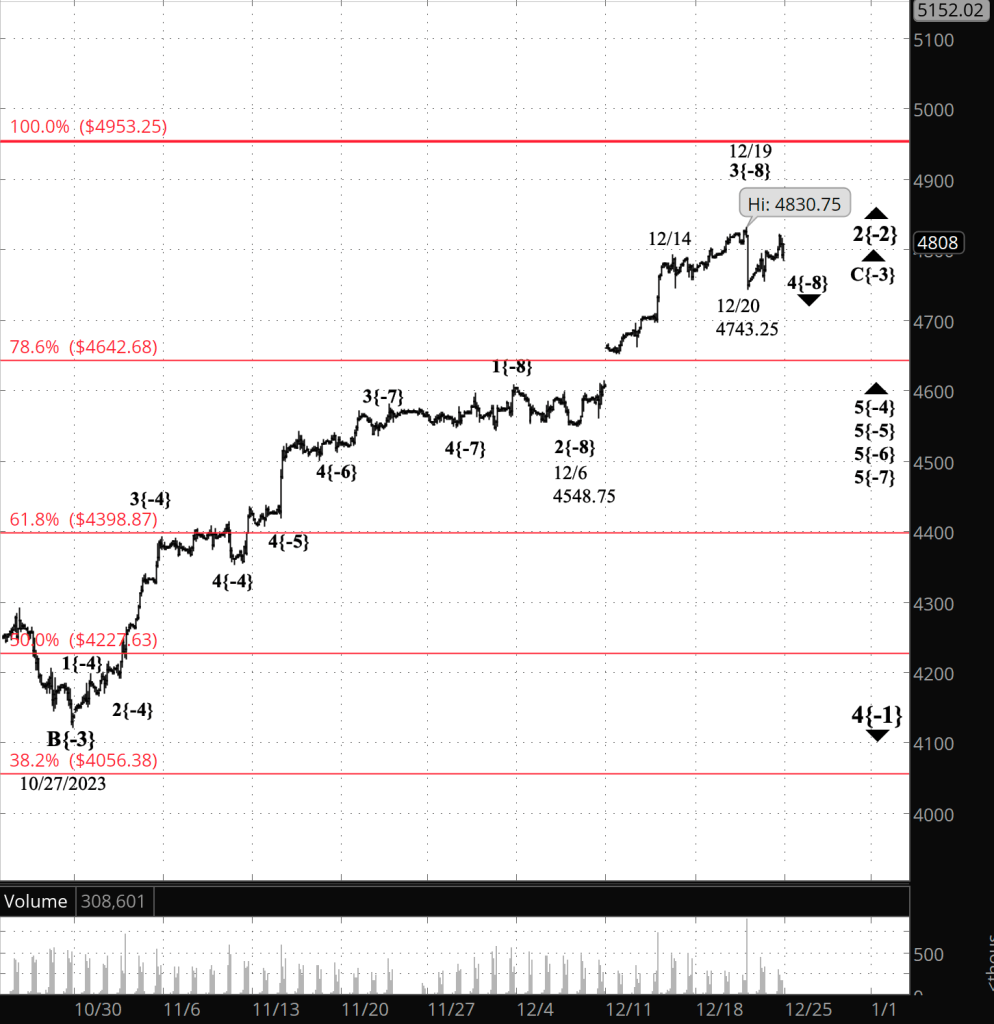
What’s happening now? The S&P 500 E-mini futures stayed within a narrow range after trading resumed overnight, remaining below the December 14 reversal point, 4791.45.
What does it mean? The 2nd-wave upward correction that began on October 13, 2022, is in the wave C subwave, likely the final wave in the correction. I’ve placed a Fibonacci retracement ladder on the chart, in red, to better judge how far the correction has traveled in relation to the 1st wave that preceded it.
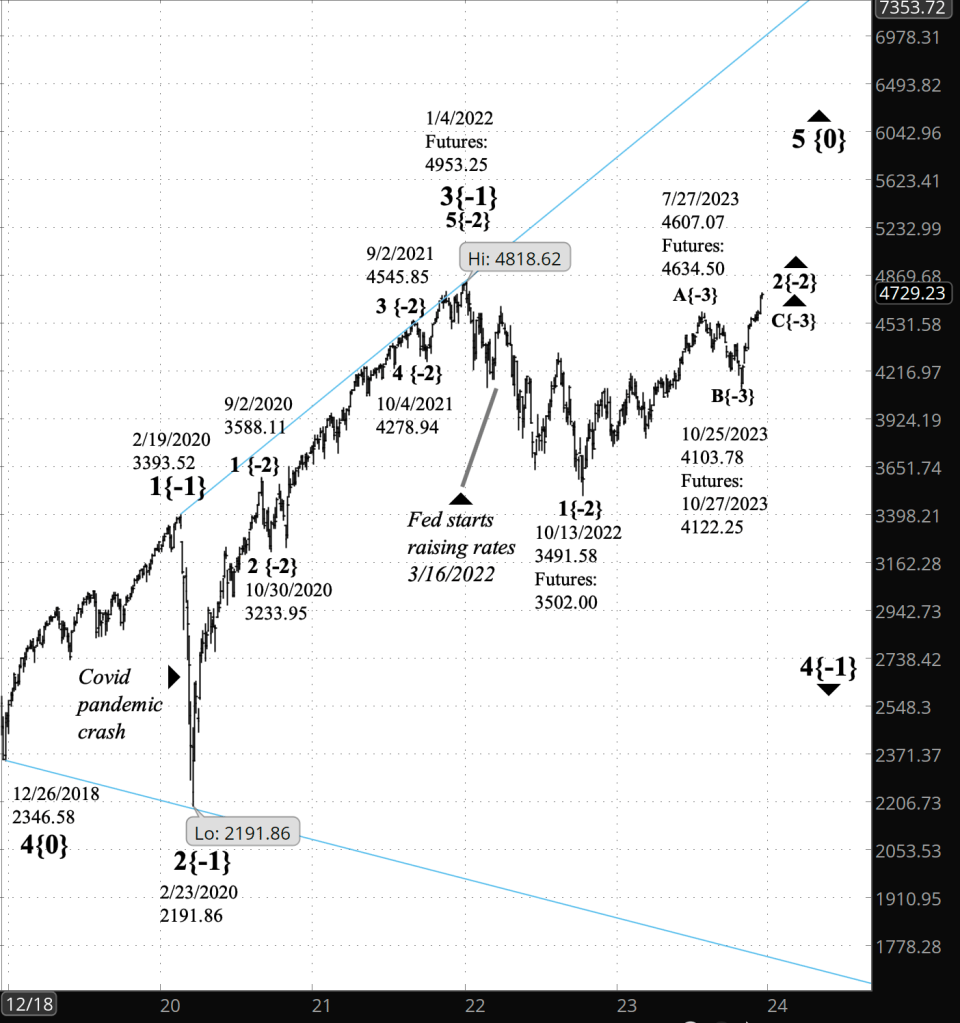
Wave and wave 1 are both subwaves of a larger wave 4, the declining next-to-the-last subwave of an expanding triangle that began in December 2018.
The Fibonacci ladder shows that wave C is approaching the starting point of the preceding 1st wave that began the ongoing downtrend on January 4, 2022 from 4953.25. If the price exceeds that level, then it will break a firm rule of Elliott Wave Theory: No 2nd wave can move beyond the starting point of the preceding 1st wave of the same degree.
On this chart, if the rule is broken, then there will be major change in the analysis,. One level higher than the present upward correction and its preceding 1st wave is the 4th wave of an expanding Diagonal Triangle that began on December 26, 2018. Should the correction exceed it’s upper limit, then the new analysis would mean that the 3rd wave of the Diagonal Triangle, which began on February 23, 2020 at the end of the pandemic crash. That implies much more upside than the present analysis allows.
Note that under the present analysis I hedged whether wave C will be the end of the wave 2 correction. Most corrections contain one corrective pattern, but some form a complex structure, containing two or three corrective patterns. There’s no way to say at this point whether or not wave 2 will go complex.
What are the alternatives? At smaller degrees, wave C is in its final waves of the corrective pattern. The subwaves in my principal analysis are five degrees lower than the C wave (degree {-2}. It’s possible that the precent smallest wave I’m tracking, a 3rd wave at degree {-8}, is instead wave 5{-8}, with the 3rd wave having ended at the December 14 high.
Charts. There are two. The upper chart, of the futures, focuses on wave C, which began on October 27 this year. The lower chart, of the S&P 500 index, shows the expanding Diagonal Triangle that began on December 26, 2018, of which the present 2nd-wave correction is a subwave two degrees lower.
[S&P 500 E-mini futures at 3:30 p.m., 105-minute bars, with volume]
[S&P 500 index at 9:30 a.m., 3-day bars]
What does Elliott wave theory say? Here are the waves that underly the analyses.
Principal Analysis:
- A downtrend, wave 4{-1}, began on January 4, 2022 and is underway.
- Within wave 4{-1}, an upward correction, wave 2{-2}, began on October 13, 2022.
- The third wave of the correction, wave C{-3}, is underway.
- Wave C{-3} has reached its 5th and final subwave, wave 5{-4} and a series of smaller 5th waves, down to wave 5{-7}.
- Wave 5{-7} internally contains two possiblilities of nearly equal likelihood. Either…
- … the middle subwave, rising wave 3{-8}, is underway, or…
- … the next-to-the-last subwave, a 4{-8}, a downward correction, began with the December 14 high.
We Are Here.
These are the waves currently in progress under my principal analysis. Each line on the list shows the wave number, with the subscript in curly brackets, the traditional degree name, the starting date, the starting price of the S&P 500 E-mini futures, and the direction of the wave.
- S&P 500 Index:
- 5{+3} Supercycle, 7/8/1932, 4.40 (up)
- 5{+2} Cycle, 12/9/1974, 60.96 (up)
- 5{+1} Primary, 3/6/2009, 666.79 (up)
- 5{0} Intermediate, 12/26/2018, 2346.58 (up)
- S&P 500 Futures and index:
- 4{-1} Minor, 1/4/2022, 4953.25 (down) (futures), 4818.62 (down) (index)
- S&P 500 Futures:
- 2{-2} Minute, 10/13/2022, 3491.58 (up)
- C{-3} Minuette, 10/27/2023, 4122.25 (up)
Reading the chart. Price movements — waves – – in Elliott wave analysis are labeled with numbers within trending waves and letters with corrective waves. The subscripts — numbers in curly brackets — designate the wave’s degree, which, in Elliott wave analysis, means the relative position of a wave within the larger and smaller structures that make up the chart. R.N. Elliott, who in the 1930s developed the form of analysis that bears his name, viewed the chart as a complex structure of smaller waves nested within larger waves, which in turn are nested within still larger waves. In mathematics it’s called a fractal structure, where at every scale the pattern is similar to the others.
Learning and other resources. Elliott wave analysis provides context, not prophecy. As the 20th century semanticist Alfred Korzybski put it in his book Science and Sanity (1933), “The map is not the territory … The only usefulness of a map depends on similarity of structure between the empirical world and the map.” And I would add, in the ever-changing markets, we can judge that similarity of structure only after the fact.
See the menu page Analytical Methods for a rundown on where to go for information on Elliott wave analysis.
By Tim Bovee, Portland, Oregon, December 18, 2023
Disclaimer
Tim Bovee, Private Trader tracks the analysis and trades of a private trader for his own accounts. Nothing in this blog constitutes a recommendation to buy or sell stocks, options or any other financial instrument. The only purpose of this blog is to provide education and entertainment.
No trader is ever 100 percent successful in his or her trades. Trading in the stock and option markets is risky and uncertain. Each trader must make trading decisions for his or her own account, and take responsibility for the consequences.
License

All content on Tim Bovee, Private Trader by Timothy K. Bovee is licensed under a Creative Commons Attribution-ShareAlike 4.0 International License.
Based on a work at www.timbovee.com.


You must be logged in to post a comment.