8:15 p.m. New York time
Short Iron Fly trades on QQQ, SPY & GLD. I exited my QQQ short Iron Fly position on expiration day, a day after entry on November 15, for a 7.4% profit and have updated the trade analysis with full details.
I also entered two positions during the session, short Iron Flies on SPY and GLD, and have posted an analysis of the trades. They are 1DTE position that expire on November 17 and so will exited early in tomorrow’s session.
3:30 p.m. New York time
Half an hour before the closing bell. The S&P 500 futures traded sideways during the session, staying in the 4520s and 4510s except for two breakouts. One of the breakouts briefly peaked above the 78.6% Fibonacci retracement level and then retreated.
This morning’s principal analysis, which sees the A wave within the ongoing 4th wave upper correction as having ended with the November 15 high, and the declining B wave having begun, is unchanged. Although the chart during the session stayed consistent with the principal analysis, the alternative, which sees wave A as still being underway, remains equally likely.
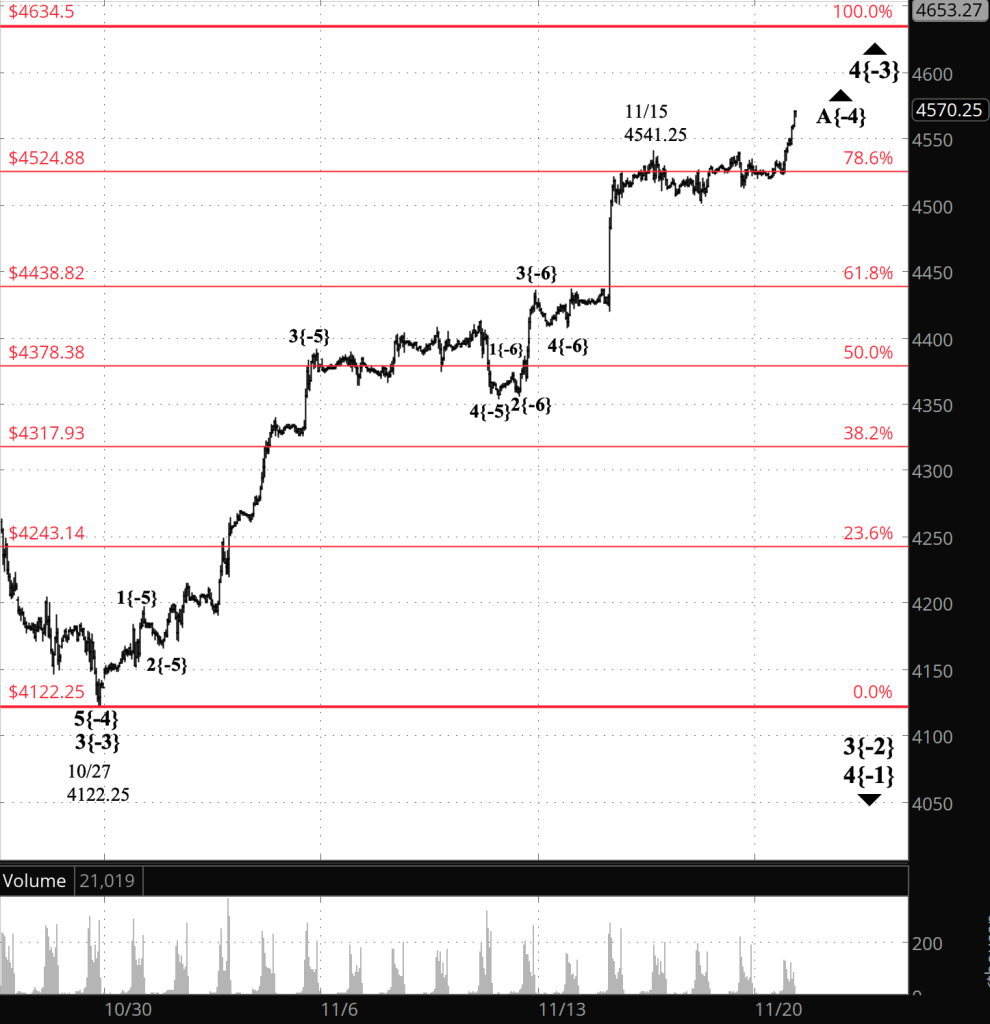
I’ve updated the lower chart, showing the entirety of the upward correction so far.
12:15 p.m. New York time
What’s the Sahm Rule Up To? A reliable and sensitive recession indictor, the Federal Reserve’s Sahm Rule, is coming closer to declaring that a recession is underway, and indeed may have been underway for three months. I’ve posted a report on the subject.
9:35 a.m. New York time
What’s happening now? The S&P 500 E-mini futures traded sideways overnight, remaining below yesterday’s session high, 4541.25, and also below the 78.6% Fibonacci retracement level.
What does it mean? The nature of the overnight pattern suggests tome that the initial subwave, wave A, with the 4th-wave upward correction is complete at 4541.25, and declining wave B has begun.
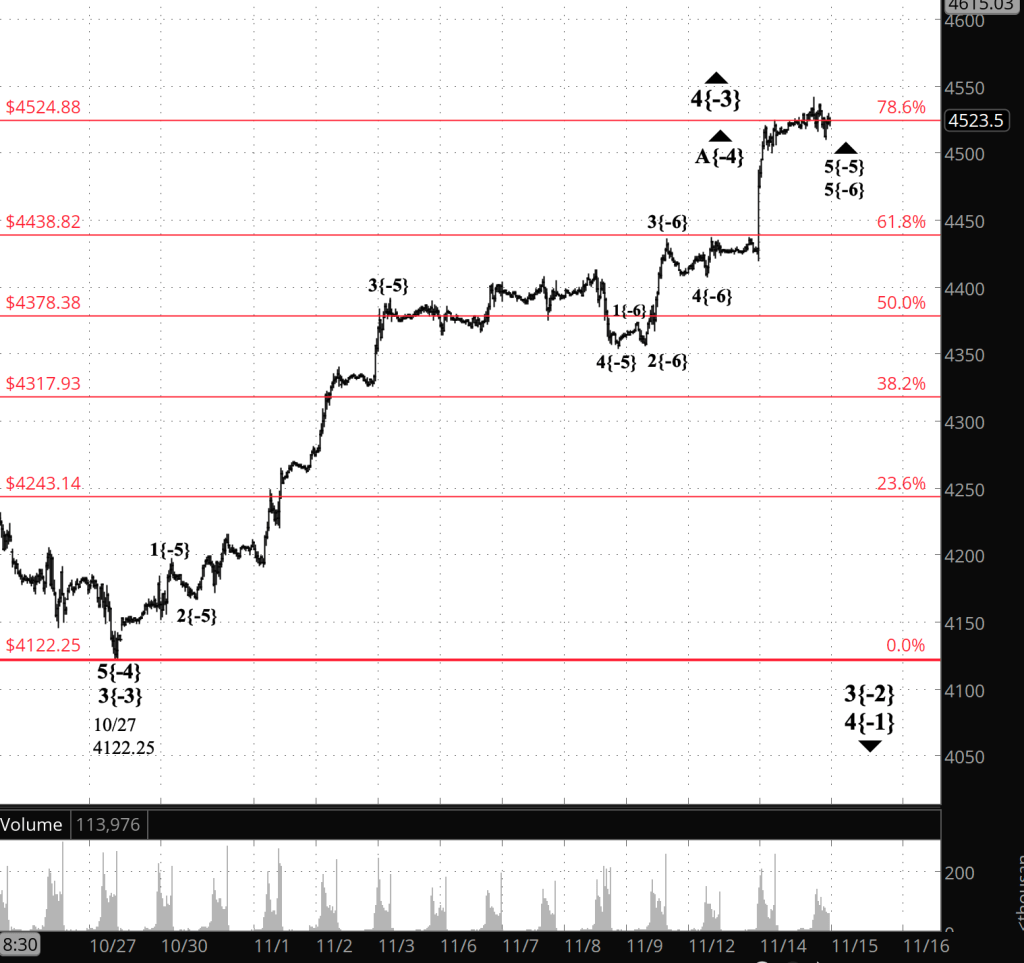
Here’s a very close-up chart showing the price movements from yesterday to half an hour before the opening bell.
[S&P 500 E-mini futures at 9 a.m., 5-minute bars, with volume]
Here’s my reasoning.
First, there’s the slope of the price — what we get when we smooth out the small fluctuations and concentrate solely on the direction. That slope had a downward pitch overnight for the first time since the price reached the 78.6% retracement level and stalled.
Second, there’s the wave pattern: Waves 1 to 4 with the 3rd wave being the longest and, internally, having a five-way pattern. This is the tell-tale of a trend in Elliott Wave analysis.
The degree of those waves is indeterminate at this point — very low, for sure. The first tentative steps within a larger wave declining wave B{-4}.
So I’ve switched the labeling on the chart to what was the second scenario in yesterday’s analysis, promoting it to the status of principal analysis.
The alternative scenario, the first scenario yesterday’s analysis, is still of equal likelihood. It treats the decline from yesterday’s peak as a small retreat within the ongoing wave A{-4}.
The question will be decided, as always, by the chart. If the price moves above 4541.25, then my switch to the second scenario was premature. If the price remains below that level, then in my mind that’s further evidence that the second scenario is playing out and wave B is underway.
What are the alternatives? Unchanged from yesterday.
The upper boundary of the 4th-wave upward correction is 4541.25, the beginning of the preceding 1st wave of the same degree. If the price goes above that level, then the degrees of the entire correction get moved up, making it a correction one-degree down from the January 4, 2022 peak, 4953.25, and that level becomes the new upward limit. We’re not there yet, but it’s a possibility.
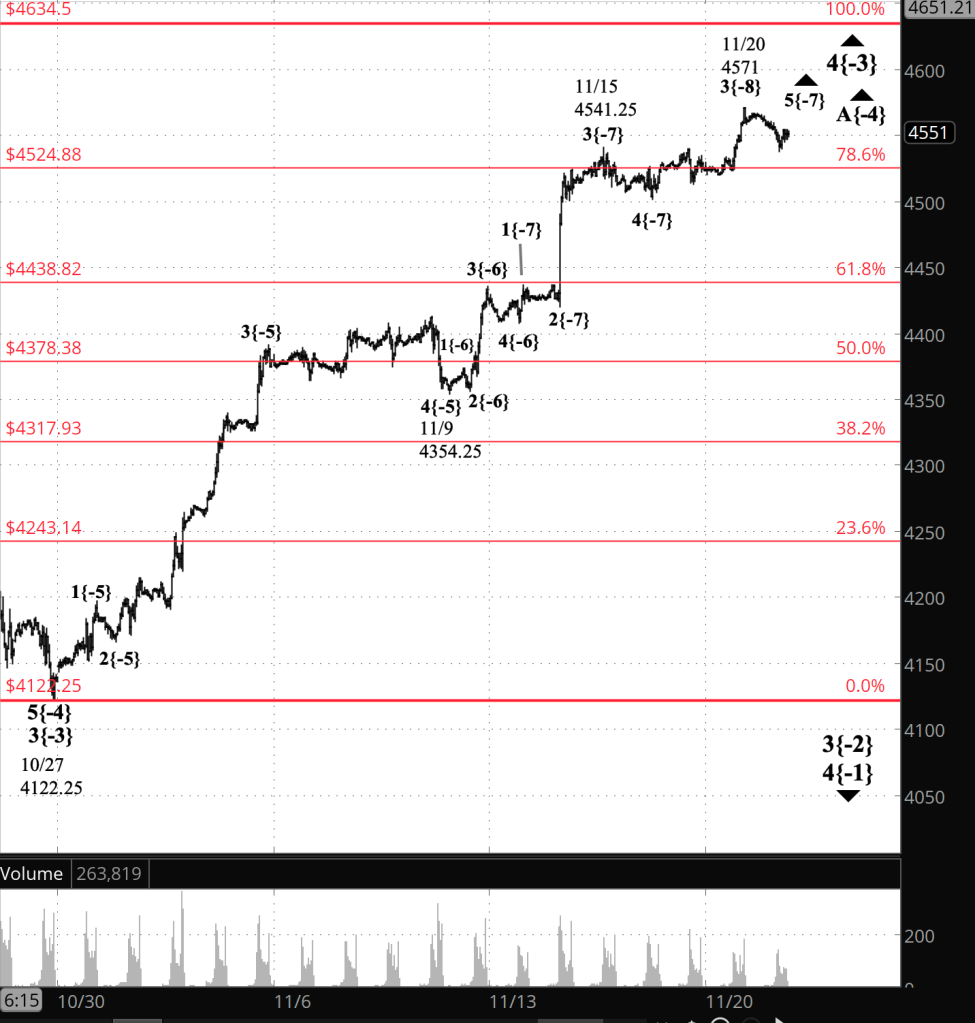
[S&P 500 E-mini futures at 3:30 p.m., 35-minute bars, with volume]
What does Elliott wave theory say? Here are the waves that underly the analyses.
Principal Analysis:
- A downtrend, wave 3{-2}, began on July 27 and is underway.
- Within wave 3{-2}, an upward correction, wave 4{-3}, began on October 27.
- Wave 4{-3} internally has two possibilities, each of equal likelihood:
- Scenario 1: Either rising wave A{-4} continues and is nearing it’s end.
- Scenario 2: Or wave A{-4} ended on November 10 at 4425.75 and wave B{-4} began from that point.
- Under the first scenario, wave A{-4} is its final subwave, wave 5{-5}, which in turn is in its final subwave, wave 5{-6}.
- Under the second scenario, declining wave B{-4} has begun and is in its initial subwave, wave A{-5}.
- The second scenario is presently my principle analysis.
We Are Here.
These are the waves currently in progress under my principal analysis. Each line on the list shows the wave number, with the subscript in curly brackets, the traditional degree name, the starting date, the starting price of the S&P 500 E-mini futures, and the direction of the wave.
- S&P 500 Index:
- 5{+3} Supercycle, 7/8/1932, 4.40 (up)
- 5{+2} Cycle, 12/9/1974, 60.96 (up)
- 5{+1} Primary, 3/6/2009, 666.79 (up)
- 5{0} Intermediate, 12/26/2018, 2346.58 (up)
- S&P 500 Futures and index:
- 4{-1} Minor, 1/4/2022, 4953.25 (down) (futures), 4818.62 (down) (index)
- S&P 500 Futures:
- 3{-2} Minute, 7/27/2023, 3502 (down)
- 4{-3} Minuette, 10/27/2023, 4122.25 (up)
- B{-4} Subminuette, 11/15/2023, 4541.25 (down)
Reading the chart. Price movements — waves – – in Elliott wave analysis are labeled with numbers within trending waves and letters with corrective waves. The subscripts — numbers in curly brackets — designate the wave’s degree, which, in Elliott wave analysis, means the relative position of a wave within the larger and smaller structures that make up the chart. R.N. Elliott, who in the 1930s developed the form of analysis that bears his name, viewed the chart as a complex structure of smaller waves nested within larger waves, which in turn are nested within still larger waves. In mathematics it’s called a fractal structure, where at every scale the pattern is similar to the others.
Learning and other resources. Elliott wave analysis provides context, not prophecy. As the 20th century semanticist Alfred Korzybski put it in his book Science and Sanity (1933), “The map is not the territory … The only usefulness of a map depends on similarity of structure between the empirical world and the map.” And I would add, in the ever-changing markets, we can judge that similarity of structure only after the fact.
See the menu page Analytical Methods for a rundown on where to go for information on Elliott wave analysis.
By Tim Bovee, Portland, Oregon, November 16, 2023
Disclaimer
Tim Bovee, Private Trader tracks the analysis and trades of a private trader for his own accounts. Nothing in this blog constitutes a recommendation to buy or sell stocks, options or any other financial instrument. The only purpose of this blog is to provide education and entertainment.
No trader is ever 100 percent successful in his or her trades. Trading in the stock and option markets is risky and uncertain. Each trader must make trading decisions for his or her own account, and take responsibility for the consequences.
License

All content on Tim Bovee, Private Trader by Timothy K. Bovee is licensed under a Creative Commons Attribution-ShareAlike 4.0 International License.
Based on a work at www.timbovee.com.


You must be logged in to post a comment.