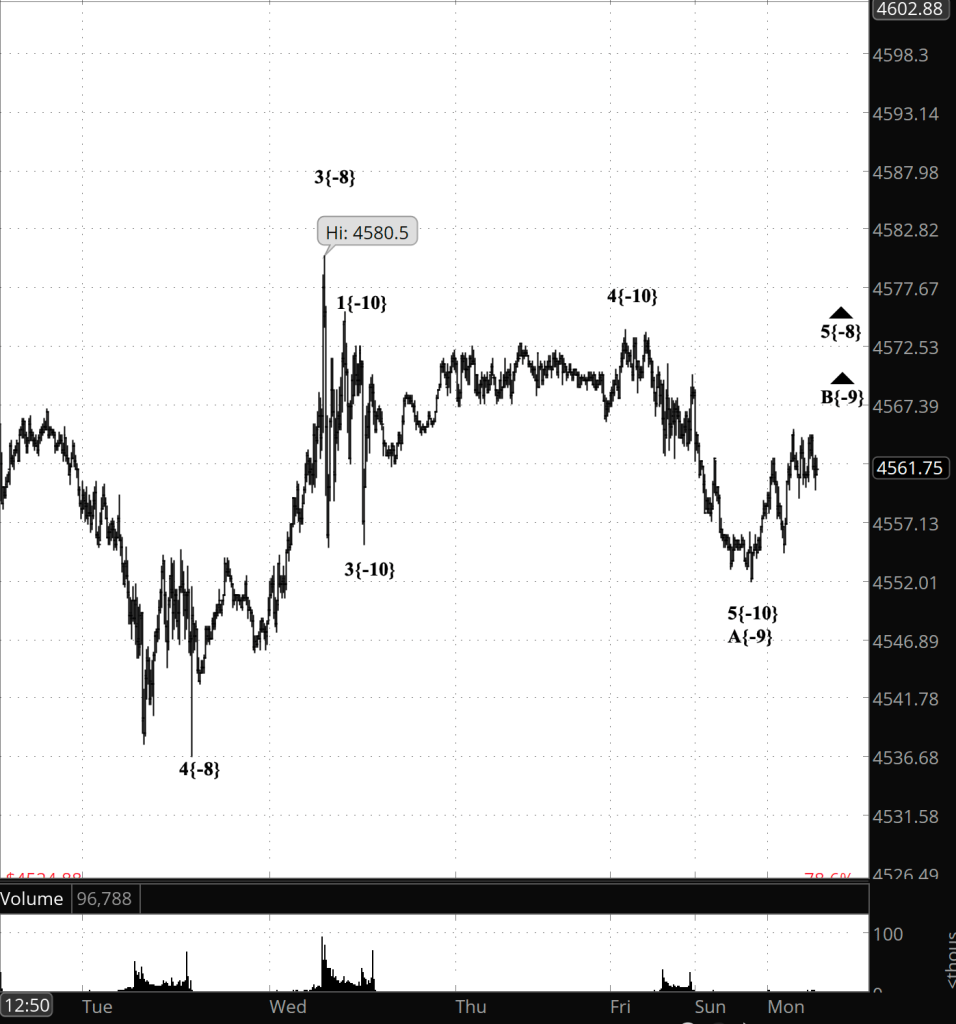
3:30 p.m. New York time
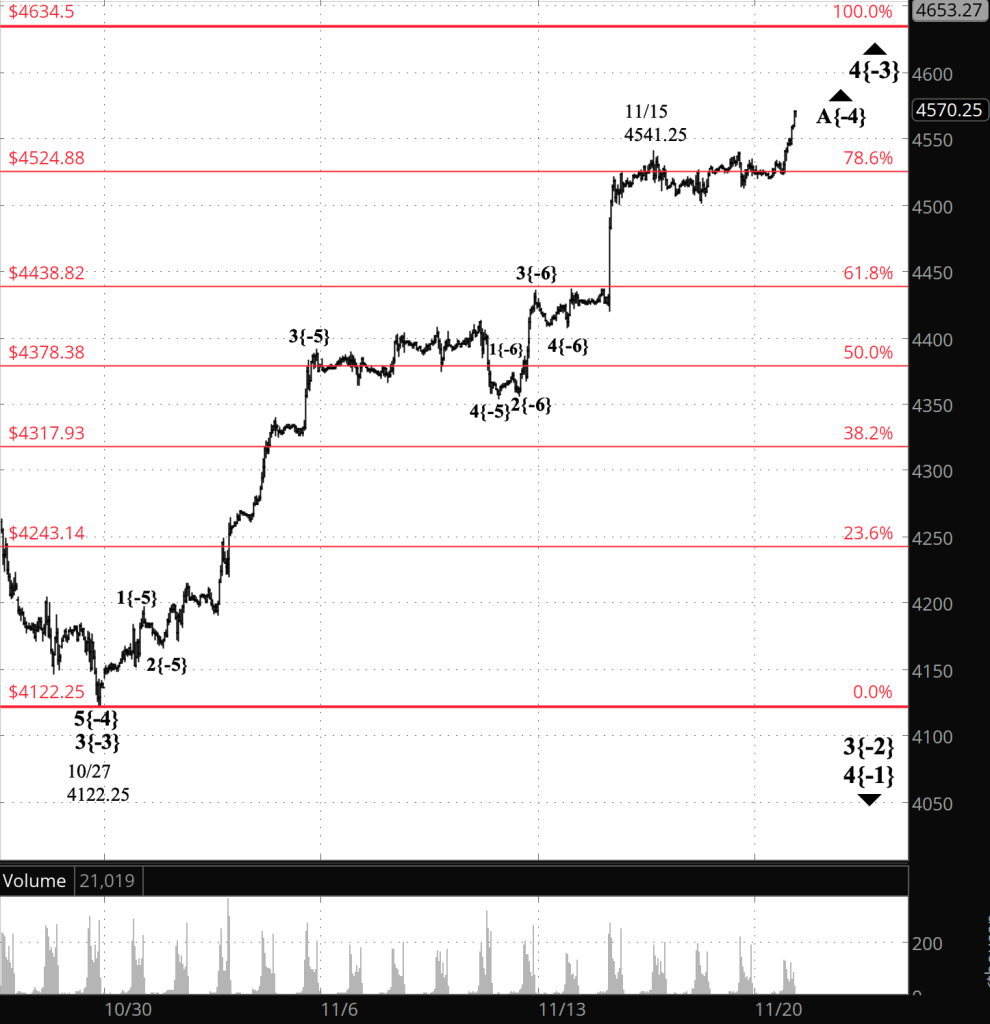
Half an hour before the closing bell. The S&P 500 futures fell rapidly during the session, from a high of 4577.25 back into the 4550s. The session high came to within four points of 4580.50, the peak on November 22 of the first subwave of the upward correction that began on October 27, but then pulled back.
The price remains above the 78.6% Fibonacci retracement level, which was a stalling point in the rise to the rise to the November 22 high.
This morning’s analysis still appllies: Two scenarios of equal likelihood.
- Scenario #1: Rising wave A ended continues to work through it’s 5th and final wave, or
- Scenario #2: Rising wave A ended on November 22 and falling wave B has begun.
For chart labels, I’m staying with Scenario #1 for now, in part because of the lack of a significant decline from the October 27 peak.
9:35 a.m. New York time
What’s happening now? The S&P 500 E-mini futures stair-stepped lower overnight, from the 4560s to the 4540s.
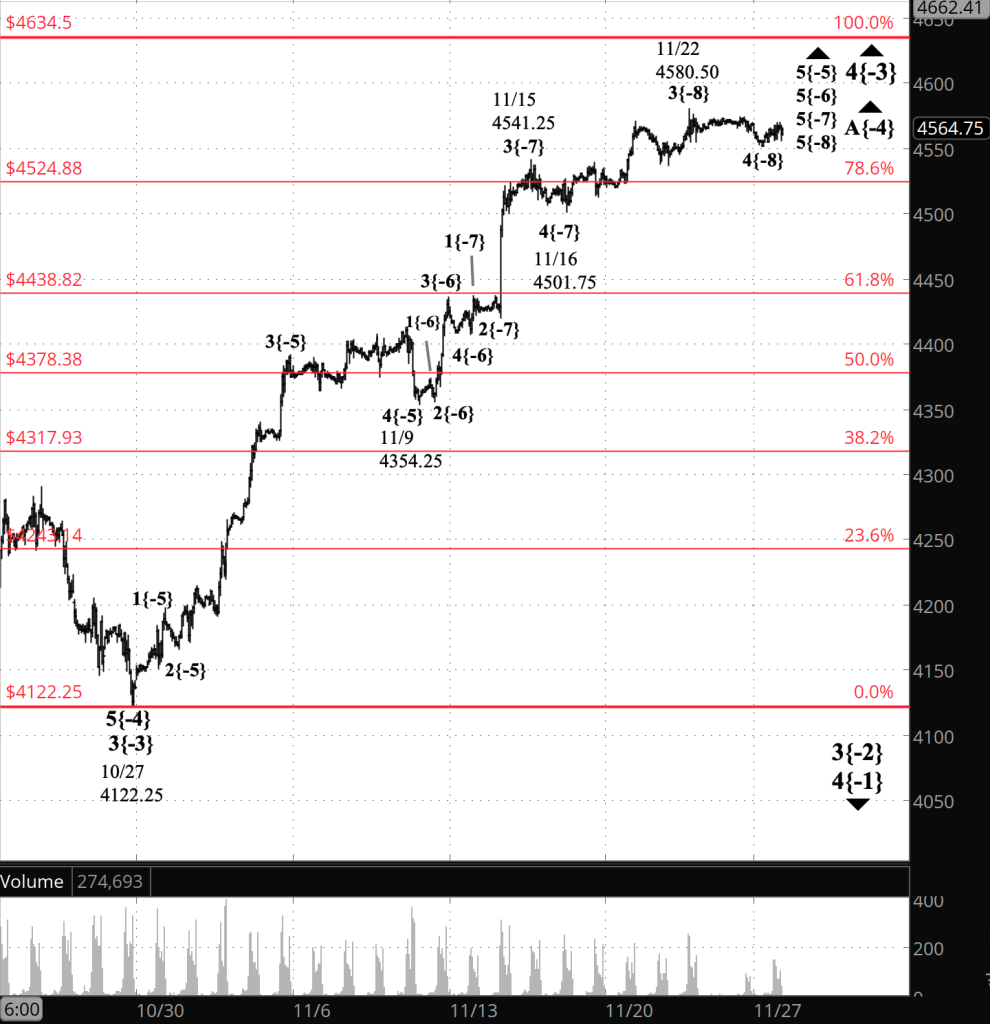
What does it mean? The initial subwave, wave A, within the 4th wave upward correction that began on October 27 is either nearing its end or has already ended. Those two equally likely scenarios have dominated the analysis since last week.
Under Scenario #1, Wave A is in its 4th subwave and will end with a push above the November 22 high, 4580.50, the high point of the correction so far. I lean toward Scenario #1 because the subwave count lacks a 5th wave, or so it seems to my eye. Also, the rather sleepy form of the movement more closely resembles 4th waves that I’ve analyzed than it does a 5th wave, which tends to be energetic. I’ve chose this scenario for my chart labeling.
Under Scenario #2, wave A ended the November 22 high and declining wave B began. Typically, since the correction is a Zigzag, wave B will retrace the 38% to 79% of the preceding A wave.
A firm rule of Elliott Wave Theory says that a 4th wave never moves above the start of the preceding 1st wave, 4634.50 in this case. That upper limit applies both to wave A in scenario #1 and the future wave C in both scenarios.
What are the alternatives? None aside of the two scenarios described above.

[S&P 500 E-mini futures at 3:30 p.m., hourly bars, with volume]
What does Elliott wave theory say? Here are the waves that underly the analyses.
- A downtrend, wave 3{-2}, began on July 27 and is underway.
- Within wave 3{-2}, an upward correction, wave 4{-3}, began on October 27.
- Lower still, two scenarios of equal probability:
- Scenario #1:
- Within wave 4{-3}, wave A{-4} continues.
- Further down the list, wave 5{-5}, 6{-5}, 7{-5} and 8{-5} are underway and nearing completion.
- Scenario #2:
- Wave A{-4} ended on November 22 and wave B{-4} began its downward journey.
- Scenario #1:
We Are Here.
These are the waves currently in progress under my principal analysis. Each line on the list shows the wave number, with the subscript in curly brackets, the traditional degree name, the starting date, the starting price of the S&P 500 E-mini futures, and the direction of the wave.
- S&P 500 Index:
- 5{+3} Supercycle, 7/8/1932, 4.40 (up)
- 5{+2} Cycle, 12/9/1974, 60.96 (up)
- 5{+1} Primary, 3/6/2009, 666.79 (up)
- 5{0} Intermediate, 12/26/2018, 2346.58 (up)
- S&P 500 Futures and index:
- 4{-1} Minor, 1/4/2022, 4953.25 (down) (futures), 4818.62 (down) (index)
- S&P 500 Futures:
- 3{-2} Minute, 7/27/2023, 3502 (down)
- 4{-3} Minuette, 10/27/2023, 4122.25 (up)
- A{-4} Subminuette, 10/27/2023, 4122.25 (up)
Reading the chart. Price movements — waves – – in Elliott wave analysis are labeled with numbers within trending waves and letters with corrective waves. The subscripts — numbers in curly brackets — designate the wave’s degree, which, in Elliott wave analysis, means the relative position of a wave within the larger and smaller structures that make up the chart. R.N. Elliott, who in the 1930s developed the form of analysis that bears his name, viewed the chart as a complex structure of smaller waves nested within larger waves, which in turn are nested within still larger waves. In mathematics it’s called a fractal structure, where at every scale the pattern is similar to the others.
Learning and other resources. Elliott wave analysis provides context, not prophecy. As the 20th century semanticist Alfred Korzybski put it in his book Science and Sanity (1933), “The map is not the territory … The only usefulness of a map depends on similarity of structure between the empirical world and the map.” And I would add, in the ever-changing markets, we can judge that similarity of structure only after the fact.
See the menu page Analytical Methods for a rundown on where to go for information on Elliott wave analysis.
By Tim Bovee, Portland, Oregon, November 28, 2023
Disclaimer
Tim Bovee, Private Trader tracks the analysis and trades of a private trader for his own accounts. Nothing in this blog constitutes a recommendation to buy or sell stocks, options or any other financial instrument. The only purpose of this blog is to provide education and entertainment.
No trader is ever 100 percent successful in his or her trades. Trading in the stock and option markets is risky and uncertain. Each trader must make trading decisions for his or her own account, and take responsibility for the consequences.
License
All content on Tim Bovee, Private Trader by Timothy K. Bovee is licensed under a Creative Commons Attribution-ShareAlike 4.0 International License.
Based on a work at www.timbovee.com.


You must be logged in to post a comment.