Options Trades 11/16/2023: SPY GLD

Symbols traded today. 1DTE: SPY, GLD

I entered these trades on a Thursday an hour before the closing bell, and had a difficult time getting the orders filled. The solution, I suspect, will be to place the orders earlier, perhaps two hours or more before the session ends.

Normally with Iron Fly positions the reward is greater than the risk. But not with SPY this a time, a direct result of my lowering my credit ask in order to get a fill.

As it turns out, SPY and its riskier risk/reward ratio produced a small loss. GLD, with a risk/reward ratio more favorable to reward, produced a slightly larger gain. So my take-away, based on one instance, is to never enter a short Iron Fly position skewed toward the risk side of the ratio.

SPY short Iron Fly

LOT:13ENTRY DATE:11/16/2023
EXIT DATE:11/17/2023
DAYS HELD:1

Entry and Exit

METRICCREDITDEBITCHANGECHANGE %ANNUALIZED CHANGE %
Options premium$ 2.05$ 2.12$ (0.07)-3.3%-1205%
METRICENTRYEXITCHANGECHANGE %
Stock price$ 449.10$ 450.34$ (1.24)-0.3%-101%
Impllied Volatility Rate16.115.50.6-0.6
Days to expiration10

The structure of the position

STRUCTURESTRIKEODDS EXPIRE OTMDELTA
Calls
Long452.0089.0%10
Break-even449.0070.0%29.5
Short449.0051.0%49
Puts
Short449.0049.0%50
Break-even445.0068.0%31.5
Long445.0087.0%13

Risk and Reward

Per contract:
Reward205.00
Risk350.00
R/R Ratio (n:1)1.7

GLD short Iron Fly

LOT1ENTRY DATE:11/16/2023
EXIT DATE:11/17/2023
DAYS HELD:1

Entry and Exit

METRICCREDITDEBITCHANGECHANGE %ANNUALIZED CHANGE %
Options premium$ 0.82$ 0.65$ 0.1726.2%9546%
METRICENTRYEXITCHANGECHANGE %
Stock price$ 183.90$ 184.01$ (0.11)-0.1%-22%
Impllied Volatility Rate22.420.9$ (0.11)0.1
Days to expiration101.5-1.5

The structure of the position

STRUCTURESTRIKEODDS EXPIRE OTMDELTA
Calls
Long185.5085.0%14
Break-even184.8268.5%31
Short184.0052.0%48
Puts
Short184.0049.0%52
Break-even183.3268.0%32.5
Long182.5087.0%13

Risk and Reward

Per contract:
Reward82.00
Risk68.00
R/R Ratio (n:1)0.8

By Tim Bovee, Portland, Oregon, November 16, 2023

Disclaimer

Tim Bovee, Private Trader tracks the analysis and trades of a private trader for his own accounts. Nothing in this blog constitutes a recommendation to buy or sell stocks, options or any other financial instrument. The only purpose of this blog is to provide education and entertainment.

No trader is ever 100 percent successful in his or her trades. Trading in the stock and option markets is risky and uncertain. Each trader must make trading decisions for his or her own account, and take responsibility for the consequences.

License
Creative Commons License

All content on Tim Bovee, Private Trader by Timothy K. Bovee is licensed under a Creative Commons Attribution-ShareAlike 4.0 International License.

Based on a work at www.timbovee.com.

What’s the Sahm Rule Up To?

(Hint: “Up” is the keyword.)

The Sahm Rule, a sensitive and reliable recession indicator, is two-thirds of the way toward declaring us to be in a recession.

The metric was developed in 2019 by Claudia Sahm, a section chief for the Board of Governors of the Federal Reserve. In backtesting the metric has been shown to identify a recession around three months in, far shorter than the 2+ years taken by the official sreward of recession declarations, the National Bureau of Economic Research, a private non-profit.

The Sahm Rule last rose above zero in early May and continued to climb. It is now at 0.33. If it reaches 0.5, then it is declaring a recession, one that has probably been underway for three months and we just didn’t notice. The next reading will come after release of employment stats on December 8.

Here is graph of the Sahm Rule, running from June 2022 to the present.

The last time the Sahm Rule reached recession level was in April 2020, the start of the Covid-19 Recession. Before that, it reached above 0.5 in February 2008, the start of the Great Recession.

The Rule has been backtested to 1949 and closely matches what later proved to be recessions. Here’s a big-picture chart, showing the Sahm Rule from 1949 to the present, with recessions marked on the chart in gray.

The charts were produced the FRED, an excellent source of charts and data created by the St. Louis Federal Reserve Bank.

The Sahm Rule is a metric I take seriously. Elliott Wave Analysis, which is my focus as a trader, operates independently of the economy, its statistics and its great events, such as recessions. Be it a time of feast or famine, the market’s charts will move in their time-honored way, five-wave trends alternating with corrections, which normally have three waves.

But those outside statistics and events can have huge influence on the timing and the depth of Elliott waves, a fact that, perhaps, we are on our way to discovering anew.


By Tim Bovee, Portland, Oregon, November 26, 2023

Disclaimer

Tim Bovee, Private Trader tracks the analysis and trades of a private trader for his own accounts. Nothing in this blog constitutes a recommendation to buy or sell stocks, options or any other financial instrument. The only purpose of this blog is to provide education and entertainment.

No trader is ever 100 percent successful in his or her trades. Trading in the stock and option markets is risky and uncertain. Each trader must make trading decisions for his or her own account, and take responsibility for the consequences.

License
Creative Commons License

All content on Tim Bovee, Private Trader by Timothy K. Bovee is licensed under a Creative Commons Attribution-ShareAlike 4.0 International License.

Based on a work at www.timbovee.com.

Trader’s Notebook

8:15 p.m. New York time

Short Iron Fly trades on QQQ, SPY & GLD. I exited my QQQ short Iron Fly position on expiration day, a day after entry on November 15, for a 7.4% profit and have updated the trade analysis with full details.

I also entered two positions during the session, short Iron Flies on SPY and GLD, and have posted an analysis of the trades. They are 1DTE position that expire on November 17 and so will exited early in tomorrow’s session.

3:30 p.m. New York time

Half an hour before the closing bell. The S&P 500 futures traded sideways during the session, staying in the 4520s and 4510s except for two breakouts. One of the breakouts briefly peaked above the 78.6% Fibonacci retracement level and then retreated.

This morning’s principal analysis, which sees the A wave within the ongoing 4th wave upper correction as having ended with the November 15 high, and the declining B wave having begun, is unchanged. Although the chart during the session stayed consistent with the principal analysis, the alternative, which sees wave A as still being underway, remains equally likely.

I’ve updated the lower chart, showing the entirety of the upward correction so far.

12:15 p.m. New York time

What’s the Sahm Rule Up To? A reliable and sensitive recession indictor, the Federal Reserve’s Sahm Rule, is coming closer to declaring that a recession is underway, and indeed may have been underway for three months. I’ve posted a report on the subject.

9:35 a.m. New York time

What’s happening now? The S&P 500 E-mini futures traded sideways overnight, remaining below yesterday’s session high, 4541.25, and also below the 78.6% Fibonacci retracement level.

What does it mean? The nature of the overnight pattern suggests tome that the initial subwave, wave A, with the 4th-wave upward correction is complete at 4541.25, and declining wave B has begun.

Here’s a very close-up chart showing the price movements from yesterday to half an hour before the opening bell.

[S&P 500 E-mini futures at 9 a.m., 5-minute bars, with volume]

Here’s my reasoning.

First, there’s the slope of the price — what we get when we smooth out the small fluctuations and concentrate solely on the direction. That slope had a downward pitch overnight for the first time since the price reached the 78.6% retracement level and stalled.

Second, there’s the wave pattern: Waves 1 to 4 with the 3rd wave being the longest and, internally, having a five-way pattern. This is the tell-tale of a trend in Elliott Wave analysis.

The degree of those waves is indeterminate at this point — very low, for sure. The first tentative steps within a larger wave declining wave B{-4}.

So I’ve switched the labeling on the chart to what was the second scenario in yesterday’s analysis, promoting it to the status of principal analysis.

The alternative scenario, the first scenario yesterday’s analysis, is still of equal likelihood. It treats the decline from yesterday’s peak as a small retreat within the ongoing wave A{-4}.

The question will be decided, as always, by the chart. If the price moves above 4541.25, then my switch to the second scenario was premature. If the price remains below that level, then in my mind that’s further evidence that the second scenario is playing out and wave B is underway.

What are the alternatives? Unchanged from yesterday.

The upper boundary of the 4th-wave upward correction is 4541.25, the beginning of the preceding 1st wave of the same degree. If the price goes above that level, then the degrees of the entire correction get moved up, making it a correction one-degree down from the January 4, 2022 peak, 4953.25, and that level becomes the new upward limit. We’re not there yet, but it’s a possibility.

[S&P 500 E-mini futures at 3:30 p.m., 35-minute bars, with volume]

What does Elliott wave theory say? Here are the waves that underly the analyses.

Principal Analysis:

  • A downtrend, wave 3{-2}, began on July 27 and is underway.
  • Within wave 3{-2}, an upward correction, wave 4{-3}, began on October 27.
  • Wave 4{-3} internally has two possibilities, each of equal likelihood:
    • Scenario 1: Either rising wave A{-4} continues and is nearing it’s end.
    • Scenario 2: Or wave A{-4} ended on November 10 at 4425.75 and wave B{-4} began from that point.
  • Under the first scenario, wave A{-4} is its final subwave, wave 5{-5}, which in turn is in its final subwave, wave 5{-6}.
  • Under the second scenario, declining wave B{-4} has begun and is in its initial subwave, wave A{-5}.
  • The second scenario is presently my principle analysis.

We Are Here.

These are the waves currently in progress under my principal analysis. Each line on the list shows the wave number, with the subscript in curly brackets, the traditional degree name, the starting date, the starting price of the S&P 500 E-mini futures, and the direction of the wave.

  • S&P 500 Index:
  • 5{+3} Supercycle, 7/8/1932, 4.40 (up)
  • 5{+2} Cycle, 12/9/1974, 60.96 (up)
  • 5{+1} Primary, 3/6/2009, 666.79 (up)
  • 5{0} Intermediate, 12/26/2018, 2346.58 (up)
  • S&P 500 Futures and index:
  • 4{-1} Minor, 1/4/2022, 4953.25 (down) (futures), 4818.62 (down) (index)
  • S&P 500 Futures:
  • 3{-2} Minute, 7/27/2023, 3502 (down)
  • 4{-3} Minuette, 10/27/2023, 4122.25 (up)
  • B{-4} Subminuette, 11/15/2023, 4541.25 (down)

Reading the chart. Price movements — waves – – in Elliott wave analysis are labeled with numbers within trending waves and letters with corrective waves. The subscripts — numbers in curly brackets — designate the wave’s degree, which, in Elliott wave analysis, means the relative position of a wave within the larger and smaller structures that make up the chart. R.N. Elliott, who in the 1930s developed the form of analysis that bears his name, viewed the chart as a complex structure of smaller waves nested within larger waves, which in turn are nested within still larger waves. In mathematics it’s called a fractal structure, where at every scale the pattern is similar to the others.

Learning and other resources. Elliott wave analysis provides context, not prophecy. As the 20th century semanticist Alfred Korzybski put it in his book Science and Sanity (1933), “The map is not the territory … The only usefulness of a map depends on similarity of structure between the empirical world and the map.” And I would add, in the ever-changing markets, we can judge that similarity of structure only after the fact.

See the menu page Analytical Methods for a rundown on where to go for information on Elliott wave analysis.

By Tim Bovee, Portland, Oregon, November 16, 2023

Disclaimer

Tim Bovee, Private Trader tracks the analysis and trades of a private trader for his own accounts. Nothing in this blog constitutes a recommendation to buy or sell stocks, options or any other financial instrument. The only purpose of this blog is to provide education and entertainment.

No trader is ever 100 percent successful in his or her trades. Trading in the stock and option markets is risky and uncertain. Each trader must make trading decisions for his or her own account, and take responsibility for the consequences.

License
Creative Commons License

All content on Tim Bovee, Private Trader by Timothy K. Bovee is licensed under a Creative Commons Attribution-ShareAlike 4.0 International License.

Based on a work at www.timbovee.com.

Options Trades 11/15/2023: QQQ

Symbols traded today. 1DTE: QQQ

Given the drama of the last two sessions, finding a reasonably stable trade for a low volatility, little change expected was a bit difficult. I think QQQ best fits that need, among the limited possibilities.

QQQ short Iron Fly

LOT:5ENTRY DATE:11/15/2023
EXIT DATE:11/16/2023
DAYS HELD:1

Entry and Exit

METRICCREDITDEBITCHANGECHANGE %ANNUALIZED CHANGE %
Options premium$ 2.33$ 2.17$ 0.167.4%2691%
METRICENTRYEXITCHANGECHANGE %
Stock price$ 385.50$ 384.63$ 0.870.2%83%
Impllied Volatility Rate7.28.3-1.11.1
Days to expiration10

The structure of the position

STRUCTURESTRIKEODDS EXPIRE OTMDELTA
Calls
Long390.0088.0%12
Break-even388.3371.0%29
Short386.0054.0%46
Puts
Short386.0046.0%55
Break-even384.3364.0%36.5
Long382.0082.0%18

Risk and Reward

Per contract:
Reward233.00
Risk167.00
R/R Ratio (n:1)0.7

By Tim Bovee, Portland, Oregon, November 15, 2023

Disclaimer

Tim Bovee, Private Trader tracks the analysis and trades of a private trader for his own accounts. Nothing in this blog constitutes a recommendation to buy or sell stocks, options or any other financial instrument. The only purpose of this blog is to provide education and entertainment.

No trader is ever 100 percent successful in his or her trades. Trading in the stock and option markets is risky and uncertain. Each trader must make trading decisions for his or her own account, and take responsibility for the consequences.

License
Creative Commons License

All content on Tim Bovee, Private Trader by Timothy K. Bovee is licensed under a Creative Commons Attribution-ShareAlike 4.0 International License.

Based on a work at www.timbovee.com.

Trader’s Notebook

6:30 p.m. New York time

QQQ Iron Fly entry. I’ve entered a short Iron Fly position on QQQ on the day before expiration and have posted an analysis of the trade.

3:30 p.m. New York time

Half an hour before the closing bell. The S&P 500 futures kept to a $15-range during the session, breaking out on a few occasions and quickly returning. The overnight high, 4541.25, hasn’t been challenged as wave A continues to search for its end point, The A wave is the initial wave within the 4th-wave upward correction that began in late October.

I’ve updated the chart.

9:35 a.m. New York time

What’s happening now? The S&P 500 E-mini futures continued the rise that began a day earlier, albeit at a slower pace. The price spiked upward to 4541.25 with the release of the Producer Price Index, which tracks how much producers get when they sell you widgets and other stuff, and then fell back, moving slightly below the 78.6% Fibonacci retracement level.

What does it mean? “Two houses, both alike in dignity.” That’s today’s chart, as it has been all week. Straight out of Romeo and Juliet.

The 4th-wave upward correction that began on October 27 continues and is near the end of its initial subwave, wave A (first scenario). That’s the Montagues.

Or, equally likely, the 4th-wave upward correction completed its initial subwave overnight and began its declining middle subwave, wave B (second scenario). That’s the Capulets.

Otherwise, there’s nothing new to say about the chart that hasn’t already been said earlier in the week as the battle between the warring houses, or scenarios, plays out.

Top federal reserve officials will be out in full force today and Thursday, making public appearances in which they may either confirm the happy-happy interest rate talk in the financial press following the release of inflation numbers on Tuesday, or perhaps will pour cold water on the whole idea that the Fed is ready to stop raising rates.

Although the markets move to the rhythmic waves discovered by R.N. Elliott when he invented Elliott Wave Analysis in the 1930s, economic reports and Fed jaw-boning can have a influence on the time and scope of those waves. So it’s worth keeping an ear cocked the rest of the week for what the Fed officials say.

What are the alternatives? The upper boundary of the 4th-wave upward correction is 4634.50, the beginning of the preceding 1st wave of the same degree. If the price goes above that level, then the degrees of the entire correction get moved up, making it a correction one-degree down from the January 4, 2022 peak, 4953.25, and that level becomes the new upward limit. We’re not there yet, but it’s a possibility.

[S&P 500 E-mini futures at 3:30 p.m., 35-minute bars, with volume]

What does Elliott wave theory say? Here are the waves that underly the analyses.

Principal Analysis:

  • A downtrend, wave 3{-2}, began on July 27 and is underway.
  • Within wave 3{-2}, an upward correction, wave 4{-3}, began on October 27.
  • Wave 4{-3} internally has two possibilities, each of equal likelihood:
    • Scenario 1: Either rising wave A{-4} continues and is nearing it’s end.
    • Scenario 2: Or wave A{-4} ended on November 10 at 4425.75 and wave B{-4} began from that point.
  • Under the first scenario, wave A{-4} is its final subwave, wave 5{-5}, which in turn is in its final subwave, wave 5{-6}.
  • Under the second scenario, declining wave B{-4} has begun and is in its initial subwave, wave A{-5}.

We Are Here.

These are the waves currently in progress under my principal analysis. Each line on the list shows the wave number, with the subscript in curly brackets, the traditional degree name, the starting date, the starting price of the S&P 500 E-mini futures, and the direction of the wave.

  • S&P 500 Index:
  • 5{+3} Supercycle, 7/8/1932, 4.40 (up)
  • 5{+2} Cycle, 12/9/1974, 60.96 (up)
  • 5{+1} Primary, 3/6/2009, 666.79 (up)
  • 5{0} Intermediate, 12/26/2018, 2346.58 (up)
  • S&P 500 Futures and index:
  • 4{-1} Minor, 1/4/2022, 4953.25 (down) (futures), 4818.62 (down) (index)
  • S&P 500 Futures:
  • 3{-2} Minute, 7/27/2023, 4623.50 (down)
  • 4{-3} Minuette, 10/27/2023, 4122.25 (up)
  • A{-4} Subminuette, 10/27/2023, 4122.25 (up)

Reading the chart. Price movements — waves – – in Elliott wave analysis are labeled with numbers within trending waves and letters with corrective waves. The subscripts — numbers in curly brackets — designate the wave’s degree, which, in Elliott wave analysis, means the relative position of a wave within the larger and smaller structures that make up the chart. R.N. Elliott, who in the 1930s developed the form of analysis that bears his name, viewed the chart as a complex structure of smaller waves nested within larger waves, which in turn are nested within still larger waves. In mathematics it’s called a fractal structure, where at every scale the pattern is similar to the others.

Learning and other resources. Elliott wave analysis provides context, not prophecy. As the 20th century semanticist Alfred Korzybski put it in his book Science and Sanity (1933), “The map is not the territory … The only usefulness of a map depends on similarity of structure between the empirical world and the map.” And I would add, in the ever-changing markets, we can judge that similarity of structure only after the fact.

See the menu page Analytical Methods for a rundown on where to go for information on Elliott wave analysis.

By Tim Bovee, Portland, Oregon, November 15, 2023

Disclaimer

Tim Bovee, Private Trader tracks the analysis and trades of a private trader for his own accounts. Nothing in this blog constitutes a recommendation to buy or sell stocks, options or any other financial instrument. The only purpose of this blog is to provide education and entertainment.

No trader is ever 100 percent successful in his or her trades. Trading in the stock and option markets is risky and uncertain. Each trader must make trading decisions for his or her own account, and take responsibility for the consequences.

License
Creative Commons License

All content on Tim Bovee, Private Trader by Timothy K. Bovee is licensed under a Creative Commons Attribution-ShareAlike 4.0 International License.

Based on a work at www.timbovee.com.

Trader’s Notebook

3:30 p.m. New York time

Half an hour before the closing bell. The S&P 500 futures gently rose to the 78.6% Fibonacci retracement level during the session, following a dramatic pre-opening rise coinciding withe release of inflation figures for October. The session high, and indeed the high for the entire first subwave of the wave 4 upward correction that has been with us since October 27, is in the 4520s, about 30 points away from the firm upper limit required by Elliott Wave Analysis, 4553.70.

If it happens that the price does move above that upper limit, then the old analysis is tossed and a new one put in its place. The alternative analysis, should it become necessary, would raise up the degrees in relation to the January 4, 2022 high, at 4963.50.

I’ve updated the chart.

9:35 a.m. New York time

What’s happening now? The S&P 500 E-mini futures traded sideways overnight until new inflation numbers were published an hour before the opening bell, and then pushed higher by 50 points within the span of a single minute, eventually reaching into the 4490s.

What does it mean? The rise was the first significant move above the 61.8% Fibonacci retracement level as the first subwave of a 4th wave upward correction navigates its end game. The Fibonacci ladder is shown on the chart in red, and I’ve moved the chart in to focus on the rise that began on October 27.

That subwave, wave A, has been fishing for a top since yesterday, and with this rise may well have found the peak. Or perhaps not. Under the rules of Elliott Wave Analysis, a 4th wave never moves beyond the end of the preceding 1st wave. In this case, that sets an upper limit of 4553.75.

But the power of this correction has been unusual. Fourth waves have a tendency to end within the range of the 4th subwave of the preceding 3rd wave. In this case, that would put the endpoint somewhere between 4235.50 and 4430.50. And that’s on the A wave. Normally, it is the final wave of a corrective pattern, the C wave that carries the price to a new high within a 4th-wave correction. And 4th waves tend to take the form of a Flat, with three subwaves within the A wave. This A wave has five subwaves and so is taking the form of a Zigzag.

The A wave has either almost ended or is already complete. In either case, it will be followed by a declining B wave that will have three subwaves and won’t move below the start of wave A, 4122.25, and then by a rising wave C that is likely about the same length as the preceding wave A and almost always will carry the price above the end of wave A

What are the alternatives? Just the one discussed above: Is wave A finished or not? I give it equal odds either way.

[S&P 500 E-mini futures at 3:30 p.m., 30-minute bars, with volume]

What does Elliott wave theory say? Here are the waves that underly the analyses.

Principal Analysis:

  • A downtrend, wave 3{-2}, began on July 27 and is underway.
  • Within wave 3{-2}, an upward correction, wave 4{-3}, began on October 27.
  • Wave 4{-3} internally has two possibilities, each of equal likelihood:
    • Scenario 1: Either rising wave A{-4} continues and is nearing it’s end.
    • Scenario 2: Or wave A{-4} ended on November 10 at 4425.75 and wave B{-4} began from that point.
  • Under the first scenario, wave A{-4} is its final subwave, wave 5{-5}, which in turn is in its final subwave, wave 5{-6}.
  • Under the second scenario, declining wave B{-4} has begun and is in its initial subwave, wave A{-5}.

We Are Here.

These are the waves currently in progress under my principal analysis. Each line on the list shows the wave number, with the subscript in curly brackets, the traditional degree name, the starting date, the starting price of the S&P 500 E-mini futures, and the direction of the wave.

  • S&P 500 Index:
  • 5{+3} Supercycle, 7/8/1932, 4.40 (up)
  • 5{+2} Cycle, 12/9/1974, 60.96 (up)
  • 5{+1} Primary, 3/6/2009, 666.79 (up)
  • 5{0} Intermediate, 12/26/2018, 2346.58 (up)
  • S&P 500 Futures and index:
  • 4{-1} Minor, 1/4/2022, 4953.25 (down) (futures), 4818.62 (down) (index)
  • S&P 500 Futures:
  • 3{-2} Minute, 7/27/2023, 3502 (down)
  • 4{-3} Minuette, 10/27/2023, 4122.25 (up)
  • A{-4} Subminuette, 10/27/2023, 4122.25 (up)

Reading the chart. Price movements — waves – – in Elliott wave analysis are labeled with numbers within trending waves and letters with corrective waves. The subscripts — numbers in curly brackets — designate the wave’s degree, which, in Elliott wave analysis, means the relative position of a wave within the larger and smaller structures that make up the chart. R.N. Elliott, who in the 1930s developed the form of analysis that bears his name, viewed the chart as a complex structure of smaller waves nested within larger waves, which in turn are nested within still larger waves. In mathematics it’s called a fractal structure, where at every scale the pattern is similar to the others.

Learning and other resources. Elliott wave analysis provides context, not prophecy. As the 20th century semanticist Alfred Korzybski put it in his book Science and Sanity (1933), “The map is not the territory … The only usefulness of a map depends on similarity of structure between the empirical world and the map.” And I would add, in the ever-changing markets, we can judge that similarity of structure only after the fact.

See the menu page Analytical Methods for a rundown on where to go for information on Elliott wave analysis.

By Tim Bovee, Portland, Oregon, November 14, 2023

Disclaimer

Tim Bovee, Private Trader tracks the analysis and trades of a private trader for his own accounts. Nothing in this blog constitutes a recommendation to buy or sell stocks, options or any other financial instrument. The only purpose of this blog is to provide education and entertainment.

No trader is ever 100 percent successful in his or her trades. Trading in the stock and option markets is risky and uncertain. Each trader must make trading decisions for his or her own account, and take responsibility for the consequences.

License
Creative Commons License

All content on Tim Bovee, Private Trader by Timothy K. Bovee is licensed under a Creative Commons Attribution-ShareAlike 4.0 International License.

Based on a work at www.timbovee.com.

Trader’s Notebook

3:30 p.m.. New York time

Half an hour before the closing bell. The S&P 500 futures moved slightly higher during the session, reaching 4436.75, and continued to keep the 61.8% Fibonacci retracement level in a firm embrace as the optimists and the pessimists battle over the future course of the price.

I’ve updated the chart, keeping the wave labeling as it was this morning, showing the first subwave, wave A, nearing completion within the 4th wave upward correction that began in late October. It’s equally likely that the session high marked the end of wave A, and wave B is now underway.

9:35 a.m. New York time

What’s happening now? The S&P 500 E-mini futures stayed within a narrow range after trading resumed overnight, remaining below the 61.8% Fibonacci retracement level.

What does it mean?

The 4th wave upward correction that began on October 27 continues and is near the end of its first subwave, an A wave, or perhaps wave A ended at 4425.75, the November 10 high.

A 4th wave typically ends within the 4th subwave of the preceding 3rd wave. This A wave has already arrived at the upper boundary, which coincides with the 61.8% Fibonacci retracement level.

Here is the main question posed by the chart: Is wave A complete or not? If it is complete, then declining wave B is underway. If its not complete, then wave A still has some upside left.

A secondary question asks:, What form is the 4th wave correction taking? The preceding 2nd wave took the form of a Zigzag, with five subwaves within the A wave. According to the tendency toward alternation, the 4th wave should be a Flat, with three subwaves within the A wave.

The A wave so far can be counted as having three subwaves, but that first subwave is extraordinarily long in comparison with the two subwaves that have followed. It’s not unheard of for waves to be somewhat sloppy in their construction, especially at a turning point, but it’s something to take note of.

In any case, when wave A is over, wave B begins, and the B wave always retraces 90% or more of the preceding A wave, and usually retraces 100% to 138%. So the correction has some serious downside ahead of it.

Changes in the analysis. Over the weekend I continued to analyze the chart, refining the rather hurried reworking of the Elliott Wave analysis I had done late in the session on Friday.

The main revision was to raise the degrees by two levels, so that degree {-5} became degree {-3}, and degree {-6} became degree {-4}. These are the highest degrees possible that are consistent with my long-standing {-2} degree label for the July 27 peak. The higher degrees also are more in line with the same degrees in earlier movements.

Otherwise, no changes. The relationship between subwaves of the ongoing downtrend, wave 3{-2}, remain unchanged from Friday’s analysis.

What are the alternatives? None at present, beyond the main question posed by this chart: Is wave A complete or not?

[S&P 500 E-mini futures at 3:30 p.m., 210-minute bars, with volume]

What does Elliott wave theory say? Here are the waves that underly the analyses.

Principal Analysis:

  • A downtrend, wave 3{-2}, began on July 27 and is underway.
  • Within wave 3{-2}, an upward correction, wave 4{-3}, began on October 27.
  • Wave 4{-3} internally has two possibilities, each of equal likelihood:
    • Either rising wave A{-4} continues and is nearing it’s end.
    • Or wave A{-4} ended on November 10 at 4425.75 and wave B{-4} began from that point.

We Are Here.

These are the waves currently in progress under my principal analysis. Each line on the list shows the wave number, with the subscript in curly brackets, the traditional degree name, the starting date, the starting price of the S&P 500 E-mini futures, and the direction of the wave.

  • S&P 500 Index:
  • 5{+3} Supercycle, 7/8/1932, 4.40 (up)
  • 5{+2} Cycle, 12/9/1974, 60.96 (up)
  • 5{+1} Primary, 3/6/2009, 666.79 (up)
  • 5{0} Intermediate, 12/26/2018, 2346.58 (up)
  • S&P 500 Futures and index:
  • 4{-1} Minor, 1/4/2022, 4953.25 (down) (futures), 4818.62 (down) (index)
  • S&P 500 Futures:
  • 3{-2} Minute, 7/27/2023, 4634.50 (down)
  • 4{-3} Minuette, 10/27/2023, 4122.25 (up)
  • A{-4} Subminuette, 10/27/2023, 4122.25 (up)

Reading the chart. Price movements — waves – – in Elliott wave analysis are labeled with numbers within trending waves and letters with corrective waves. The subscripts — numbers in curly brackets — designate the wave’s degree, which, in Elliott wave analysis, means the relative position of a wave within the larger and smaller structures that make up the chart. R.N. Elliott, who in the 1930s developed the form of analysis that bears his name, viewed the chart as a complex structure of smaller waves nested within larger waves, which in turn are nested within still larger waves. In mathematics it’s called a fractal structure, where at every scale the pattern is similar to the others.

Learning and other resources. Elliott wave analysis provides context, not prophecy. As the 20th century semanticist Alfred Korzybski put it in his book Science and Sanity (1933), “The map is not the territory … The only usefulness of a map depends on similarity of structure between the empirical world and the map.” And I would add, in the ever-changing markets, we can judge that similarity of structure only after the fact.

See the menu page Analytical Methods for a rundown on where to go for information on Elliott wave analysis.

By Tim Bovee, Portland, Oregon, November 13, 2023

Disclaimer

Tim Bovee, Private Trader tracks the analysis and trades of a private trader for his own accounts. Nothing in this blog constitutes a recommendation to buy or sell stocks, options or any other financial instrument. The only purpose of this blog is to provide education and entertainment.

No trader is ever 100 percent successful in his or her trades. Trading in the stock and option markets is risky and uncertain. Each trader must make trading decisions for his or her own account, and take responsibility for the consequences.

License
Creative Commons License

All content on Tim Bovee, Private Trader by Timothy K. Bovee is licensed under a Creative Commons Attribution-ShareAlike 4.0 International License.

Based on a work at www.timbovee.com.

Options Trades 11/10/2023: IWM

Symbols traded today: IWM (10DTE)

I explored BMY, MCD and DUK as potential bear plays and couldn’t get any to work, based on either the Elliott wave status or the inability to get a reasonable return for the risk. I finally settled for one of my regulars…

IWM short Bear Call Vertical Spread

I’ve entered a position on IWM, 10 days to expiration, based on Elliott Wave analysis that shows it entering a downtrending 5th wave.

LOT:3ENTRY DATE:11/10/2023

Entry and Exit

CREDIT (ENTRY)
Options premium$ 1.10
ENTRY
Stock price$ 169.21
Implied Volatility Rate24.6
Days to expiration10

The structure of the position

STRUCTURESTRIKEODDS EXPIRE OTMDELTA
Calls
Long176.0090.0%10
Break-even172.0676.0%24
Short171.0062.0%38

Risk and Reward

Per contract:
Reward110.00
Risk390.00
R/R Ratio (n:1)3.5

By Tim Bovee, Portland, Oregon, November 10, 2023

Disclaimer

Tim Bovee, Private Trader tracks the analysis and trades of a private trader for his own accounts. Nothing in this blog constitutes a recommendation to buy or sell stocks, options or any other financial instrument. The only purpose of this blog is to provide education and entertainment.

No trader is ever 100 percent successful in his or her trades. Trading in the stock and option markets is risky and uncertain. Each trader must make trading decisions for his or her own account, and take responsibility for the consequences.

License
Creative Commons License

All content on Tim Bovee, Private Trader by Timothy K. Bovee is licensed under a Creative Commons Attribution-ShareAlike 4.0 International License.

Based on a work at www.timbovee.com.

Trader’s Notebook

3:30 p.m. New York time

Half an hour before the closing bell. The S&P 500 futures, the S&P 500 index and the S&P 500 exchange traded fund, SPY, all moved above the mid-October that was the beginning point of a 1st wave. The rise above that level was labeled as a 2nd wave, and in moving above the 1st-wave starting point, wave 2 broke a firm rule of Elliott Wave Theory: No 2nd wave can move beyond the start of the preceding 1st wave. If it does, then something else is going on.

As the semanticist Alfred Korzybski put it in his book Science and Sanity (1933), “The map is not the territory … The only usefulness of a map depends on similarity of structure between the empirical world and the map.”

When the map no longer matches the territory, then the map must change. When the analysis no longer matches the chart, it’s back to the Elliott Wave drawing board.

Which is how I’ve spent my time since about 2 p.m. New York time today.

The following discussion will make use of wave numbers and their degree subscripts (the number in curly brackets). The degree subscript shows the number of degrees removed from what classical Elliott Wave Theory calls the Intermediate degree. Since the numbers are negative on this chart, we know that the waves are subwaves of wave 4{0}, which began in January 2022.

Under the new chart: Rising wave 4{-5} is underway and is in its first subwave, also rising, wave A{-6}.

Wave 4{-5} replaces what had been, under the former analysis, wave 2{-8} and its 1st subwave, wave A{-9}.

The Elliott Wave Theory rule for 4th waves is that they never move beyond the endpoint of the preceding 1st wave of the same degree. Wave 1{-5}.

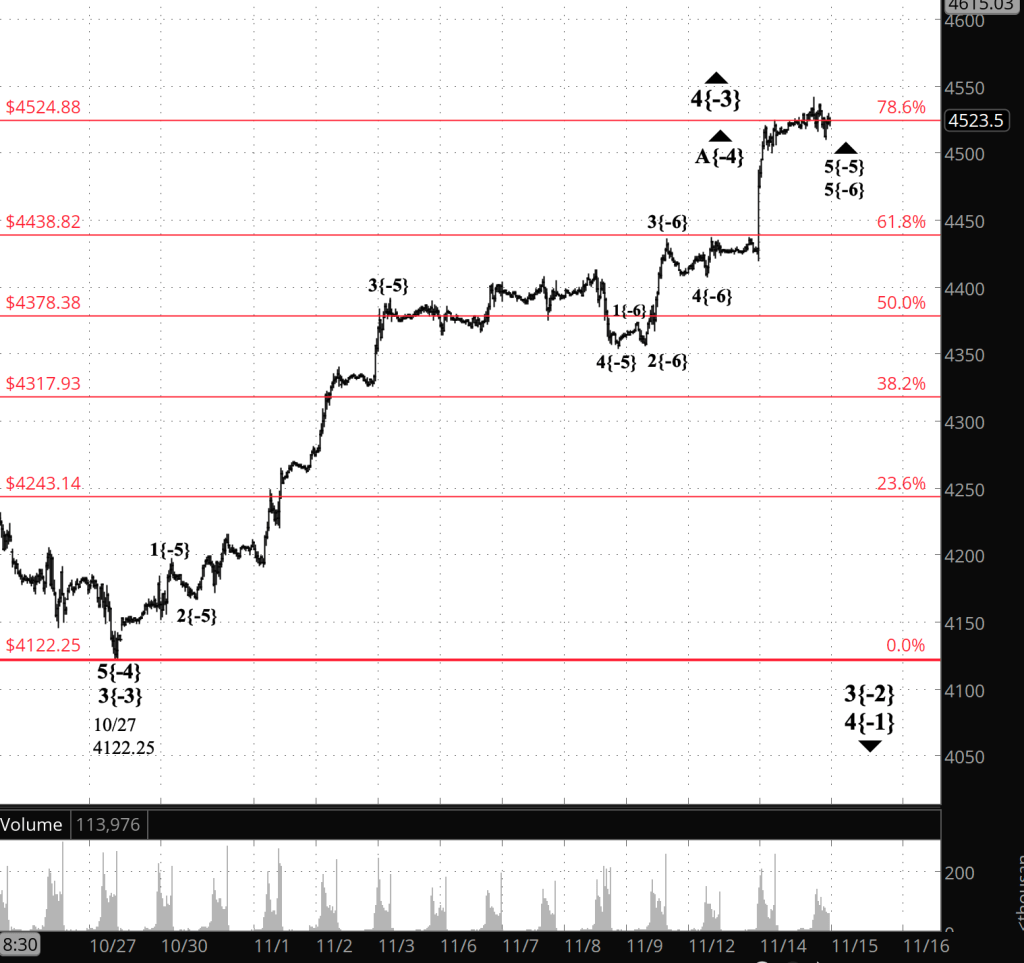
Here a chart showing the new analysis. I’ve retained this morning’s old analysis below for comparison. This is definitely a work in progress, and I’ll be working further on the analysis over the weekend.

[S&P 500 E-mini futures after the closing bell., 210-minute bars, with volume]

One thing that is likely to happen with the new analysis is that the degree labels will be changed. As always, the degree of wave is more a guess than a certainty.

2 p.m. New York time

Entered IWM 10-day position. I’ve entered a short Bear Call Vertical Spread on IWM, 10 days to expiration, based on Elliott wave analysis, and have posted an analysis of the trade.

11:40 a.m. New York time

A look ahead to next week. Two market-moving economic reports will be released next week, The Consumer Price Index on Tuesday and the Producer Price Index on Wednesday, each at 8:30 a.m., an hour before the U.S. markets open. I’ll be avoiding entry of any 1DTE (one day to expiration) trades the day before each report is published. That means no 1DTE in-trades on Monday and Tuesday.

My longer positions, such as the 9DTEs, will be trades as usual.

11:15 a.m. New York time

Exited SPY, XLE 1-day positions. I’ve exited my short Iron Fly positions on SPY and XLE, on expiration day, and have updated their trade analyses with results. Both were profitable.

9:35 a.m. New York time

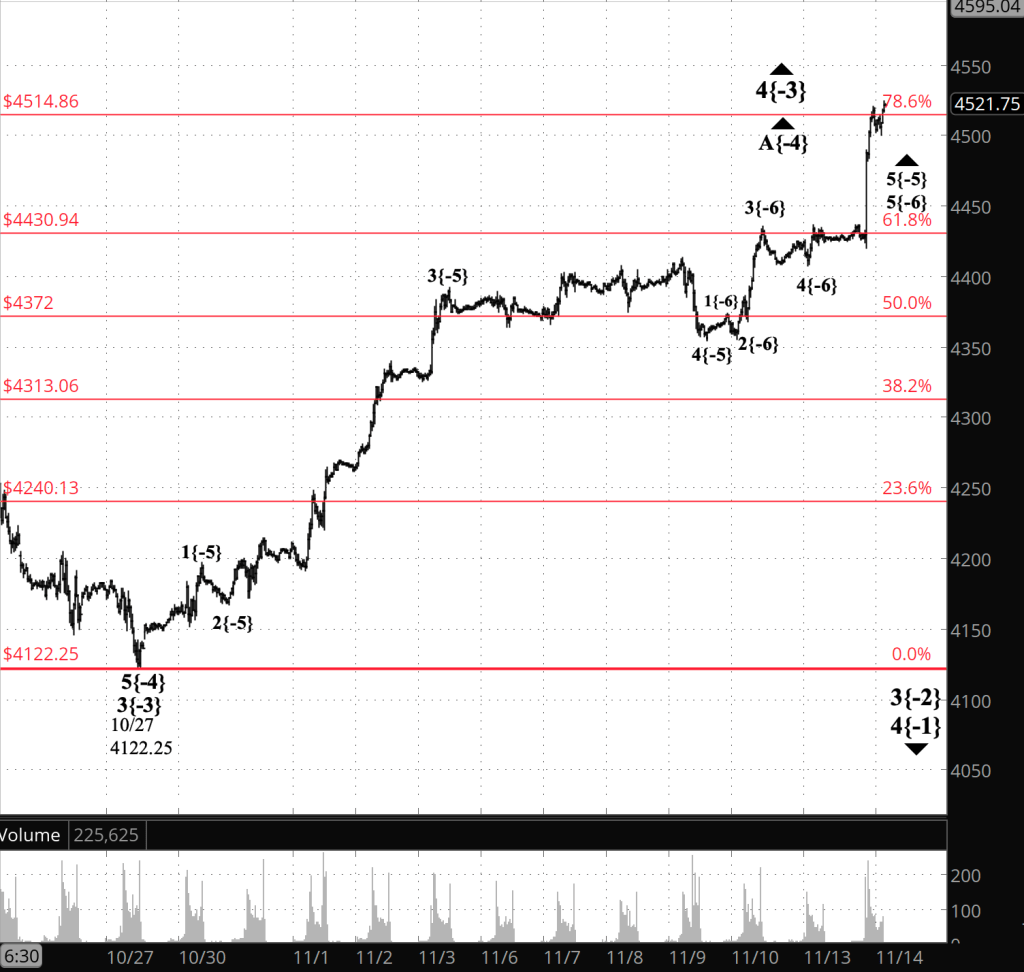
What’s happening now? The S&P 500 E-mini futures traded sideways overnight, staying close to the 78.6% Fibonacci retracement level, which is in the 4360s . The Fibonacci ladder is shown on the chart in red. As the opening bell approached, the price rose into the 4380s.

What does it mean? If the price breaks sharply below that Fibonacci level, then it becomes more likely that the first subwave, rising wave A, of the 2nd-wave upward correction that began in late October is complete, and the second subwave, declining wave B, has begun.

If the price rises noticeably above the Fibonacci level, then the likelihood increases that wave A is not yet complete and will almost certainly move above the correction high so far, 4413.

A wave B tends to retrace 38% to 79% of the preceding A wave. If the B wave is truly underway then typically it would end more or less between 4302 and 4182. That’s a tendency, not a rule.

If the A wave is truly still underway, under a rule of Elliott Wave Theory a 2nd wave cannot move beyond starting point of the preceding 1st wave. That limits the A wave on the upside to 4430.50 and below.

What are the alternatives? Different day, same verse. Under the principal analysis, the whole degree structure on the chart may be larger than the underlying reality. Elliott Wave Theory contains no robust way of determining which degree a wave belongs to. So the wave I’ve labeled as wave 2{-8} may well be larger or smaller than degree {-8}. The only indication is to compare the size of the wave in question to the size of prior waves in the same position tend to be proportional to other waves in the same position. Sussing that out will be a project for the weekend.

[Outdated. See the new chart above. S&P 500 E-mini futures at 9:35 a.m., hourly bars, with volume]

What does Elliott wave theory say? Here are the waves that underly this afternoon’s analyses.

  • A downtrend, wave 3{-2}, began on July 27 and is underway.
  • Within wave 3{-2}, an upward correction, wave 4{-5}, began on October 27 and is in its initial subwave, wave A{-6}.

We Are Here.

These are the waves currently in progress under my principal analysis. Each line on the list shows the wave number, with the subscript in curly brackets, the traditional degree name, the starting date, the starting price of the S&P 500 E-mini futures, and the direction of the wave.

  • S&P 500 Index:
  • 5{+3} Supercycle, 7/8/1932, 4.40 (up)
  • 5{+2} Cycle, 12/9/1974, 60.96 (up)
  • 5{+1} Primary, 3/6/2009, 666.79 (up)
  • 5{0} Intermediate, 12/26/2018, 2346.58 (up)
  • S&P 500 Futures and index:
  • 4{-1} Minor, 1/4/2022, 4953.25 (down) (futures), 4818.62 (down) (index)
  • S&P 500 Futures:
  • 4{-5} Minute, 10/27/2023, 4122.25 (up)

Reading the chart. Price movements — waves – – in Elliott wave analysis are labeled with numbers within trending waves and letters with corrective waves. The subscripts — numbers in curly brackets — designate the wave’s degree, which, in Elliott wave analysis, means the relative position of a wave within the larger and smaller structures that make up the chart. R.N. Elliott, who in the 1930s developed the form of analysis that bears his name, viewed the chart as a complex structure of smaller waves nested within larger waves, which in turn are nested within still larger waves. In mathematics it’s called a fractal structure, where at every scale the pattern is similar to the others.

Learning and other resources. Elliott wave analysis provides context, not prophecy. As the 20th century semanticist Alfred Korzybski put it in his book Science and Sanity (1933), “The map is not the territory … The only usefulness of a map depends on similarity of structure between the empirical world and the map.” And I would add, in the ever-changing markets, we can judge that similarity of structure only after the fact.

See the menu page Analytical Methods for a rundown on where to go for information on Elliott wave analysis.

By Tim Bovee, Portland, Oregon, November 10, 2023

Disclaimer

Tim Bovee, Private Trader tracks the analysis and trades of a private trader for his own accounts. Nothing in this blog constitutes a recommendation to buy or sell stocks, options or any other financial instrument. The only purpose of this blog is to provide education and entertainment.

No trader is ever 100 percent successful in his or her trades. Trading in the stock and option markets is risky and uncertain. Each trader must make trading decisions for his or her own account, and take responsibility for the consequences.

License
Creative Commons License

All content on Tim Bovee, Private Trader by Timothy K. Bovee is licensed under a Creative Commons Attribution-ShareAlike 4.0 International License.

Based on a work at www.timbovee.com.

Options Trades 11/9/2023: SPY XLE

Symbols traded today: SPY, XLE

SPY Entry short Iron Fly

LOT:12ENTRY DATE:11/9/2023
EXIT DATE:11/10/2023

Entry and Exit

METRICCREDITDEBITCHANGECHANGE %
Options premium$ 2.03$ 1.84$ 0.1910.3%
METRICENTRYEXITCHANGECHANGE %
Stock price$ 435.07$ 435.59$ (0.52)$0.52
Impllied Volatility Rate21.616.74.9-4.9
Days to expiration10

The structure of the position

STRUCTURESTRIKEODDS EXPIRE OTMDELTA
Calls
Long438.0082.0%18
Break-even437.0366.5%34.5
Short435.0051.0%51
Puts
Short435.0050.0%49
Break-even434.0364.5%35.5
Long432.0079.0%22

Risk and Reward

Per contract:
Reward203.00
Risk97.00
R/R Ratio (n:1)0.5

XLE Entry short Iron Fly

LOT:1ENTRY DATE:11/9/2023
EXIT DATE:11/10/2023

Entry and Exit

METRICCREDITDEBITCHANGECHANGE %
Options premium$ 0.80$ 0.73$ 0.079.6%
METRICENTRYEXITCHANGECHANGE %
Stock price$ 82.55$ 83.43$ (0.88)$0.88
Impllied Volatility Rate18.416.71.7-1.7
Days to expiration10

The structure of the position

STRUCTURESTRIKEODDS EXPIRE OTMDELTA
Calls
Long84.5092.0%5
Break-even83.8079.0%20
Short83.0066.0%35
Puts
Short83.0034.0%66
Break-even81.8064.5%37
Long81.0095.0%8

Risk and Reward

Per contract:
Reward80.00
Risk95.00
R/R Ratio (n:1)1.2

By Tim Bovee, Portland, Oregon, November 9, 2023

Disclaimer

Tim Bovee, Private Trader tracks the analysis and trades of a private trader for his own accounts. Nothing in this blog constitutes a recommendation to buy or sell stocks, options or any other financial instrument. The only purpose of this blog is to provide education and entertainment.

No trader is ever 100 percent successful in his or her trades. Trading in the stock and option markets is risky and uncertain. Each trader must make trading decisions for his or her own account, and take responsibility for the consequences.

License
Creative Commons License

All content on Tim Bovee, Private Trader by Timothy K. Bovee is licensed under a Creative Commons Attribution-ShareAlike 4.0 International License.

Based on a work at www.timbovee.com.