3:30 p.m. New York time
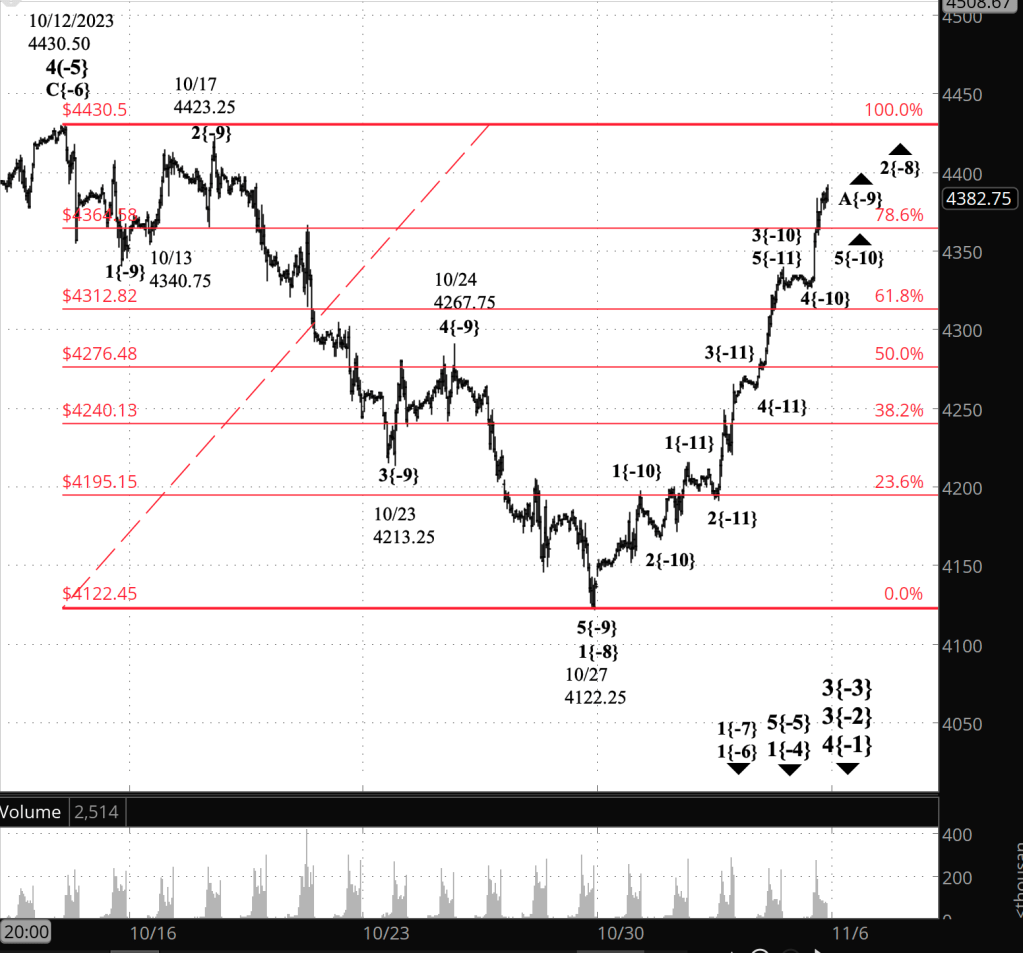
Half an hour before the closing bell. The S&P 500 futures fell during the session, reaching below the 78.6% Fibonacci retracement level as the closing bell approached.
The breach of that support point persuaded me to relabel the chart: The first subwave, wave A, within the present 2nd-wave upward correction ended today at 4413, and declining wave B has begun.
Having done that, the two scenarios of almost equal likelihood are still in play. The price could reverse to the upside and return to the level of today’s high. That could mean that wave A has not yet ended.
I’ve updated the chart and am awaiting further indications that the B wave is truly underway.
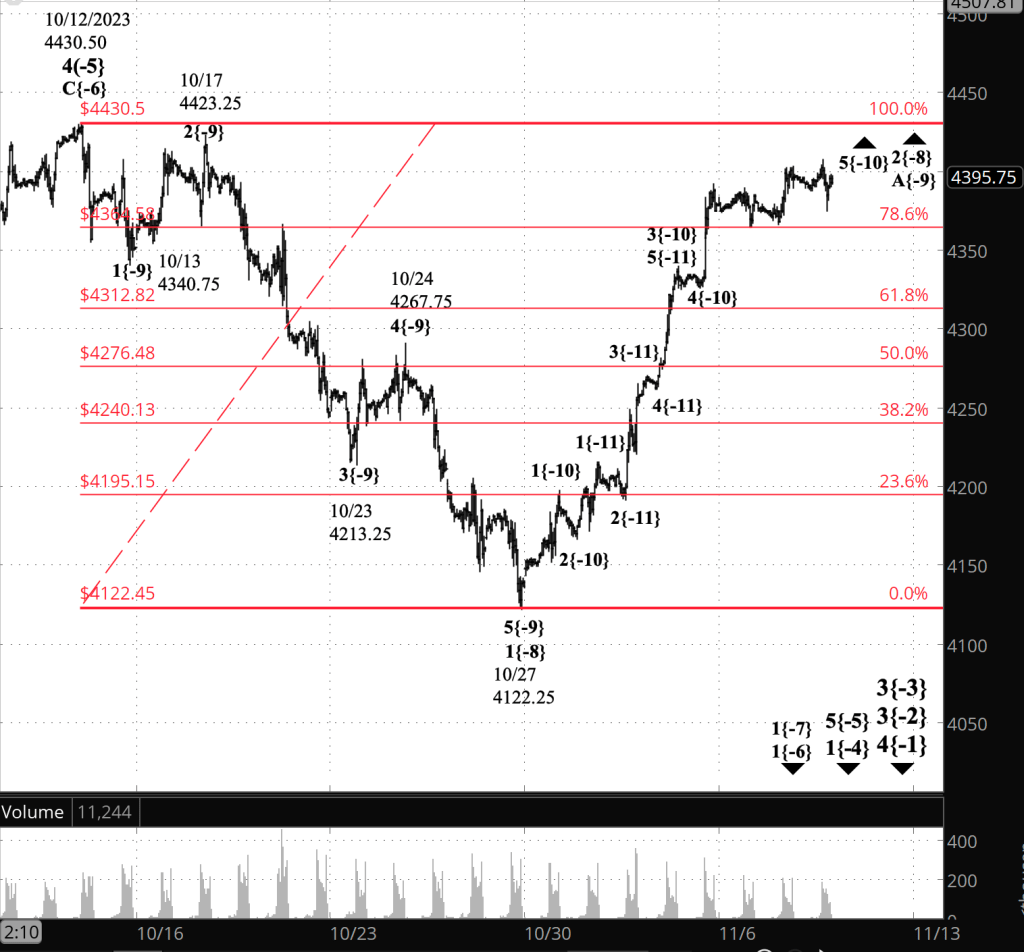
3:15 p.m. New York time
Entry SPY, XLE. I’ve posted an analysis of today’s two trades, short Iron Fly positions on SPY and XLE, each expiring the next day.
2:50 p.m. New York time
Exited short Bear Call Vertical Spread IWM. I’ve exited my position on IWM for a profit and have updated yesterday’s options trade analysis with results.
11:55 a.m. New York time
Exited short Iron Fly position on QQQ. I’ve updated yesterday’s options trades post with results of my short Iron Fly position on QQQ, entered one day before expiration and exited on expiration day for a profit.
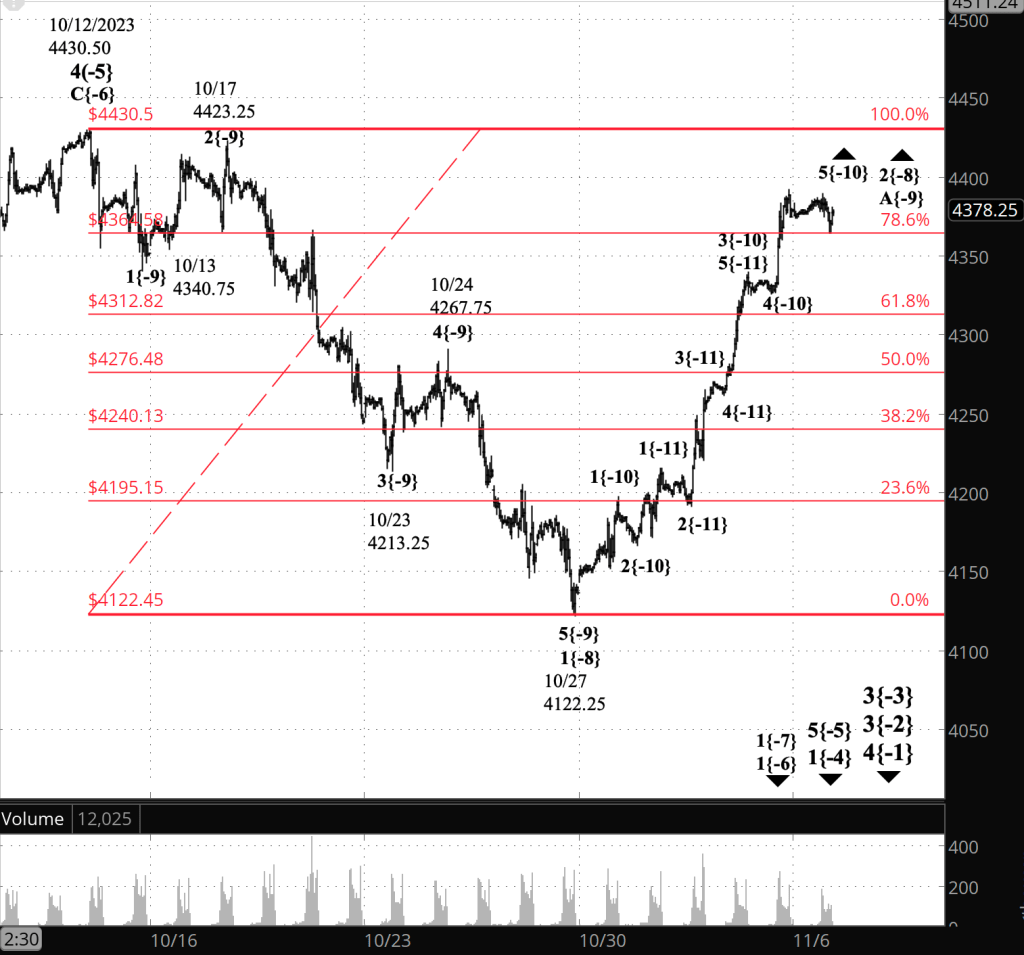
9:35 a.m. New York time
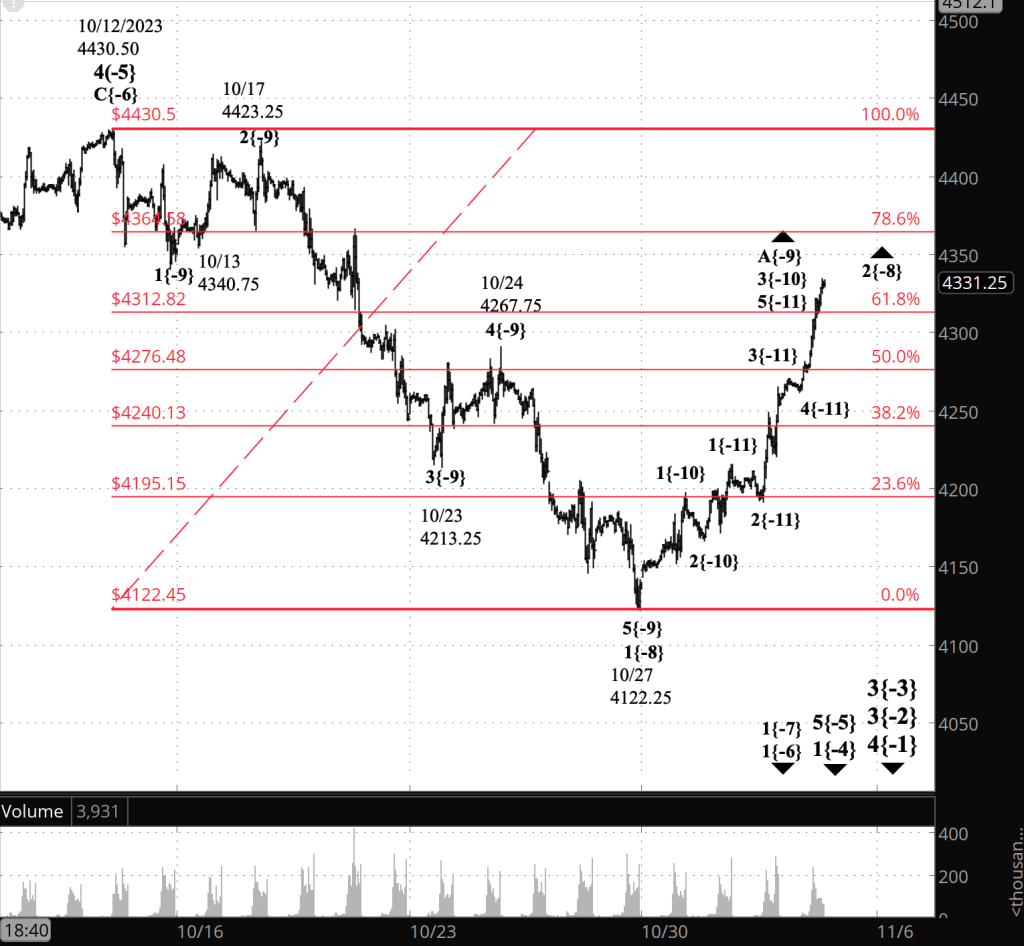
What’s happening now? The S&P 500 E-mini futures rose overnight, reaching 4413, and then pulled back slightly at the opening bell.
What does it mean? The rise brought the first subwave of a 2nd wave upward correction to yet another peak. The correction began on October 22 from 4122.25.
The first subwave is an A wave, and will be followed by a declining B wave and then a rising C wave, which will complete the corrective pattern.
The 2nd wave was, of course, preceded by a downtrending 1st wave. The new high brings the A wave to fewer than 20 points of the start the 1st have. That’s important because one of the few firm rules of Elliott Wave Theory says that a 2nd wave never moves above the start of the 1st wave that came before it. See the “Reading the Chart” section below for more on the subject.
This 2nd wave, is cutting it very close. The 1st wave began from 4430.50.
If the 2nd wave does in fact move above that level, then the analysis doesn’t match the reality on the chart. The 2nd wave isn’t really a second wave. Something else is going on.
For what follows, I’ll need to use the degree indicators, which place each wave in relation to other waves within the complex fractal structure of the chart. The degree is labeled by a subscript, in curly brackets, that shows its relationship to a larger wave, called the Intermediate degree by R.N. Elliott, the developer of Elliott Wave Theory. The Intermediate wave is wave {0}. A degree of {-3} would be three degrees smaller than wave {0}.
Tentatively, the most likely scenario, if 4430.50 should be breached, goes like this:
- The 1st wave began from 4566 on September 14, presently labeled as the start of wave 3{-3}.
- The low on October 27, presently labeled the end of wave 1{-8} and the start of wave 2{-8}, is the end of wave 3{-4}.
- The subsequent rise, rather than being a 2nd wave, is a 4th wave, wave 4{-4}
Under the rules of Elliott Wave Analysis, a 4th wave can move beyond the start of the preceding 1st wave — no rules broken, no harm, no foul.
But that’s all hypothetical. The A wave for now remains below the start of the preceding 1st wave, then the present principal analysis is intact. The 2nd wave is underway and is in its A subwave.
What are the alternatives? Under the principal analysis, the whole degree structure on the chart may be larger than the underlying reality. I’ll be giving that a closer look, in light of the 2nd wave’s close approach to the start of the 1st wave, and may renumber the subwaves.
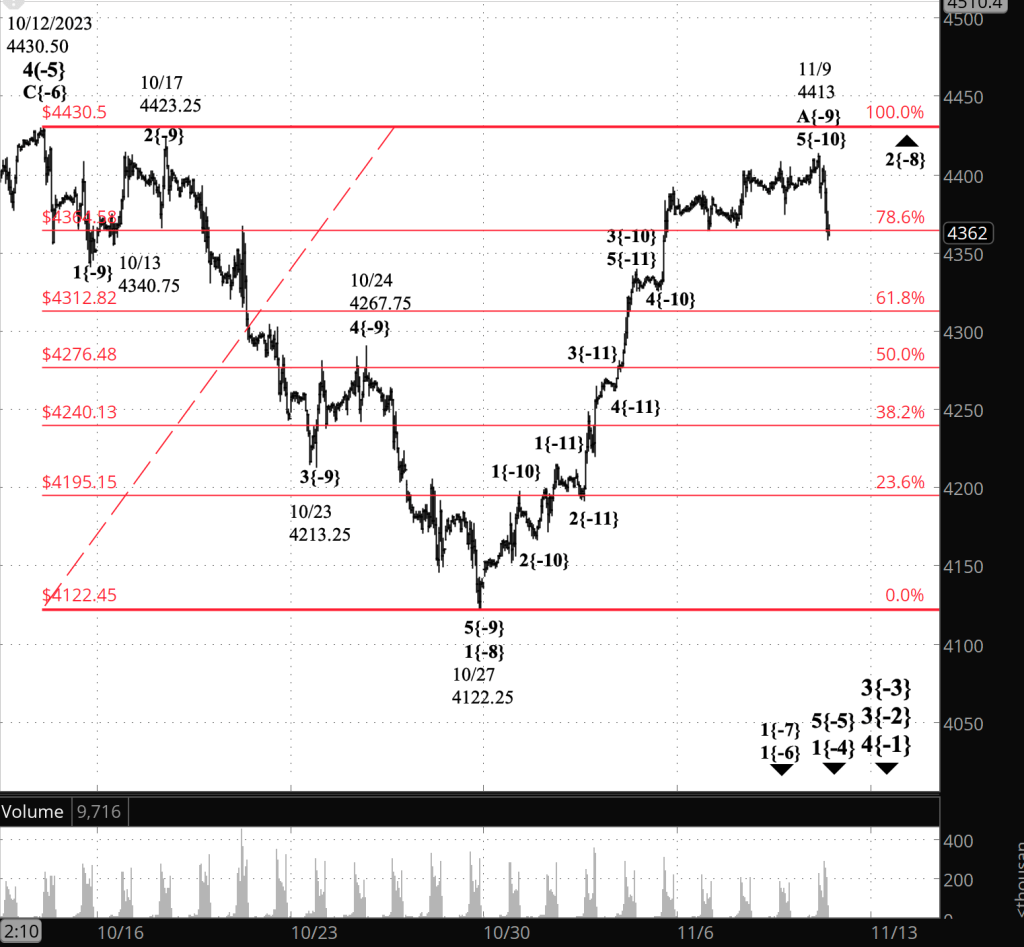
[S&P 500 E-mini futures at 3:30 p.m., 50-minute bars, with volume]
What does Elliott wave theory say? Here are the waves that underly the analyses.
Principal Analysis:
- A downtrend, wave 3{-2}, began on July 27 and is underway.
- Within wave 3{-2}, a smaller downtrend, wave 3{-3}, began on September 14 and is in its initial subwave, wave 1{-4}.
- With wave 1{-4}, subwave 5{-5}, an downtrend, is underway, having begun on October 12.
- Wave 5{-5} is in its first subwave, wave 1{-6}.
- Within waves 1{-6} and 1{-7} are underway.
- Wave 1{-7} is in its 2nd subwave, an upward correction, wave 2{-8}.
- Internally, wave 2{-8} is in its first subwave, rising wave A{-9}.
- Within wave 2{-8} I see two possibilities of equal likelihood:
- Wave A{-9} continues and is its 5th and final subwave.
- Wave A{-9} ended on November 7 at 4403.25 and wave B{-9} began.
Alternative Analysis
- The upward correction, wave 2{-8}, is a higher degree or a lower degree than is shown on the chart.
We Are Here.
These are the waves currently in progress under my principal analysis. Each line on the list shows the wave number, with the subscript in curly brackets, the traditional degree name, the starting date, the starting price of the S&P 500 E-mini futures, and the direction of the wave.
- S&P 500 Index:
- 5{+3} Supercycle, 7/8/1932, 4.40 (up)
- 5{+2} Cycle, 12/9/1974, 60.96 (up)
- 5{+1} Primary, 3/6/2009, 666.79 (up)
- 5{0} Intermediate, 12/26/2018, 2346.58 (up)
- S&P 500 Futures and index:
- 4{-1} Minor, 1/4/2022, 4953.25 (down) (futures), 4818.62 (down) (index)
- S&P 500 Futures:
- 3{-2} Minute, 7/27/2023, 3502 (down)
Reading the chart. Price movements — waves – – in Elliott wave analysis are labeled with numbers within trending waves and letters with corrective waves. The subscripts — numbers in curly brackets — designate the wave’s degree, which, in Elliott wave analysis, means the relative position of a wave within the larger and smaller structures that make up the chart. R.N. Elliott, who in the 1930s developed the form of analysis that bears his name, viewed the chart as a complex structure of smaller waves nested within larger waves, which in turn are nested within still larger waves. In mathematics it’s called a fractal structure, where at every scale the pattern is similar to the others.
Learning and other resources. Elliott wave analysis provides context, not prophecy. As the 20th century semanticist Alfred Korzybski put it in his book Science and Sanity (1933), “The map is not the territory … The only usefulness of a map depends on similarity of structure between the empirical world and the map.” And I would add, in the ever-changing markets, we can judge that similarity of structure only after the fact.
See the menu page Analytical Methods for a rundown on where to go for information on Elliott wave analysis.
By Tim Bovee, Portland, Oregon, November 9, 2023
Disclaimer
Tim Bovee, Private Trader tracks the analysis and trades of a private trader for his own accounts. Nothing in this blog constitutes a recommendation to buy or sell stocks, options or any other financial instrument. The only purpose of this blog is to provide education and entertainment.
No trader is ever 100 percent successful in his or her trades. Trading in the stock and option markets is risky and uncertain. Each trader must make trading decisions for his or her own account, and take responsibility for the consequences.
License
All content on Tim Bovee, Private Trader by Timothy K. Bovee is licensed under a Creative Commons Attribution-ShareAlike 4.0 International License.
Based on a work at www.timbovee.com.

You must be logged in to post a comment.