SPY Trade

S&P 500 ETF Trust (SPY)

Lot 2023-10

Update 11/2/2023: I exited my short bull put vertical spread on November 2, 2023, eight days before expiration, for a $0.45 debit per contract/share, a profit before fees of $83 per contract. Shares were trading at $426.73, up $7.46 from the entry level.

The Implied Volatility Rank at exit was 27.3%, down 9.4 points from the entry level.

I exited on the first day after entry because the position reached at least 50% of maximum potential profit, my normal exit point for options positions.

Shares rose by 1.8% over one day for a +649% annual rate. The options position produced a 184.4% return for a +67,322% annual rate.


I have entered a bull put vertical spread on SPY, using options that trade for the last time nine days hence, on November 10. The premium is a $1.28 credit per contract share and the stock at the time of entry was priced at $419.27.

The Implied Volatility Ratio stood at 36.8%.

Premium:$1.28Expire OTM
SPY-bull put spreadStrikeOddsDelta
Puts
Long411.0079.0%20
Break-even417.2872.5%27
Short416.0066.0%34

The premium is 51.2% of the width of the short/long spread. The profit zone covers a 0.5% move to the downside and an unlimited move to the upside.

The risk/reward ratio is 2.9 :1, with maximum risk of $372 and maximum reward of $128 per contract.

By Tim Bovee, Portland, Oregon, November 1, 2023

Disclaimer

Tim Bovee, Private Trader tracks the analysis and trades of a private trader for his own accounts. Nothing in this blog constitutes a recommendation to buy or sell stocks, options or any other financial instrument. The only purpose of this blog is to provide education and entertainment.

No trader is ever 100 percent successful in his or her trades. Trading in the stock and option markets is risky and uncertain. Each trader must make trading decisions for his or her own account, and take responsibility for the consequences.

License
Creative Commons License

All content on Tim Bovee, Private Trader by Timothy K. Bovee is licensed under a Creative Commons Attribution-ShareAlike 4.0 International License.

Based on a work at www.timbovee.com.

Trader’s Notebook

3:30 p.m. New York time

Half an hour before the closing bell. The S&P 500 futures rose during the session, reaching into the 4260s so far as it picked up the pace after the Federal Open Market Committee issued a statement holding the Fed Funds Rate steady at 5-1/4% to 5-1/2%.

The rise carried the price top the 38.2% Fibonacci retracement level. The 2nd-wave upward correction continues and is in its first subwave, a rising A wave.

I’ve updated the chart.

3 p.m. New York time

SPY bear call vertical spread entered. I’ve entered a short bull put vertical spread on SPY that expires in nine days (a 9DTE position and have posted an analysis of the trade.

11:05 a.m. New York time

IWM short iron fly exited. I’ve exited my short iron fly spread for a 5.9% return before fees and have updated the trade analysis with full results.

9:35 a.m. New York time

What’s happening now? The S&P 500 E-mini futures traded sideways overnight, rising sharply with the release of the ADP sneak-preview of the employment numbers as the opening bell approached. The government’s Employment Situation Report will be released on Friday, November 3.

What does it mean? The 2nd-wave upward correction that began on October 27 continues hovering around the 23.6% Fibonacci retracement level. The correction is retracing a downtrending 1st wave that began on October 12 from 4430.50.

On the chart, the correction is labled wave 2{-8}.

Under the rules of Elliott Wave Theory, a 2nd wave never moves beyond the start of the preceding 1st wave, making 4430.50 an absolute upper limit for this wave 2. If the price rises above that level, then the analysis no longer matches the chart and a new analysis must take its place.

Otherwise, we’re left with the common Fibonacci retracement levels. A 61.8% retracement is often seen, which would carry the price of the corection up intothe 4310s. A 50% retracement isn’t unheard of — the 4270s. And a 78.6% retracement is within the realm of possibiity — the 4360s.

A 2nd wave correction normally has three subwaves and tends to take the form of a Zigzag, with the A wave containing five smaller waves, the B wave three internal waves and the C wave, five internal waves. Those internal counts will help us understand how far along the correction’s subwaves are. The present subwave appears on the chart as wave A{-9}.

Also, the 1st wave took two weeks to run its course, and the present 2nd wave will be roughly proportional to that, although “proportional” has no robust definition in Elliott Wave Theory.

So we have some tools for understanding where this upward correction is in its journey. We could wish for a more precise tool kit but must make do with what we have. As a former lawyer of mine was wont to say, at least once daily, “It is what it is.”

What are the alternatives? Unchanged from yesterday.

  • My prior principal analysis could indeed match the chart, with a scenario that the decline from October 24 is a C wave within a 4th wave upward correction that is still underay. If the price reverses now and moves below 4122.25, the October 27 low, then it will have broken a rule of Elliott Wave Theory: A 2nd wave never moves below the end of the preceding 1st wave. If it does, then the analysis no longer matches the chart. That leaves the 4th wave scenario as a viable principal analysis.The 4th wave scenario interprets the October 24 high as being the end of wave A{-10} within wave 4{-9}, an upward correction, the October 27 low as the end of wave B{-10}, and the present rise as wave C{-10}.
  • The degree of the subwaves within the rise so far from October 27 are a bit up in the air. What we see is certainly part of the A wave — Wave A{-9} within wave 2{-8}. But are they of the {-10} degree, or something lower — subwaves within subwaves? It’s not yet clear on the chart.

[S&P 500 E-mini futures at 3:30 p.m., 35-minute bars, with volume]

What does Elliott wave theory say? Here are the waves that underly the analyses.

Principal Analysis:

  • A downtrend, wave 3{-2}, began on July 27 and is underway.
  • Within wave 3{-2}, a smaller downtrend, wave 3{-3}, began on September 14 and is in its initial subwave, wave 1{-4}.
  • With wave 1{-4}, subwave 5{-5}, an downtrend, is underway, having begun on October 12.
  • Wave 5{-5} is in its first subwave, wave 1{-6}.
  • Within waves 1{-6} and 1{-7} are underway.
  • Wave 1{-7} is in its 2nd subwave, an upward correction, wave 2{-8}.
  • Internally, wave 2{-8} is in its first subwave, rising wave A{-9}.

We Are Here.

These are the waves currently in progress under my principal analysis. Each line on the list shows the wave number, with the subscript in curly brackets, the traditional degree name, the starting date, the starting price of the S&P 500 E-mini futures, and the direction of the wave.

  • S&P 500 Index:
  • 5{+3} Supercycle, 7/8/1932, 4.40 (up)
  • 5{+2} Cycle, 12/9/1974, 60.96 (up)
  • 5{+1} Primary, 3/6/2009, 666.79 (up)
  • 5{0} Intermediate, 12/26/2018, 2346.58 (up)
  • S&P 500 Futures and index:
  • 4{-1} Minor, 1/4/2022, 4953.25 (down) (futures), 4818.62 (down) (index)
  • S&P 500 Futures:
  • 3{-2} Minute, 7/27/2023, 3502 (down)

Reading the chart. Price movements — waves – – in Elliott wave analysis are labeled with numbers within trending waves and letters with corrective waves. The subscripts — numbers in curly brackets — designate the wave’s degree, which, in Elliott wave analysis, means the relative position of a wave within the larger and smaller structures that make up the chart. R.N. Elliott, who in the 1930s developed the form of analysis that bears his name, viewed the chart as a complex structure of smaller waves nested within larger waves, which in turn are nested within still larger waves. In mathematics it’s called a fractal structure, where at every scale the pattern is similar to the others.

Learning and other resources. Elliott wave analysis provides context, not prophecy. As the 20th century semanticist Alfred Korzybski put it in his book Science and Sanity (1933), “The map is not the territory … The only usefulness of a map depends on similarity of structure between the empirical world and the map.” And I would add, in the ever-changing markets, we can judge that similarity of structure only after the fact.

See the menu page Analytical Methods for a rundown on where to go for information on Elliott wave analysis.

By Tim Bovee, Portland, Oregon, November 1, 2023

Disclaimer

Tim Bovee, Private Trader tracks the analysis and trades of a private trader for his own accounts. Nothing in this blog constitutes a recommendation to buy or sell stocks, options or any other financial instrument. The only purpose of this blog is to provide education and entertainment.

No trader is ever 100 percent successful in his or her trades. Trading in the stock and option markets is risky and uncertain. Each trader must make trading decisions for his or her own account, and take responsibility for the consequences.

License
Creative Commons License

All content on Tim Bovee, Private Trader by Timothy K. Bovee is licensed under a Creative Commons Attribution-ShareAlike 4.0 International License.

Based on a work at www.timbovee.com.

IWM Trade

IShares Russell 2000 ETF (IWM)

Lot 2023-1

Update 11/1/2023: I exited my short iron fly spread on November 1 expiration day, for a $1.36 debit per contract/share, a profit before fees of $8.00 per contract. Shares were trading at $164.38, the same as the entry level.

The Implied Volatility Rank at exit was 37.6%, down 3.6 points from the entry level.

The shares price was unchanged.. The options position produced a 5.9% return for a +2,147% annual rate.


I have entered a short iron fly position on IWM, using options that trade for the last time the next day, November 1. The premium is a $1.44 credit per contract share and the stock at the time of entry was priced at $164.38.

The Implied Volatility Ratio stood at 41.2%.

Premium:$1.44Expire OTM
IWM-iron flyStrikeOddsDelta
Calls
Long167.0081.0%20
Break-even166.4466.5%33.5
Short165.0052.0%47
Puts
Short165.0047.0%53
Break-even164.4461.5%38.5
Long163.0076.0%24

The premium is 72% of the width of each of the short/long spreads. The profit zone covers a 1.3% move to the upside and a 1.2% move to the downside.

The risk/reward ratio is 0.4 :1, with maximum risk of $56 and maximum reward of $144 per contract.

By Tim Bovee, Portland, Oregon, October 31, 2023

Disclaimer

Tim Bovee, Private Trader tracks the analysis and trades of a private trader for his own accounts. Nothing in this blog constitutes a recommendation to buy or sell stocks, options or any other financial instrument. The only purpose of this blog is to provide education and entertainment.

No trader is ever 100 percent successful in his or her trades. Trading in the stock and option markets is risky and uncertain. Each trader must make trading decisions for his or her own account, and take responsibility for the consequences.

License
Creative Commons License

All content on Tim Bovee, Private Trader by Timothy K. Bovee is licensed under a Creative Commons Attribution-ShareAlike 4.0 International License.

Based on a work at www.timbovee.com.

Trader’s Notebook

3:30 p.m. New York time

Half an hour before the closing bell. The S&P 500 futures fluctuated around the 23.6% Fibonacci retracement level during much of the session, rising into the 42-tens as the closing bell approached.

No change in the analysis. The 2nd wave upward correction that began on October 27 continues. I’ve updated the chart.

2:30 p.m. New York time

IWM short iron fly entry. I’ve entered a short iron fly position on IWM one day left before expiration (1DTE) and have posted an analysis of the trade.

9:35 a.m. New York time

What’s happening now? The S&P 500 E-mini futures rose overnight, coming within cents of 4200.

What does it mean? I’ve redone the analysis in line with several alternative analyses of the past week.

The revised analysis: The 4th wave upward correction — wave 4{-9} that began on October 23 ended on October 24. The subsequent low-degree 5th wave — wave 5{-9} — ended at the October 27 low and also marked the end of a grandparent wave, 1{-8}. The rise since October 27 is a 2nd wave upward correction, wave 2{-8}.

Two alternatives of the past week play a role in this new analysis. The first alternative was that the wave degrees might be higher than the chart would have it, and indeed that is so; the decline from October 24, rather than being of the {-10} degree, is instead the {-9} degree. The second is that the 4th wave correction that began on October 23 ended on October 24, a rise that my principal analysis had labeled as the A wave within the correction. Instead, it was the whole correction.

Proof again, if any were needed, that Elliott Wave Theory does not predict. Instead, it provides context, forever muttering thoughtfully, “If this analysis matches the chart, then here are some things that might happen and others that can’t happen.”

The 2nd wave upward correction is still in its early stages, having reached the 23.6% Fibonacci retracement level. A 61.8% correction, in the low 4300s, or a 78.6% correction, in the 4360s, are reasonable expectations.

It will be followed by a 3rd wave downtrend that will carry the price below the correction’s starting point, 4122.25, and perhaps significantly lower. All of those waves are contained within larger waves, stretching up to wave 4{-1}, a downtrending wave that began on January 4, 2022. Wave 4{-1} is the next-to-the-last subwave within wave 4{0}, an expanding Diagonal Triangle that began on December 26, 2018.

What are the alternatives? So what could go wrong with the principal analysis? I see two possibilities (and there could be more):

  • My prior principal analysis could indeed match the chart, with a scenario that the decline from October 24 is a C wave within a 4th wave upward correction that is still underay. If the price reverses now and moves below 4122.25, the October 27 low, then it will have broken a rule of Elliott Wave Theory: A 2nd wave never moves below the end of the preceding 1st wave. If it does, then the analysis no longer matches the chart. That leaves the 4th wave scenario as a viable principal analysis.
  • The degree of the subwaves within the rise so far from October 27 are a bit up in the air. What we see is certainly part of the A wave — Wave A{-9} within wave 2{-8}. But are they of the {-10} degree, or something lower — subwaves within subwaves? It’s not yet clear on the chart.

[S&P 500 E-mini futures at 3:30 p.m., 35-minute bars, with volume]

What does Elliott wave theory say? Here are the waves that underly the analyses.

Principal Analysis:

  • A downtrend, wave 3{-2}, began on July 27 and is underway.
  • Within wave 3{-2}, a smaller downtrend, wave 3{-3}, began on September 14 and is in its initial subwave, wave 1{-4}.
  • With wave 1{-4}, subwave 5{-5}, an downtrend, is underway, having begun on October 12.
  • Wave 5{-5} is in its first subwave, wave 1{-6}.
  • Within waves 1{-6} and 1{-7} are underway.
  • Wave 1{-7} is in its 2nd subwave, an upward correction, wave 2{-8}.

We Are Here.

These are the waves currently in progress under my principal analysis. Each line on the list shows the wave number, with the subscript in curly brackets, the traditional degree name, the starting date, the starting price of the S&P 500 E-mini futures, and the direction of the wave.

  • S&P 500 Index:
  • 5{+3} Supercycle, 7/8/1932, 4.40 (up)
  • 5{+2} Cycle, 12/9/1974, 60.96 (up)
  • 5{+1} Primary, 3/6/2009, 666.79 (up)
  • 5{0} Intermediate, 12/26/2018, 2346.58 (up)
  • S&P 500 Futures and index:
  • 4{-1} Minor, 1/4/2022, 4953.25 (down) (futures), 4818.62 (down) (index)
  • S&P 500 Futures:
  • 3{-2} Minute, 7/27/2023, 3502 (down)

Reading the chart. Price movements — waves – – in Elliott wave analysis are labeled with numbers within trending waves and letters with corrective waves. The subscripts — numbers in curly brackets — designate the wave’s degree, which, in Elliott wave analysis, means the relative position of a wave within the larger and smaller structures that make up the chart. R.N. Elliott, who in the 1930s developed the form of analysis that bears his name, viewed the chart as a complex structure of smaller waves nested within larger waves, which in turn are nested within still larger waves. In mathematics it’s called a fractal structure, where at every scale the pattern is similar to the others.

Learning and other resources. Elliott wave analysis provides context, not prophecy. As the 20th century semanticist Alfred Korzybski put it in his book Science and Sanity (1933), “The map is not the territory … The only usefulness of a map depends on similarity of structure between the empirical world and the map.” And I would add, in the ever-changing markets, we can judge that similarity of structure only after the fact.

See the menu page Analytical Methods for a rundown on where to go for information on Elliott wave analysis.

By Tim Bovee, Portland, Oregon, October 31, 2023

Disclaimer

Tim Bovee, Private Trader tracks the analysis and trades of a private trader for his own accounts. Nothing in this blog constitutes a recommendation to buy or sell stocks, options or any other financial instrument. The only purpose of this blog is to provide education and entertainment.

No trader is ever 100 percent successful in his or her trades. Trading in the stock and option markets is risky and uncertain. Each trader must make trading decisions for his or her own account, and take responsibility for the consequences.

License
Creative Commons License

All content on Tim Bovee, Private Trader by Timothy K. Bovee is licensed under a Creative Commons Attribution-ShareAlike 4.0 International License.

Based on a work at www.timbovee.com.

Trader’s Notebook

3:30 p.m. New York time

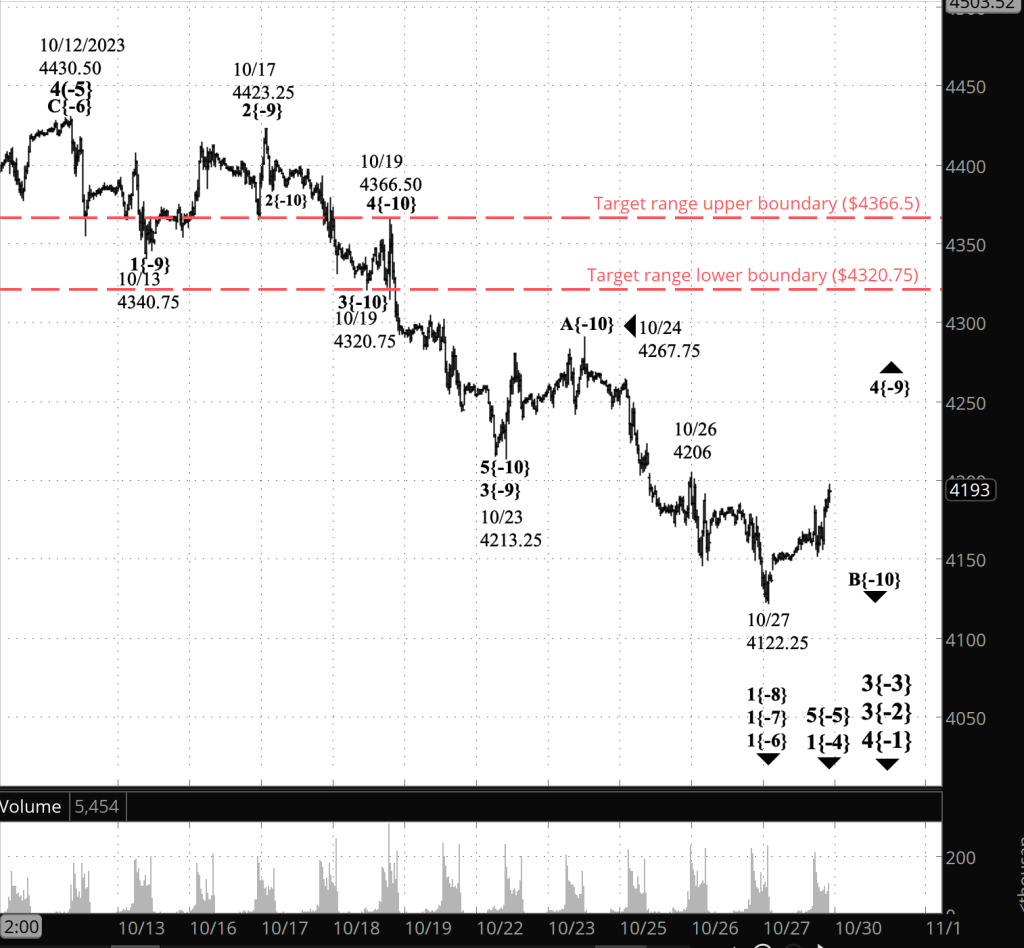
Half an hour before the closing bell. The S&P 500 rose the latter half of the session but has not yet committed to the upside. My ad hoc rule-of-thumb is to consider a move above the October 26 high, 4206, to be enough to consider the final wave of the upward correction, the C wave, to be underway.

The lack of a strong trend today isn’t surprising, given what’s on the calendar the rest of the week: On Wednesday, the ADP sneak-preview of the employment numbers and a statement on interest rates closing out a meeting of the Federal Open Market Committee. And then on Friday the government’s Employment Situation Report. There will be much incentive for trader’s to buy in or exit as the week progresses.

I’ve updated the chart.

1:40 p.m. New York time

Exited 9DTE options trade on SPY. I’ve exited my bull put options spread on SPY, entered nine days to expiration (9DTE), for a loss and have updated the trade analysis with full results.

12:45 p.m. New York time

Exited 1DTE options trade on QQQ. I’ve exited my iron butterfly position on QQQ, minutes after the opening bell on expiration day, for 5.5% of maximum potential profit, and have updated the trade analysis with full results. I entered the trade with one day to expiration (1DTE).

11:45 a.m. New York time

Short-term options plays. On Friday I had declared my intention to write up a plan, with rules, for trading options with only a day or a few days to expiration (DTE). In experimenting with the concept, I’ve entered positions 9DTE and 1DTE. As I began to write it quickly became clear that trading that way was complex than I had realized.

I had no intention of abandoning the longer-term trades that have been my break-and-butter for more than a decade. So a plan and rules had to take into account positions with at least three potential life spans: 1DTE, 9DTE and 45DTE.

Moreover, the options calendar has grown since the days when all options expirations occurred one per month. Nowadays, SPY and QQQ have options that expire every trading day, and IWM, every other trading day. Mostly highly liquid options have fresh issues each week. And there are still some symbols with once-a-month options.

Moreover, the possibility of trading three options every day or two, with 1DTE, increases the risk of running afoul of the pattern day trader rules issued by the SEC, at least for accounts of less than $25,000. Any trading calendar and rule set would have to manage that risk. True, a violation of the SEC’s day-trading rule — no more than three day trades in five business days — will lead to temporary restrictions, I’m told that brokerages tend to have very long and unforgiving memories that work on this principle: One a pattern day trader, always a pattern day trader.

And then there are the economic reports, including big market movers like the employment situation report, GDP and the consumer price index, all of which are released before the market open. The effect on a 1DTE trade, brought late in the session before the report, could be devastating the next morning if the market responded with a major move.

And the trade-write-ups I do, with all their verbiage, are time-consuming — fine for a series of 45DTE trades, not so fine a rapid-fire succession of 1DTE trades. I need to rework them so that they’re a simple copy/paste from my Options Construction spreadsheet.

The project turned out not to be the work of a weekend. I’m making progress with it now, and plan — hope? — to post it next weekend or early next week. Meanwhile, I’m still doing cautious close-to-expiration trades to see what problems might be lurking.

9:35 a.m. New York time

What’s happening now? The S&P 500 E-mini futures gapped slightly higher overnight after trading resumed on Sunday, subsequently rising gently from the 4140s to almost 4170.

What does it mean? The ambiguity that beset the chart remains, with two analyses of equal probability.

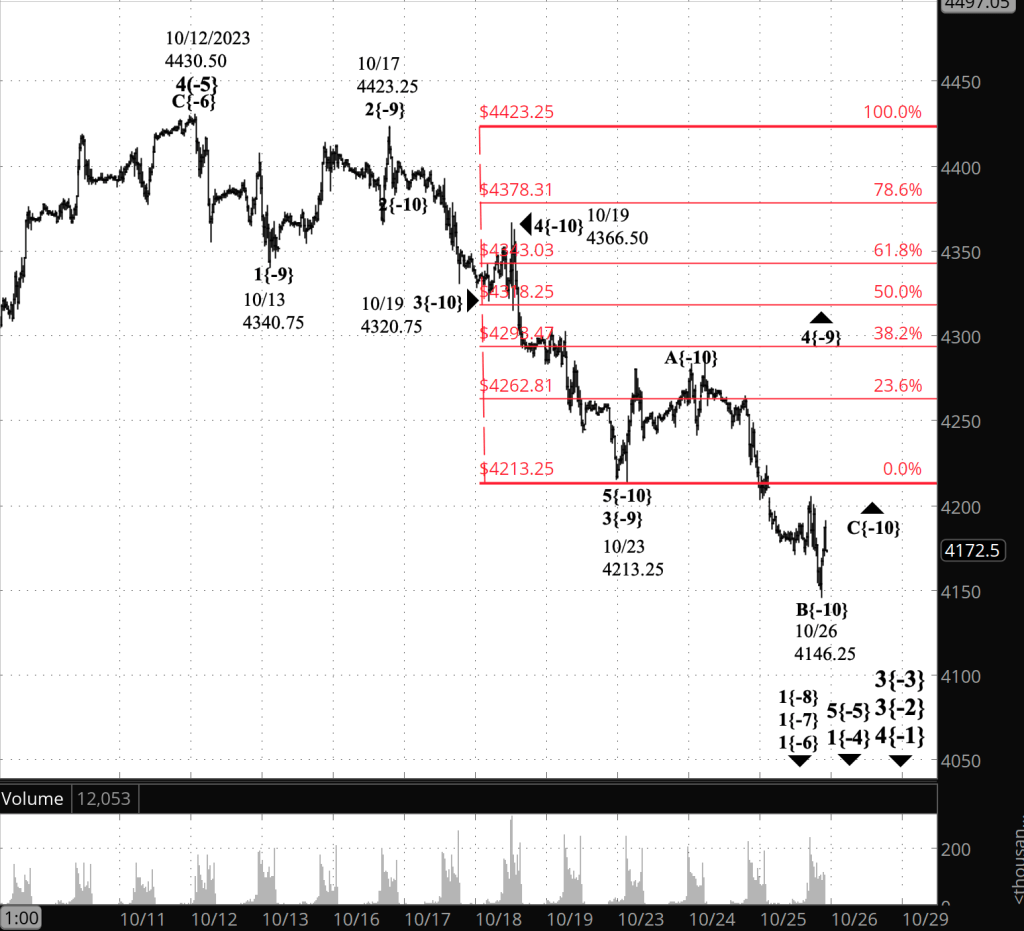
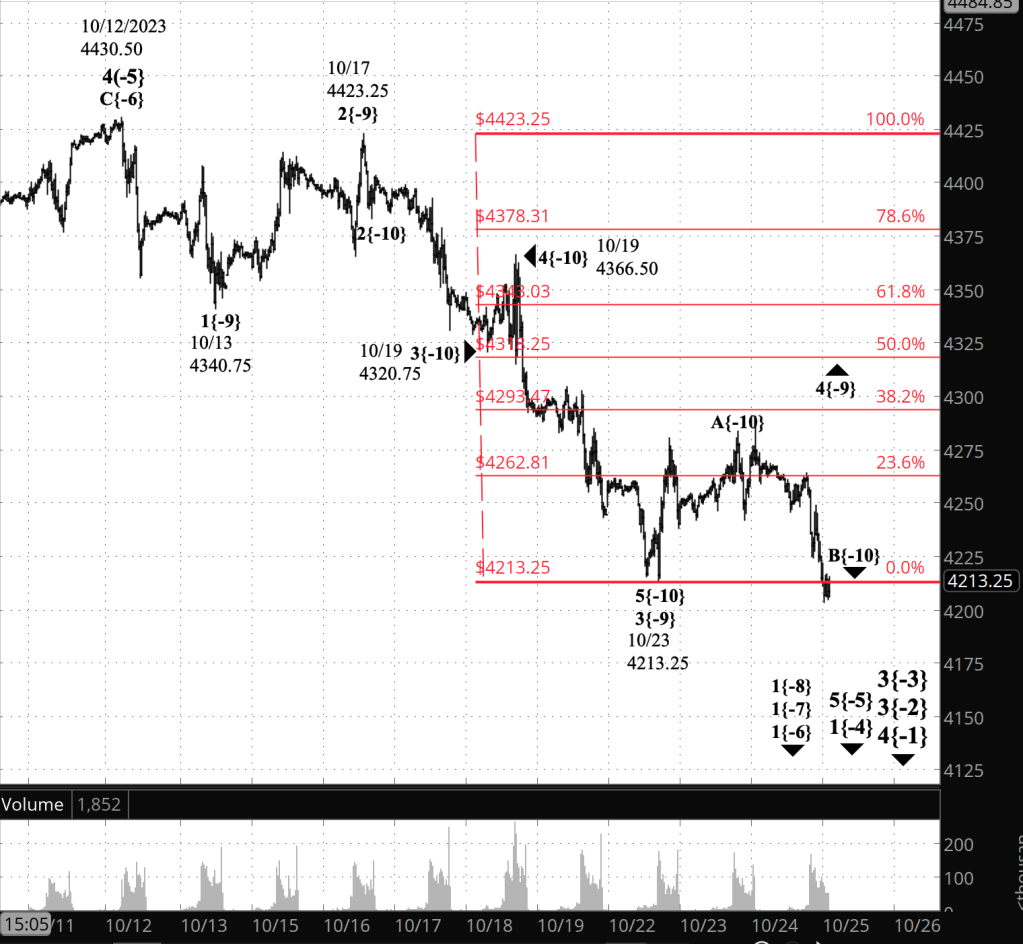
  • Either the middle wave of the three-wave upward correction that began on October 23 is still underway. This is the B-wave scenario.
  • Or the middle wave ended on October 22 at 4122.25, and the final wave of the correction has begun. This is the C-wave scenario.

I chose to retain the B-wave scenario on the chart because the simplest of uptrend metrics — a series of higher highs — has not yet manifested itself.

The technical term for what we’ve been seeing the last few trading is is a process called “bottom fishing”, and at this point no fish has decisively taken the bait. On the chart the B wave is wave B{-10}, and the C wave will be labeled C{-10}.

The C wave will be the end of the upward correction, unless it takes a compound form, stringing two or three connective patterns together. Whether compound or simple, the upward correction, wave 4{-9}, will be followed by a downtrending 5th wave that typically will have little ambiguity and quite a bit of power.

What are the alternatives? In addition to the ambiguity described above, it’s possible that the degree labels on the chart are lower than the reality of the chart. For example, the degree {-8} waves on the chart ought to be labeled {-7} and the {-9} wave changed to {-8}.

[S&P 500 E-mini futures at 3:30 p.m., 30-minute bars, with volume]

What does Elliott wave theory say? Here are the waves that underly the analyses.

Principal Analysis:

  • A downtrend, wave 3{-2}, began on July 27 and is underway.
  • Within wave 3{-2}, a smaller downtrend, wave 3{-3}, began on September 14 and is in its initial subwave, wave 1{-4}.
  • With wave 1{-4}, subwave 5{-5}, an downtrend, is underway, having begun on October 12.
  • Wave 5{-5} is in its first subwave, wave 1{-6}.
  • Within wave 1{-6}, waves 1{-7} and 1{-8} are underway.
  • Within 1{-8}, a downward correction ,wave 4{-9}, is underway and is in wave B{-10}, the middle of three subwaves.
  • Of equal probability, within wave 4{-9}, wave C{-10}, the last of three subwaves, is underway.

Alternative Analysis

  • The degrees in the principal analysis are lower than they will eventually turn out to be. The present downtrending wave 3{-9} is wave 3{-8} or perhaps even 3{-7}.

We Are Here.

These are the waves currently in progress under my principal analysis. Each line on the list shows the wave number, with the subscript in curly brackets, the traditional degree name, the starting date, the starting price of the S&P 500 E-mini futures, and the direction of the wave.

  • S&P 500 Index:
  • 5{+3} Supercycle, 7/8/1932, 4.40 (up)
  • 5{+2} Cycle, 12/9/1974, 60.96 (up)
  • 5{+1} Primary, 3/6/2009, 666.79 (up)
  • 5{0} Intermediate, 12/26/2018, 2346.58 (up)
  • S&P 500 Futures and index:
  • 4{-1} Minor, 1/4/2022, 4953.25 (down) (futures), 4818.62 (down) (index)
  • S&P 500 Futures:
  • 3{-2} Minute, 7/27/2023, 3502 (down)

Reading the chart. Price movements — waves – – in Elliott wave analysis are labeled with numbers within trending waves and letters with corrective waves. The subscripts — numbers in curly brackets — designate the wave’s degree, which, in Elliott wave analysis, means the relative position of a wave within the larger and smaller structures that make up the chart. R.N. Elliott, who in the 1930s developed the form of analysis that bears his name, viewed the chart as a complex structure of smaller waves nested within larger waves, which in turn are nested within still larger waves. In mathematics it’s called a fractal structure, where at every scale the pattern is similar to the others.

Learning and other resources. Elliott wave analysis provides context, not prophecy. As the 20th century semanticist Alfred Korzybski put it in his book Science and Sanity (1933), “The map is not the territory … The only usefulness of a map depends on similarity of structure between the empirical world and the map.” And I would add, in the ever-changing markets, we can judge that similarity of structure only after the fact.

See the menu page Analytical Methods for a rundown on where to go for information on Elliott wave analysis.

By Tim Bovee, Portland, Oregon, October 30, 2023

Disclaimer

Tim Bovee, Private Trader tracks the analysis and trades of a private trader for his own accounts. Nothing in this blog constitutes a recommendation to buy or sell stocks, options or any other financial instrument. The only purpose of this blog is to provide education and entertainment.

No trader is ever 100 percent successful in his or her trades. Trading in the stock and option markets is risky and uncertain. Each trader must make trading decisions for his or her own account, and take responsibility for the consequences.

License
Creative Commons License

All content on Tim Bovee, Private Trader by Timothy K. Bovee is licensed under a Creative Commons Attribution-ShareAlike 4.0 International License.

Based on a work at www.timbovee.com.

QQQ Trade

Invesco Powershares QQQ (QQQ)

Lot 2023-2

Update 10/30/2023: I exited my short iron butterfly spread on October 30, expiration day, for a $3.29 debit per contract/share, a profit before fees of $19 per contract. Shares were trading at $347.80, up $3.03 from the entry level.

The Implied Volatility Rank at exit was 56.1%, up 5.9 points from the entry level.

I exited on the first trading day after entry, which was expiration day, which is my normal practice for options position of short duration.

Shares rose by 0.9% over one trading day for a +107% annual rate. The options position produced a 5.8% return for a +703% annual rate.


I have entered an iron butterfly short iron fly on QQQ, using options that trade for the last time three days hence, on October 30, 2023. The premium is a $3.48 credit per contract share and the stock at the time of entry was priced at $344.77.

The Implied Volatility Ratio stood at 50.2%.

Premium:$3.48Expire OTM
QQQ-iron flyStrikeOddsDelta
Calls
Long350.0080.0%19
Break-even348.4864.5%34.5
Short345.0049.0%50
Puts
Short345.0050.0%51
Break-even343.4865.0%36
Long340.0080.0%21

The premium is 69.6% of the width of each of the short/long spreads. The profit zone covers a 11.1% move to the upside and a 0.4% move to the downside.

The risk/reward ratio is 0.4:1, with maximum risk of $152 and maximum reward of $348 per contract.

How I chose the trade. This is a new strategy I’m trying out, in near the close in one day at 1 day to expiration, out at the open on expiration day, direction neutral. I’ll write something about the strategy this weekend.

By Tim Bovee, Portland, Oregon, October 27, 2023

Disclaimer

Tim Bovee, Private Trader tracks the analysis and trades of a private trader for his own accounts. Nothing in this blog constitutes a recommendation to buy or sell stocks, options or any other financial instrument. The only purpose of this blog is to provide education and entertainment.

No trader is ever 100 percent successful in his or her trades. Trading in the stock and option markets is risky and uncertain. Each trader must make trading decisions for his or her own account, and take responsibility for the consequences.

License
Creative Commons License

All content on Tim Bovee, Private Trader by Timothy K. Bovee is licensed under a Creative Commons Attribution-ShareAlike 4.0 International License.

Based on a work at www.timbovee.com.

Trader’s Notebook

3:30 p.m. New York time

Half an hour before the opening bell. The S&P 500 futures continued to descend, reaching a session low in the 4120s. Alternative #1 once again wins the day. The B wave, the middle wave of three, within the 4th wave upward correction is still underway. The C wave has not yet begun.

The decline is deep enough that I’m considering a new alternative analysis. I won’t chart it today because of time constraints. If the downtrend continues when trading resumes Sunday night, then the Monday morning post will reflect this new alternative.

Under the new tentative alternative, the 4th wave upward correction that began on October 23 was truncated severely. The peak on October 24, now labeled A{-10}, is under this new scenario wave C{-10}, the final subwave of wave 4{-9}, the upward correction. The decline that began on that date is downtrending wave 5{-9}.

Aesthetically, I dislike this new alternative. The 4th wave is too short, and internally, it doesn’t clearly match the pattern for a full Zigzag or Flat correction. It’s a bit messy. On the other hand, there’s little good to say about a C-wave stretching so far below the start of the upward correction. The whole decline from October 24 is a bit ugly.

The good news in the new alternative, for me and my bull position on SPY entered in anticipation of an upward wave C: Wave 5 will be followed by a 2nd wave upward correction one degree larger.

3 p.m. New York time

QQQ iron fly position entered. I’m trying out a new strategy today. I’ve opened an iron fly (an iron condor with the short call and put a the same strike price) on QQQ. The next trading is expiration, and I’ll exit within five minutes after the opening bell on Monday. It makes small money, but it is a trade with a rapid turn-around, so small money works fine. I’ve posted an analysis of the trade. When you read it, take note of the risk/reward ratio. Most vertical spreads I trade have a 3.8:1 risk to reward. This iron fly? The risk/reward ratio is a thing of beauty. Truly.

9:35 a.m. New York time

What’s happening now? The S&P 500 E-mini futures reached 4185 overnight and then retreated to 4160.75, rising again as the opening bell approadhed

What does it mean? The price remained above the October 26 session low, 4146.25. The C wave in the 4th-wave correction that began on October 23 continues it’s rather slow start. The C wave will be the end of the correction and the start of a 5th wave downtrend, unless the correction takes a compound form, stringing two or three corrective patterns together. A compound correction will delay the start of the 5th wave downtrend.

If the 4th wave is typical, its final wave — the C wave — will end within the range of the 3rd subwave within the 4th wave of the 3rd-wave downtrend that preceded the 4th wave. That gives a target range of 4320.75 to 4366.50. The range boundaries are shown on the chart in red.

What are the alternatives?

Alternative #1: The B-wave continues. When the chart is bottom-fishing, as it has been for the past few days, then it’s always possible that there may be a bit more downside left. Under this scenario, the B wave within the 4th wave correction is underway and the C wave has not yet begun.

Alternative #2: Bigger and Smaller. Ascertaining the the size of the waves, their degrees within the fractal structure of the chart, is a difficult and often an impossible chore. Under this scenario, the degree labels on the chart are lower than the reality of the chart. For example, the degree {-8} waves on the chart ought to be labeled {-7} and the {-9} wave changed to {-8}.

[S&P 500 E-mini futures at 3:30 p.m., 30-minute bars, with volume]

What does Elliott wave theory say? Here are the waves that underly the analyses.

Principal Analysis:

  • A downtrend, wave 3{-2}, began on July 27 and is underway.
  • Within wave 3{-2}, a smaller downtrend, wave 3{-3}, began on September 14 and is in its initial subwave, wave 1{-4}.
  • With wave 1{-4}, subwave 5{-5}, an downtrend, is underway, having begun on October 12.
  • Wave 5{-5} is in its first subwave, wave 1{-6}.
  • Within wave 1{-6}, waves 1{-7} and 1{-8} are underway.
  • Within 1{-8}, a downward correction ,wave 4{-9}, is underway and is in wave C{-10}, the last of three subwaves.

Alternative Analysis #1

  • Within wave 4{-9}, wave B{-10}, the middle wave of three subwaves, is underway.

Alternative Analysis #2

  • The degrees in the principal analysis are lower than they will eventually turn out to be. The present downtrending wave 3{-9} is wave 3{-8} or perhaps even 3{-7}.

We Are Here.

These are the waves currently in progress under my principal analysis. Each line on the list shows the wave number, with the subscript in curly brackets, the traditional degree name, the starting date, the starting price of the S&P 500 E-mini futures, and the direction of the wave.

  • S&P 500 Index:
  • 5{+3} Supercycle, 7/8/1932, 4.40 (up)
  • 5{+2} Cycle, 12/9/1974, 60.96 (up)
  • 5{+1} Primary, 3/6/2009, 666.79 (up)
  • 5{0} Intermediate, 12/26/2018, 2346.58 (up)
  • S&P 500 Futures and index:
  • 4{-1} Minor, 1/4/2022, 4953.25 (down) (futures), 4818.62 (down) (index)
  • S&P 500 Futures:
  • 3{-2} Minute, 7/27/2023, 3502 (down)

Reading the chart. Price movements — waves – – in Elliott wave analysis are labeled with numbers within trending waves and letters with corrective waves. The subscripts — numbers in curly brackets — designate the wave’s degree, which, in Elliott wave analysis, means the relative position of a wave within the larger and smaller structures that make up the chart. R.N. Elliott, who in the 1930s developed the form of analysis that bears his name, viewed the chart as a complex structure of smaller waves nested within larger waves, which in turn are nested within still larger waves. In mathematics it’s called a fractal structure, where at every scale the pattern is similar to the others.

Learning and other resources. Elliott wave analysis provides context, not prophecy. As the 20th century semanticist Alfred Korzybski put it in his book Science and Sanity (1933), “The map is not the territory … The only usefulness of a map depends on similarity of structure between the empirical world and the map.” And I would add, in the ever-changing markets, we can judge that similarity of structure only after the fact.

See the menu page Analytical Methods for a rundown on where to go for information on Elliott wave analysis.

By Tim Bovee, Portland, Oregon, October 27, 2023

Disclaimer

Tim Bovee, Private Trader tracks the analysis and trades of a private trader for his own accounts. Nothing in this blog constitutes a recommendation to buy or sell stocks, options or any other financial instrument. The only purpose of this blog is to provide education and entertainment.

No trader is ever 100 percent successful in his or her trades. Trading in the stock and option markets is risky and uncertain. Each trader must make trading decisions for his or her own account, and take responsibility for the consequences.

License
Creative Commons License

All content on Tim Bovee, Private Trader by Timothy K. Bovee is licensed under a Creative Commons Attribution-ShareAlike 4.0 International License.

Based on a work at www.timbovee.com.

Trader’s Notebook

3:30 p.m. New York time

Half an hour before closing bell. The S&P 500 futures headed south for the first part of the session and then reversed to the upside.

Alternative Analysis #1 from this morning proved to be the more accurate of two possibilities with equal likelihoods.

As the closing bell approaches, traders are in the same position as this morning when reading the chart: The session low, 4146.25, may be the end of the B wave, the second of three waves within the 4th-wave upward correction that began on October 23, and the beginning of the C wave, the final wave in the correction, most likely. Or, of equal likelihood, the price might reverse and drop further, keeping the B wave alive a bit longer. See this morning’s analysis, below, for more on the subject.

I’ve updated the chart, moving the B-wave label to the session low and retaining as the principal analysis the scenario that sees the C wave as having begun.

9:35 a.m. New York time

What’s happening now? The S&P 500 E-mini futures fell overnight into the 4170s and then rapidly rose as the opening bell approached. The rise coincided with the release of the advance estimate of the GDP for the 3rd quarter.

What does it mean? As a principal analysis I’ve chosen to label the overnight low as the end of descending wave B within a 4th wave upward correction that began October 23 and as the beginning of rising wave C. It is equally likely that the price will reverse and move still lower, allow the B wave to decline further before reversing and beginning the C wave.

I chose the C-wave scenario based on the distance traveled below the starting point of the correction. The B wave within a 4th wave correction can move below the correction’s starting point without breaking any rules of Elliott Wave Theory. However, the break-below must be proportional with the rest of the waves within the correction. Subjectively, it seems to me that the present decline is proportional and further decline would risk destroying that proportionality.

Elliott Wave analysis is first and foremost based on the art of pattern recognition, something the human brain excels at. But at the end of the day, patterns are often ambiguous, and recognizing them is a subjective art.

In either case, once the C wave has begun, it is likely to approach the target range, from 4320.75 to 4366.50, the span covered by the 4th wave within the preceding 3rd wave of the same degree as the correction. That’s the typical behavior for a 4th wave upward correction. Not all 4th waves behave typically.

The C wave will complete the upward correction, unless the correction takes a compound form, stringing two or three corrective patterns together. However the chart plays out, the correction will be followed by a 5th wave downtrend that likely will carry the wave back below the correction’s starting point, 4213.25, and perhaps significantly below that level.

What are the alternatives?

Alternative #1: The B-wave continues. I discussed this alternative in the “What does it mean?” section as having equal likelihood with the principal analysis: Wave B will move lower before ending.

Alternative #2: Bigger and Smaller. Ascertaining the the size of the waves, their degrees within the fractal structure of the chart, is a difficult and often an impossible chore. Under this scenario, the degree labels on the chart are lower than the reality of the chart. For example, the degree {-8} waves on the chart ought to be labeled {-7} and the {-9} wave changed to {-8}.

[S&P 500 E-mini futures at 3:30 p.m., 30-minute bars, with volume]

What does Elliott wave theory say? Here are the waves that underly the analyses.

Principal Analysis:

  • A downtrend, wave 3{-2}, began on July 27 and is underway.
  • Within wave 3{-2}, a smaller downtrend, wave 3{-3}, began on September 14 and is in its initial subwave, wave 1{-4}.
  • With wave 1{-4}, subwave 5{-5}, an downtrend, is underway, having begun on October 12.
  • Wave 5{-5} is in its first subwave, wave 1{-6}.
  • Within wave 1{-6}, waves 1{-7} and 1{-8} are underway.
  • Within 1{-8}, a downward correction ,wave 4{-9}, is underway and is in wave C{-10}, the last of three subwaves.

Alternative Analysis #1

  • Within wave 4{-9}, wave B{-10}, the middle wave of three subwaves, is underway.

Alternative Analysis #2

  • The degrees in the principal analysis are lower than they will eventually turn out to be. The present downtrending wave 3{-9} is wave 3{-8} or perhaps even 3{-7}.

We Are Here.

These are the waves currently in progress under my principal analysis. Each line on the list shows the wave number, with the subscript in curly brackets, the traditional degree name, the starting date, the starting price of the S&P 500 E-mini futures, and the direction of the wave.

  • S&P 500 Index:
  • 5{+3} Supercycle, 7/8/1932, 4.40 (up)
  • 5{+2} Cycle, 12/9/1974, 60.96 (up)
  • 5{+1} Primary, 3/6/2009, 666.79 (up)
  • 5{0} Intermediate, 12/26/2018, 2346.58 (up)
  • S&P 500 Futures and index:
  • 4{-1} Minor, 1/4/2022, 4953.25 (down) (futures), 4818.62 (down) (index)
  • S&P 500 Futures:
  • 3{-2} Minute, 7/27/2023, 3502 (down)

Reading the chart. Price movements — waves – – in Elliott wave analysis are labeled with numbers within trending waves and letters with corrective waves. The subscripts — numbers in curly brackets — designate the wave’s degree, which, in Elliott wave analysis, means the relative position of a wave within the larger and smaller structures that make up the chart. R.N. Elliott, who in the 1930s developed the form of analysis that bears his name, viewed the chart as a complex structure of smaller waves nested within larger waves, which in turn are nested within still larger waves. In mathematics it’s called a fractal structure, where at every scale the pattern is similar to the others.

Learning and other resources. Elliott wave analysis provides context, not prophecy. As the 20th century semanticist Alfred Korzybski put it in his book Science and Sanity (1933), “The map is not the territory … The only usefulness of a map depends on similarity of structure between the empirical world and the map.” And I would add, in the ever-changing markets, we can judge that similarity of structure only after the fact.

See the menu page Analytical Methods for a rundown on where to go for information on Elliott wave analysis.

By Tim Bovee, Portland, Oregon, October 26, 2023

Disclaimer

Tim Bovee, Private Trader tracks the analysis and trades of a private trader for his own accounts. Nothing in this blog constitutes a recommendation to buy or sell stocks, options or any other financial instrument. The only purpose of this blog is to provide education and entertainment.

No trader is ever 100 percent successful in his or her trades. Trading in the stock and option markets is risky and uncertain. Each trader must make trading decisions for his or her own account, and take responsibility for the consequences.

License
Creative Commons License

All content on Tim Bovee, Private Trader by Timothy K. Bovee is licensed under a Creative Commons Attribution-ShareAlike 4.0 International License.

Based on a work at www.timbovee.com.

SPY Trade

S&P 500 ETF Trust (SPY)

Lot 2023-9

Update 10/30/2023: I exited my short bull put vertical spread on SPY, four days before expiration, for a $1.39 debit per contract/share, a loss before fees of $32 per contract. Shares were trading at $413.61, down $3.80 from the entry level.

The Implied Volatility Rank at exit was 61.1%, up 8.7 points from the entry level.

I exited because the position had reached my management point. The options had nine days to go until expiration when I entered, and my management point is about half that. In this case, at four days before expiration. The position lost because it bet on an upward move and the price moved down instead, the result of ambiguity creating by the chart’s bottom fishing, something much disussed in my daily S&P 500 futures analyses of late.

Shares fell by 0.9% over five days for a -67% annual rate. The options position produced a -23.0% loss for a -1,681% annual rate.


I have entered a bull put vertical spread on SPY, using options that trade for the last time nine days hence, on November 3. The premium is a $1.07 credit per contract share and the stock at the time of entry was priced at $417.41.

The Implied Volatility Ratio stood at 52.4%.

Premium:$1.07Expire OTM
SPY-bull put spreadStrikeOddsDelta
Puts
Long406.0080.0%19
Break-even412.0774.5%24.5
Short411.0069.0%30

The premium is 42.8% of the width of the short/long spread. The profit zone covers a 5% move to the downside and an unlimited move to the upside.

The risk/reward ratio is 3.7:1, with maximum risk of $393 and maximum reward of $107 per contract.

How I chose the trade. I selected the short strike prices based on an Elliott Wave analysis that sees SPY as nearing the end of the B wave within a 4th wave upward correction and nearing the start of an upward C wave.

By Tim Bovee, Portland, Oregon, October 25, 2023

Disclaimer

Tim Bovee, Private Trader tracks the analysis and trades of a private trader for his own accounts. Nothing in this blog constitutes a recommendation to buy or sell stocks, options or any other financial instrument. The only purpose of this blog is to provide education and entertainment.

No trader is ever 100 percent successful in his or her trades. Trading in the stock and option markets is risky and uncertain. Each trader must make trading decisions for his or her own account, and take responsibility for the consequences.

License
Creative Commons License

All content on Tim Bovee, Private Trader by Timothy K. Bovee is licensed under a Creative Commons Attribution-ShareAlike 4.0 International License.

Based on a work at www.timbovee.com.

Trader’s Notebook

3:30 p.m. New York time

Half an hour before the closing bell. The S&P 500 futures have fallen during the session to slightly above 4200. The decline carries the B wave of the 4th wave upward correction below the starting point, 4213.25, of the preceding A wave. The correction is taking the form of a Flat, which is common for 4th waves, and so such a drop is within the rule of Elliott Wave Theory.

Coming next, an impressive C-wave rise.

I’ve updated the chart.

3:10 p.m. New York time

SPY 9DTE options position entered. I’ve opened a bull put vertical options spread on SPY with nine days until expiration (9DTE) and have posted an analysis of the trade.

2 p.m. New York time

QQQ options position exited. I’ve exited by bear call vertical spread on QQQ for 50% of maximum potential profit and have updated the trade analysis with an analysis of the results.

9:35 a.m. New York time

What’s happening now? The S&P 500 E-mini futures traded sideways overnight, ranging from the 4240s to the 4270s and staying close to the 23.6% Fibonacci retracement level. (The Fibonacci levels are shown on the chart in red.)

What does it mean? The 4th-wave upward correction that began on October 23 continues and is in its B wave, the second of three internal waves. If the correction turns out to be typial of 4th waves, it will end somewhere between the 4320s and the 4360s, in the range of the 4th subwave within the preceding 3rd wave of the same degree as the correction. That target range is in the neighborhood of a 50% retracement and the 61.8% Fibonacci level, also typical endpoints of corrections.

The declining B wave will be followed by a rising C wave that will complete the correction, unless it takes a compound form containing two or three corrective patterns. Whichever form it takes, once the correction is complete, it will be followed by a 5th-wave downtrend that likely will carry the price below the end of the preceding 3rd wave, at 4213.25, and perhaps significantly below that level.

The present upward correction is a subwave of a series of downtrending 1st waves of increasing size (or “degree”), all of which are contained within a downtrending 5th wave four degrees larger than the correction. The 5th wave began on October 12 and so is also of a fairly low degree.

Big picture: Everything I’ve described above is happening within a downtrending 3rd wave seven degrees larger than the correction, which began on July 27, and that 3rd wave is a subwave of the downtrending 4th wave one degree higher that began on January 4, 2022.

So with a nod to Robert Frost and his 1923 poem “Stopping by Woods on a Snowy Evening“, this major bear market can truly say it has “miles to go before I sleep.”

What are the alternatives? Getting the degrees right is a difficult and often an impossible chore. Under the alternative scenario, the degree labels are lower than the reality on the chart. For example, the degree {-8} waves on the chart ought to be labeled {-7} and the {-9} wave changed to {-8}.

[S&P 500 E-mini futures at 3:30 p.m., 25-minute bars, with volume]

What does Elliott wave theory say? Here are the waves that underly the analyses.

Principal Analysis:

  • A downtrend, wave 3{-2}, began on July 27 and is underway.
  • Within wave 3{-2}, a smaller downtrend, wave 3{-3}, began on September 14 and is in its initial subwave, wave 1{-4}.
  • With wave 1{-4}, subwave 5{-5}, an downtrend, is underway, having begun on October 12.
  • Wave 5{-5} is in its first subwave, wave 1{-6}.
  • Within wave 1{-6}, waves 1{-7} and 1{-8} are underway.
  • Within 1{-8}, a downward correction ,wave 4{-9}, is underway and is in wave B{-10}, it’s second of three subwaves.

Alternative Analysis

  • The degrees in the principal analysis are lower than they will eventually turn out to be. The present downtrending wave 3{-9} is wave 3{-8} or perhaps even 3{-7}.

We Are Here.

These are the waves currently in progress under my principal analysis. Each line on the list shows the wave number, with the subscript in curly brackets, the traditional degree name, the starting date, the starting price of the S&P 500 E-mini futures, and the direction of the wave.

  • S&P 500 Index:
  • 5{+3} Supercycle, 7/8/1932, 4.40 (up)
  • 5{+2} Cycle, 12/9/1974, 60.96 (up)
  • 5{+1} Primary, 3/6/2009, 666.79 (up)
  • 5{0} Intermediate, 12/26/2018, 2346.58 (up)
  • S&P 500 Futures and index:
  • 4{-1} Minor, 1/4/2022, 4953.25 (down) (futures), 4818.62 (down) (index)
  • S&P 500 Futures:
  • 3{-2} Minute, 7/27/2023, 3502 (down)

Reading the chart. Price movements — waves – – in Elliott wave analysis are labeled with numbers within trending waves and letters with corrective waves. The subscripts — numbers in curly brackets — designate the wave’s degree, which, in Elliott wave analysis, means the relative position of a wave within the larger and smaller structures that make up the chart. R.N. Elliott, who in the 1930s developed the form of analysis that bears his name, viewed the chart as a complex structure of smaller waves nested within larger waves, which in turn are nested within still larger waves. In mathematics it’s called a fractal structure, where at every scale the pattern is similar to the others.

Learning and other resources. Elliott wave analysis provides context, not prophecy. As the 20th century semanticist Alfred Korzybski put it in his book Science and Sanity (1933), “The map is not the territory … The only usefulness of a map depends on similarity of structure between the empirical world and the map.” And I would add, in the ever-changing markets, we can judge that similarity of structure only after the fact.

See the menu page Analytical Methods for a rundown on where to go for information on Elliott wave analysis.

By Tim Bovee, Portland, Oregon, October 25, 2023

Disclaimer

Tim Bovee, Private Trader tracks the analysis and trades of a private trader for his own accounts. Nothing in this blog constitutes a recommendation to buy or sell stocks, options or any other financial instrument. The only purpose of this blog is to provide education and entertainment.

No trader is ever 100 percent successful in his or her trades. Trading in the stock and option markets is risky and uncertain. Each trader must make trading decisions for his or her own account, and take responsibility for the consequences.

License
Creative Commons License

All content on Tim Bovee, Private Trader by Timothy K. Bovee is licensed under a Creative Commons Attribution-ShareAlike 4.0 International License.

Based on a work at www.timbovee.com.