3:30 p.m. New York time
Half an hour before the closing bell. The S&P 500 futures have entered an either/or pattern.
Either the wave 4 correction has taken the form of a Flat and the B wave has so far retraced nearly 130% of the preceding A wave…
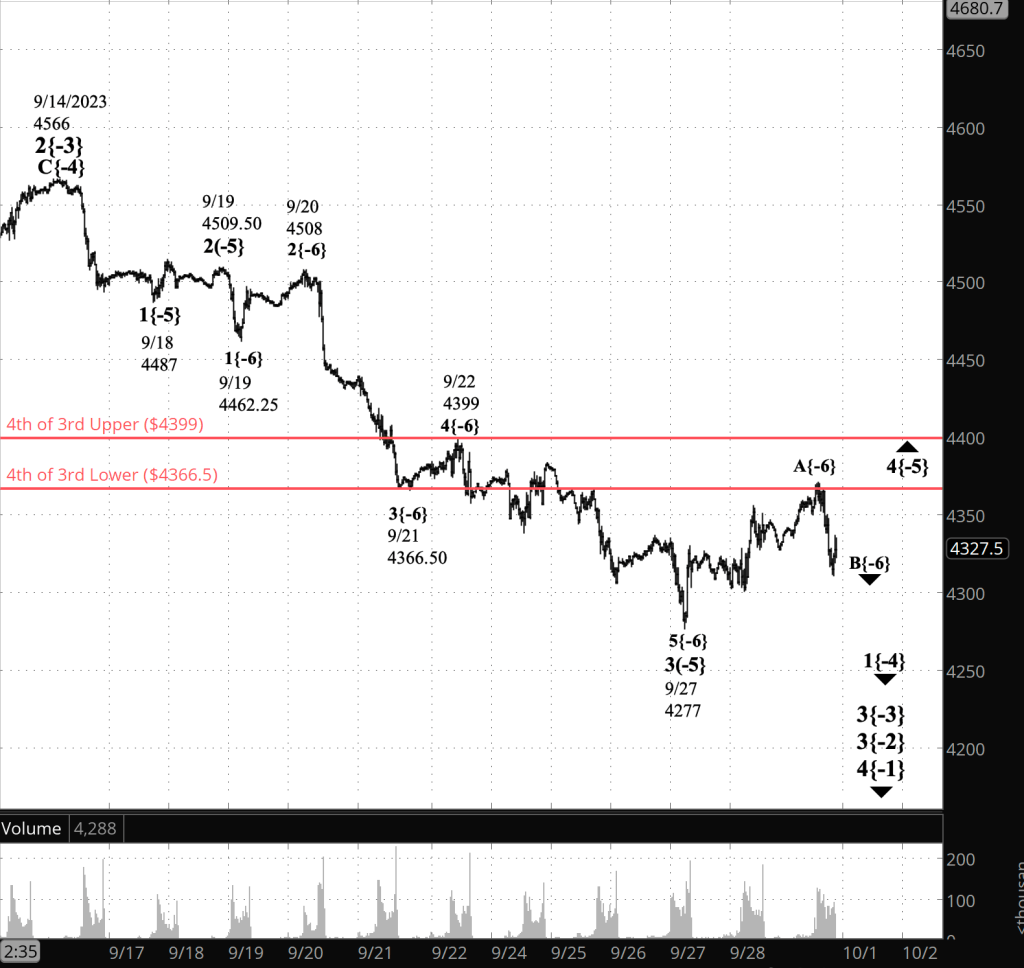
…or the wave 4 correction ended on September 29 at 4371.25 and the wave 5 downtrend has begun.
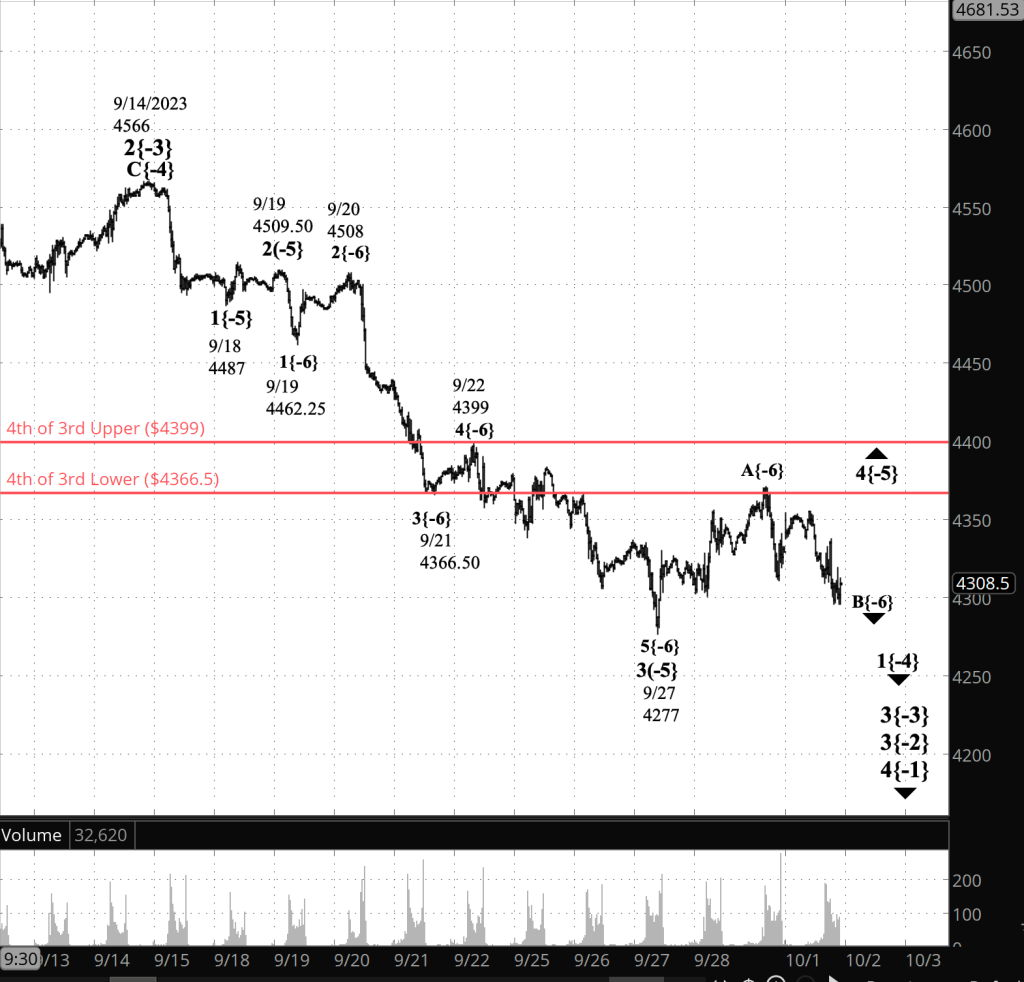
First, the B-wave scenario: In a Flat pattern, the A wave will have three subwaves, as will the B wave, and the B wave will typically retrace between 100% and 138% of the A wave. In this scenario’s favor: The B wave is well within the guidelines of Elliott Wave Theory. Against it: The A wave of the pattern appears to have five subwaves, which makes it part of a Zigzag pattern. Also, Flats in my experience are more common in 4th waves than in 2nd waves.
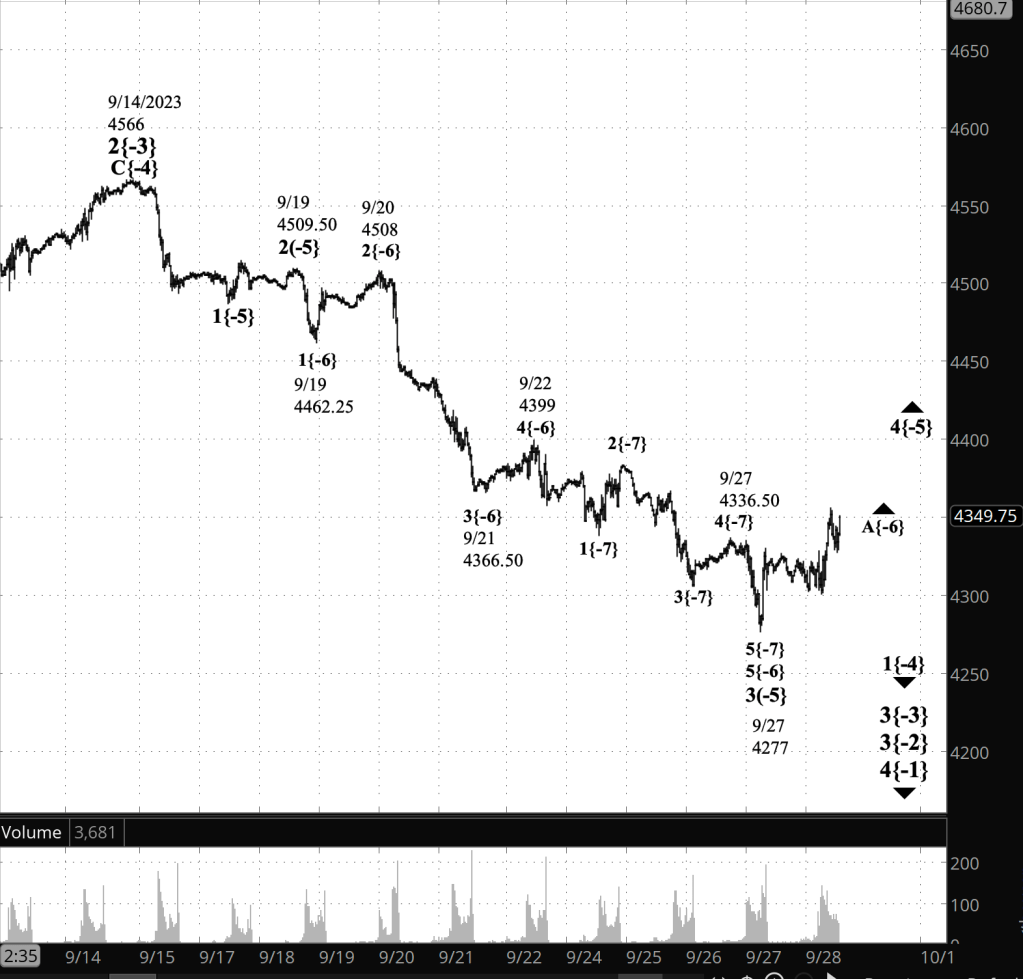
Second, the 5th wave scenario. If I squint my eyes and whisper a wish, I can count three subwaves in wave A. It’s not unusual for waves occasionally to be ambiguous in the subwaves they trace. If the rise from September 27 has three subwaves, then there is no barrier to the ensuing decline being downtrending wave 5. I count it as being in its 3rd wave subwave, which in turn is in its 3rd wave. Wave 3 is in its third day. The last 3rd wave of the same degree was finished in a day. So its duration is proportional.
For me, the analysis hinges on the rise from September 27 to September 29. And the most reasonable subwave count for that rise five. Which is inconsistent both with this morning’s Principal Analysis and with Alternative #1.
Under such circumstances, I tend toward caution. I’ll retain my present analysis in marking the chart: Wave B within the upward correction, wave 4 is underway, while stressing the uncertinty of that decision.
If the price reverses and returns to the 4370s, that makes the B-wave scenario more likely: The C wave will be underway.
If the price continues falling and moves robustly below the 138% retracement level, 4206, then the 5th-wave scenario will be more likely: The 4th wave correction ended on September 29 and the 5th wave downtrend is underway.
1:10 p.m. New York time
QQQ options position entered. I’ve entered a short bear all vertical spread on QQQ, using options that will expire on November 14, and have posted an analysis of the trade.
12:30 p.m. New York time
SPY options position exited. I have exited my short bear call vertical spread on SPY, using options that will expire on November 17, for 49.8% of maximum potential profit. I’ve updated the trade analysis with full details.
9:35 a.m. New York time
What’s happening now? The S&P 500 E-mini futures declined overnight, from the 4330s to the 4290s.
What does it mean? The middle subwave of a three-wave downward correction, a 4th wave, continues. It is the declining B wave and will be followed by a C wave that will complete the corrective pattern, and the correction as a whole, unless it takes a compound form containing two or three corrective patterns.
The 4th wave will be followed by a downtrending 5th wave, which sometimes are the longest of the waves within a larger trend and sometimes are trunated, making them the shortest. No way to tell out this point how the future wave 5 will play out.
What are the alternatives? There are two.
It’s possible to count the rise from September 27, the A wave on the chart, as being the 4th wave in its entirety. The size is disproprotionate to prior waves of the same degree, but it’s still possible.
As always, there’s ambiguity in where the wave patterns are within the complex fractal structure of the chart. For the principal analysis I’ve labelled the upward correction as being two degrees below the 3rd wave. It’s possible that moving it up a degree, to one degree below the 3rd, will prove to be more accurate, or moving it down one degree, to three degrees below the 3rd, better describes what’s happening on the chart.
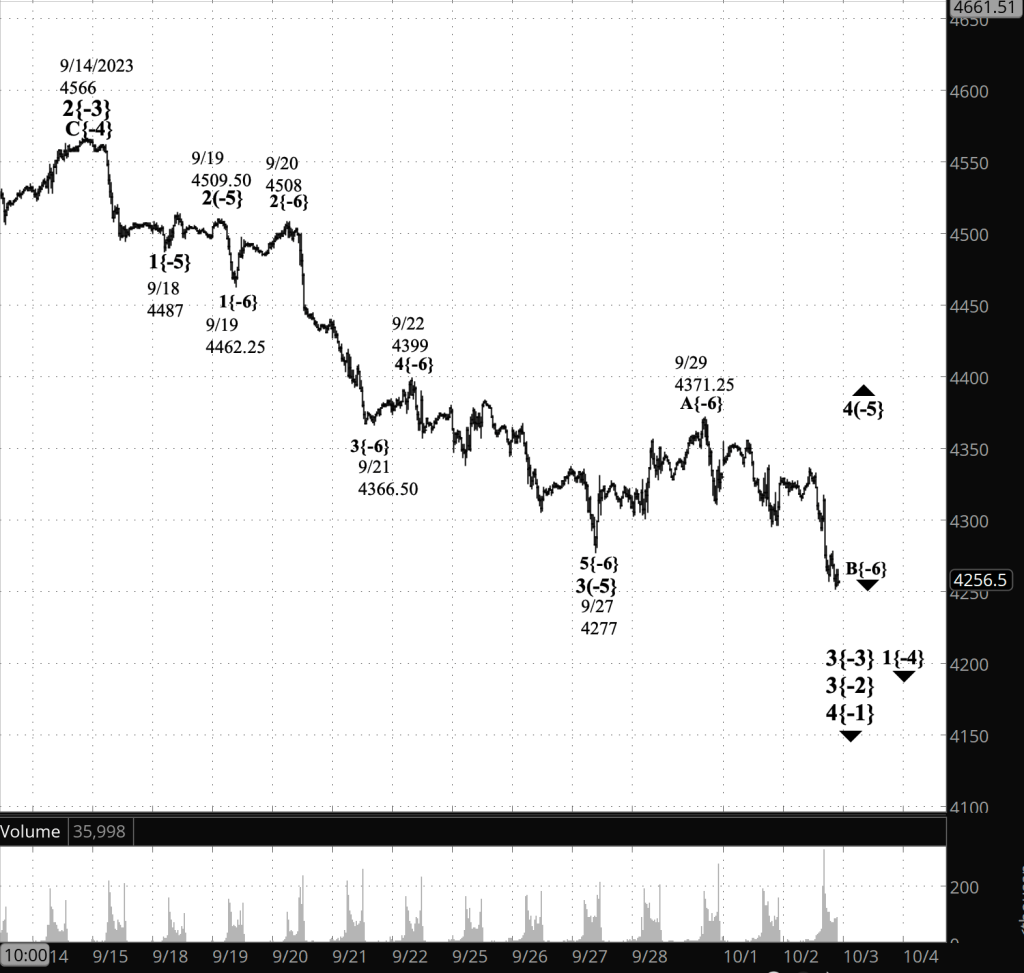
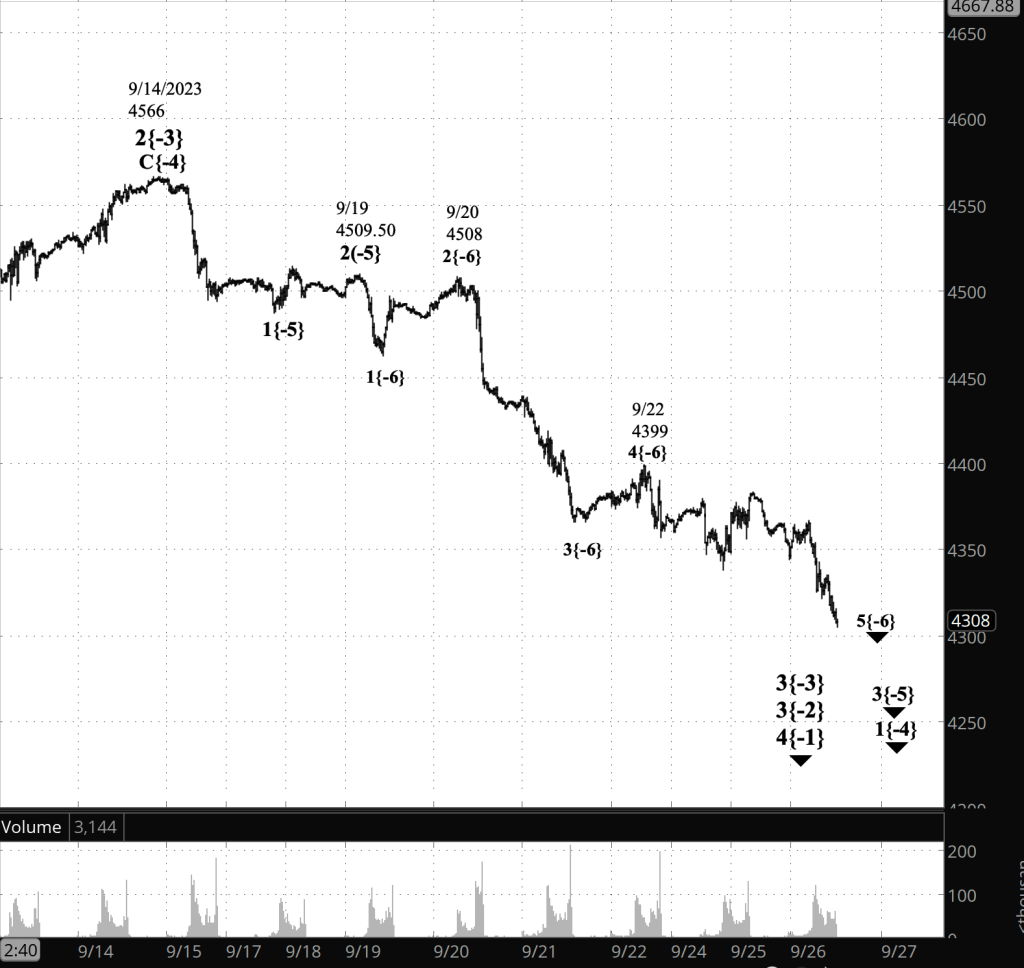
[S&P 500 E-mini futures at 3:30 p.m., 30-minute bars, with volume]
What does Elliott wave theory say? Here are the waves that underly the analyses.
Principal Analysis:
- A downtrend, wave 3{-2}, began on July 27 and is underway.
- Within wave 3{-2}, a smaller downtrend, wave 3{-3}, began on September 14 and is in its initial subwave, wave 1{-4}.
- With wave 1{-4}, subwave 4{-5}, an upward correction, is underway, having begun on September 27 from 4277.
- Wave 4{-5} is in its middle subwave, declining wave B{-6}.
Alternative Analysis #1
- Downtrending wave 5{-5} is underway, having begun on September 29 from 4371.25
Alternative Analysis #2
- Wave 4{-4} within downtrend 3{-3} is underway.
… or …
- Wave 4{-6} within wave wave 1{-5} within wave 1{-4} is underway
Big picture:
- The wave 3{-2} downtrend is a subwave of wave 4{-1}, a downtrend that began on January 4, 2022.
- Wave 4{-1}, in turn, is a subwave of wave 5{0}, an expanding Diagonal Triangle that began on December 26, 2018.
- Wave 4{-1} may eventually reach the lower boundary of wave 5{0}, presently slightly below 1800 and declining further each day.
- Wave 4{-1} will be followed by rising wave 5{-1}, the final wave in the Triangle.
We Are Here.
These are the waves currently in progress under my principal analysis. Each line on the list shows the wave number, with the subscript in curly brackets, the traditional degree name, the starting date, the starting price of the S&P 500 E-mini futures, and the direction of the wave.
- S&P 500 Index:
- 5{+3} Supercycle, 7/8/1932, 4.40 (up)
- 5{+2} Cycle, 12/9/1974, 60.96 (up)
- 5{+1} Primary, 3/6/2009, 666.79 (up)
- 5{0} Intermediate, 12/26/2018, 2346.58 (up)
- S&P 500 Futures and index:
- 4{-1} Minor, 1/4/2022, 4953.25 (down) (futures), 4818.62 (down) (index)
- S&P 500 Futures:
- 3{-2} Minute, 7/27/2023, 3502 (down)
Reading the chart. Price movements — waves – – in Elliott wave analysis are labeled with numbers within trending waves and letters with corrective waves. The subscripts — numbers in curly brackets — designate the wave’s degree, which, in Elliott wave analysis, means the relative position of a wave within the larger and smaller structures that make up the chart. R.N. Elliott, who in the 1930s developed the form of analysis that bears his name, viewed the chart as a complex structure of smaller waves nested within larger waves, which in turn are nested within still larger waves. In mathematics it’s called a fractal structure, where at every scale the pattern is similar to the others.
Learning and other resources. Elliott wave analysis provides context, not prophecy. As the 20th century semanticist Alfred Korzybski put it in his book Science and Sanity (1933), “The map is not the territory … The only usefulness of a map depends on similarity of structure between the empirical world and the map.” And I would add, in the ever-changing markets, we can judge that similarity of structure only after the fact.
See the menu page Analytical Methods for a rundown on where to go for information on Elliott wave analysis.
By Tim Bovee, Portland, Oregon, October 3, 2023
Disclaimer
Tim Bovee, Private Trader tracks the analysis and trades of a private trader for his own accounts. Nothing in this blog constitutes a recommendation to buy or sell stocks, options or any other financial instrument. The only purpose of this blog is to provide education and entertainment.
No trader is ever 100 percent successful in his or her trades. Trading in the stock and option markets is risky and uncertain. Each trader must make trading decisions for his or her own account, and take responsibility for the consequences.
License
All content on Tim Bovee, Private Trader by Timothy K. Bovee is licensed under a Creative Commons Attribution-ShareAlike 4.0 International License.
Based on a work at www.timbovee.com.


You must be logged in to post a comment.