Trader’s Notebook

3:30 p.m. New York time

Half an hour before the closing bell. The S&P 500 futures fell sharply after the Federal Open Market Committee said it would keep the Fed Funds Rate unchanged for now. The price continued to work its way lower, reaching into the 4460s as the closing bell approached,.

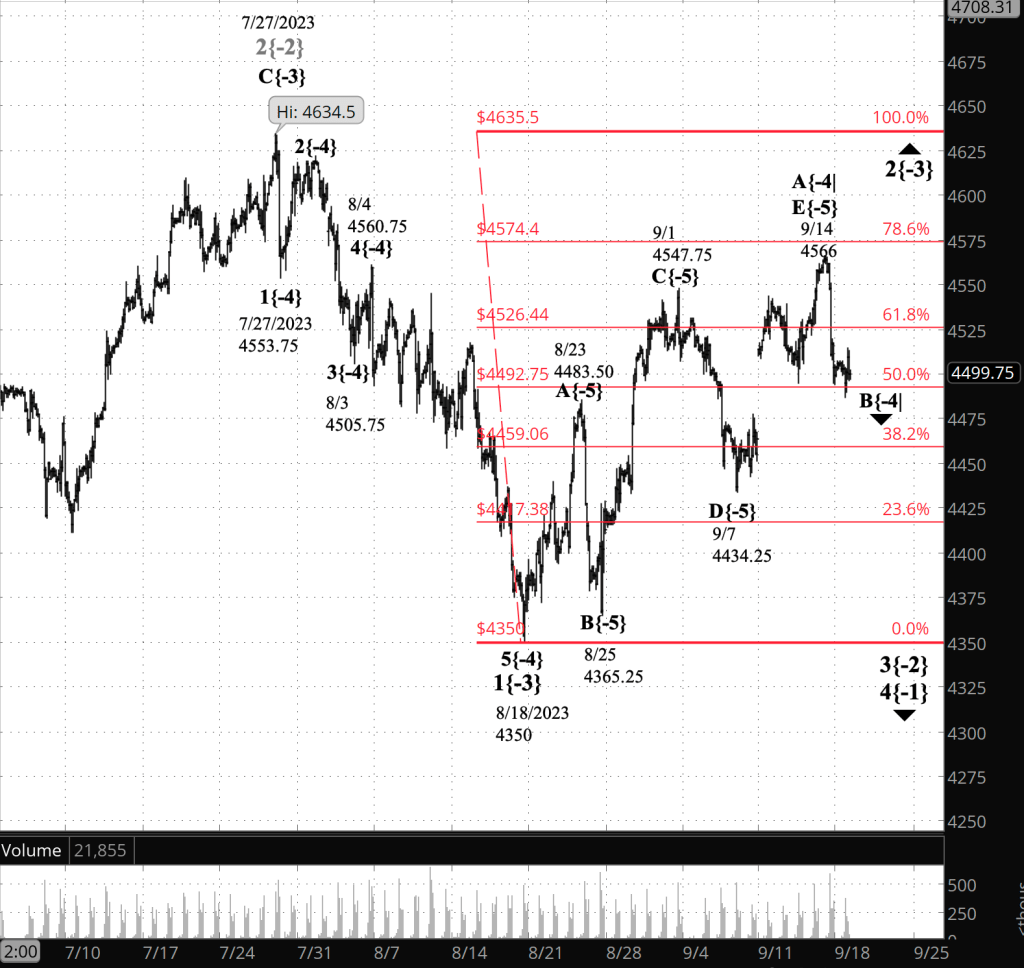
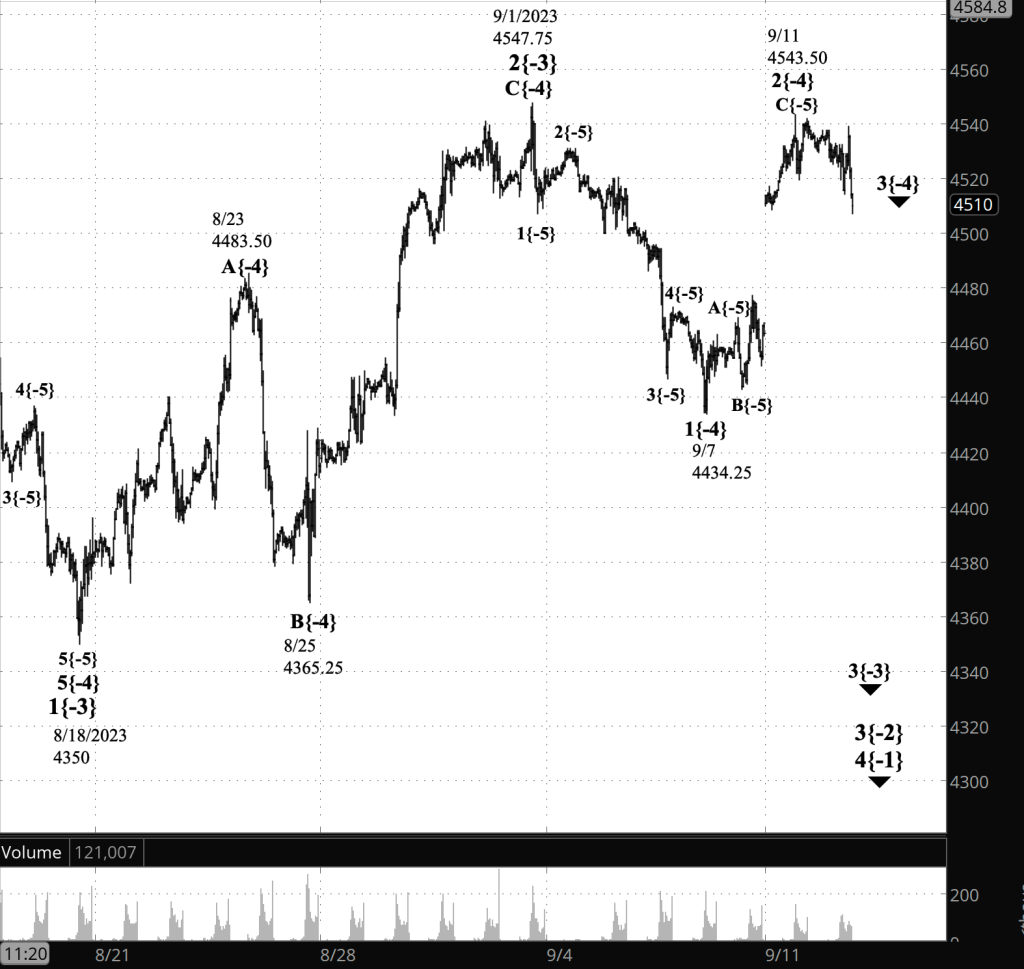
The decline confirms this configuration of waves in progress: The 3rd subwave, wave C{-5}, within the larger middle subwave, wave B{-4}, within the upward correction, wave 2{-3}, that began on August 18.

The configuration is unchanged from this morning’s analysis. I’ve updated the chart.

9:35 a.m. New York time

What’s happening now? The S&P 500 E-mini futures fell to the 4480s overnight and then rose back above 4500.

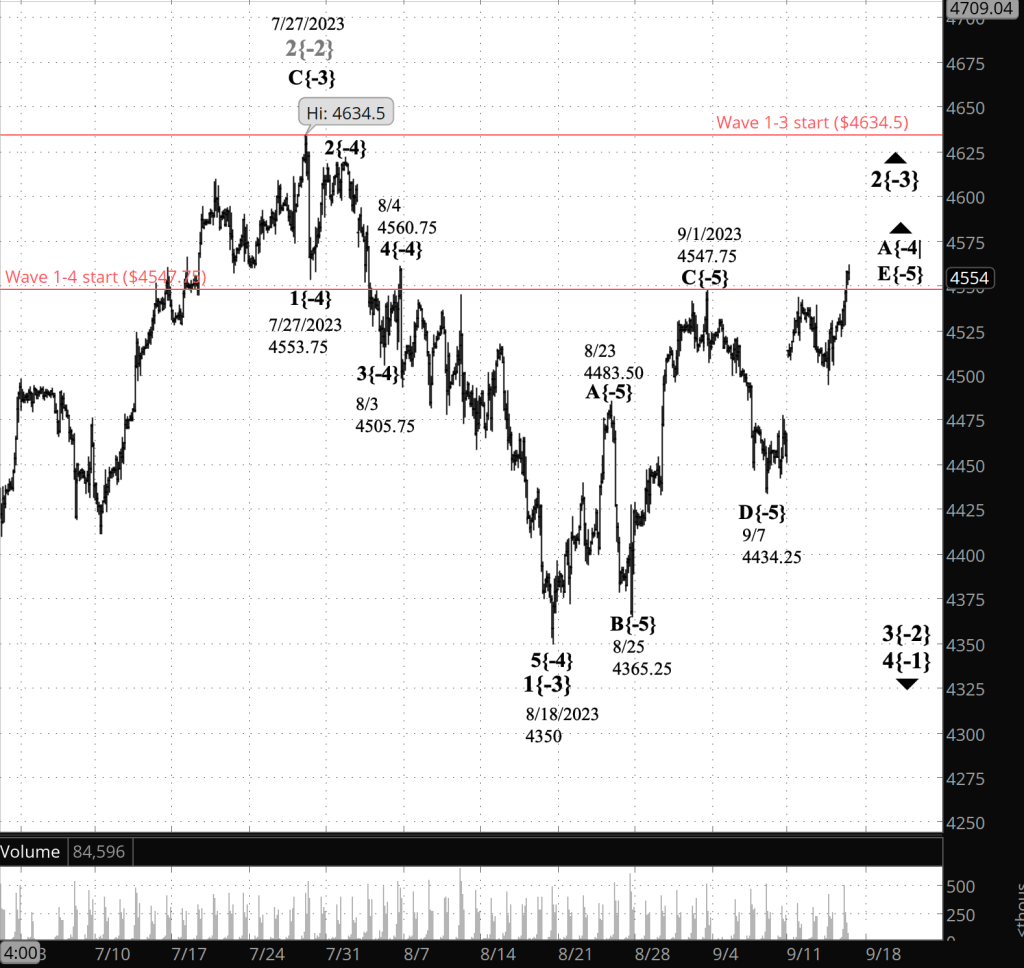
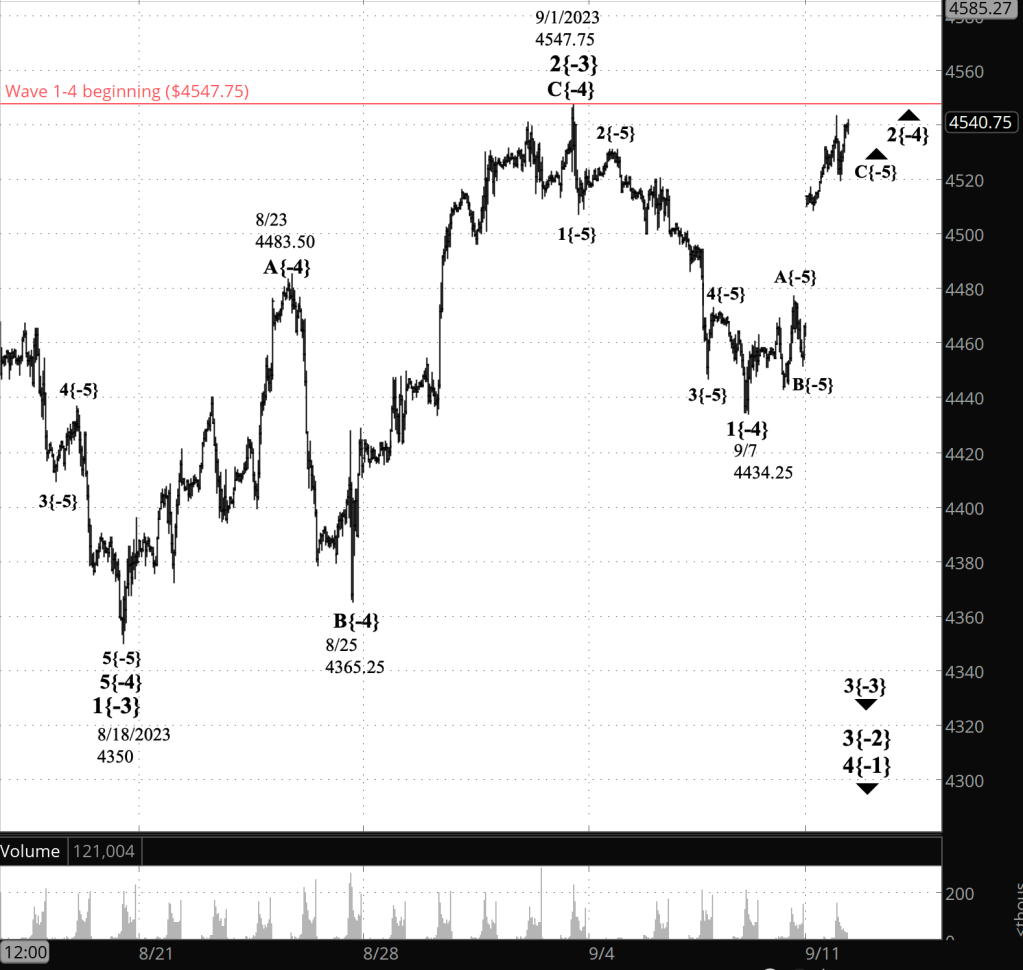
What does it mean? The price has largely fluctuated around the 50% Fibonacci retracement level since September 15 as the middle leg of an upward correction that began on August 18 continues.

The correction is a 2nd wave and internally it is in the B subwave, which in turn is in its smaller C subwave.

Within the B wave, the C subwave is the last of the three subwaves. When it is complete, the larger B subwave will also be complete. The final leg of the corrective pattern will follow, a rising C wave.

The end of the corrective pattern may also be the end of the 2nd wave correction. It could also be the first of two or three corrective patterns if the correction takes a compound form.

When the 2nd wave correction is complete, it will be followed by a powerful downtrending 3rd wave.

What are the alternatives? It’s possible that the entire corrective pattern ended at the September 14 high. If so, then either the 3rd wave downtrend has begun or the connector wave in a compound correction is underway.

[S&P 500 E-mini futures at 3:30 p.m., 2-hour bars, with volume]

What does Elliott wave theory say? Here are the waves that underly the analyses.

Principal Analysis:

  • A downtrend wave 3{-2}, began on July 27 and is underway.
  • Within wave 3{-2}, wave 2{-3}, an upward correction, began on August 18 and is in its middle subwave, declining wave B{-4}.
  • The corrective pattern is taking the form of a Zigzag, with five subwaves within wave A{-4}.

Alternative Analysis.

  • Wave 2(-3} ended on September 14.
  • The decline that followed is either downtrending wave wave 3{-3} or a connector wave X{-4} within a compound correction.

Big picture:

  • The wave 3{-2} downtrend is a subwave of wave 4{-1}, a downtrend that began on January 4, 2022.
  • Wave 4{-1}, in turn, is a subwave of wave 5{0}, an expanding Diagonal Triangle that began on December 26, 2018.
  • Wave 4{-1} may eventually reach the lower boundary of wave 5{0}, presently slightly below 1800 and declining further each day.
  • Wave 4{-1} will be followed by rising wave 5{-1}, the final wave in the Triangle.

We Are Here.

These are the waves currently in progress under my principal analysis. Each line on the list shows the wave number, with the subscript in curly brackets, the traditional degree name, the starting date, the starting price of the S&P 500 E-mini futures, and the direction of the wave.

  • S&P 500 Index:
  • 5{+3} Supercycle, 7/8/1932, 4.40 (up)
  • 5{+2} Cycle, 12/9/1974, 60.96 (up)
  • 5{+1} Primary, 3/6/2009, 666.79 (up)
  • 5{0} Intermediate, 12/26/2018, 2346.58 (up)
  • S&P 500 Futures and index:
  • 4{-1} Minor, 1/4/2022, 4953.25 (down) (futures), 4818.62 (down) (index)
  • S&P 500 Futures:
  • 3{-2} Minute, 7/27/2023, 3502 (down)

Reading the chart. Price movements — waves – – in Elliott wave analysis are labeled with numbers within trending waves and letters with corrective waves. The subscripts — numbers in curly brackets — designate the wave’s degree, which, in Elliott wave analysis, means the relative position of a wave within the larger and smaller structures that make up the chart. R.N. Elliott, who in the 1930s developed the form of analysis that bears his name, viewed the chart as a complex structure of smaller waves nested within larger waves, which in turn are nested within still larger waves. In mathematics it’s called a fractal structure, where at every scale the pattern is similar to the others.

Learning and other resources. Elliott wave analysis provides context, not prophecy. As the 20th century semanticist Alfred Korzybski put it in his book Science and Sanity (1933), “The map is not the territory … The only usefulness of a map depends on similarity of structure between the empirical world and the map.” And I would add, in the ever-changing markets, we can judge that similarity of structure only after the fact.

See the menu page Analytical Methods for a rundown on where to go for information on Elliott wave analysis.

By Tim Bovee, Portland, Oregon, September 20, 2023

Disclaimer

Tim Bovee, Private Trader tracks the analysis and trades of a private trader for his own accounts. Nothing in this blog constitutes a recommendation to buy or sell stocks, options or any other financial instrument. The only purpose of this blog is to provide education and entertainment.

No trader is ever 100 percent successful in his or her trades. Trading in the stock and option markets is risky and uncertain. Each trader must make trading decisions for his or her own account, and take responsibility for the consequences.

License
Creative Commons License

All content on Tim Bovee, Private Trader by Timothy K. Bovee is licensed under a Creative Commons Attribution-ShareAlike 4.0 International License.

Based on a work at www.timbovee.com.

Trader’s Notebook

3:30 p.m. New York time

Half an hour before the closing bell. The S&P 500 futures fell to 4462.25 during the session, coming close to the 38.2% Fibonacci retracement level, and then reversed, approaching 4500.

The B wave within the present 2nd wave downward correction can be expected to have three subwaves, and the decline gives the chart all three: down — sideways with a small upward movement — down further.

The question yet to be answered is whether or not that “down further” subwave is in fact complete. If yes, then I expect a rise back into the 4560s and perhaps higher. If not, then I expect a drop back into the low 4460s and perhaps lower.

I’ve updated the chart.

9:35 a.m. New York time

What’s happening now? The S&P 500 E-mini futures traded narrowly overnight, remaining close to the 4500 mark.

What does it mean? The price kept the upward correction that began on August 18 slightly above the 50% retracement level until the opening bell aproached, and then fell below that level.. The 2nd wave correction is in its declining B wave, the middle subwave of three.

The corrective pattern has taken the form of a Zigzag. Under the rules of Elliott Wave Theory, the price will remain 4350, the start of the correction. If the price moves below that level, then the analysis no longer matches the chart and will be redone.

The B wave, when complete, will be followed by a rising C wave that llkely will carry the price above the correction high set by the A wave, 4566.

When wave C is complete, either a powerful downtrend, a 3rd wave, will begin, or a connector, an X wave, will link the completed first corrective pattern with a corrective pattern within a compound correction.

What are the alternatives? It’s possible that the entire corrective pattern ended at the September 14 high. If so, then either the 3rd wave downtrend has begun or the connector wave in a compound correction is underway.

[S&P 500 E-mini futures at 3:30 o.m., 2-hour bars, with volume]

What does Elliott wave theory say? Here are the waves that underly the analyses.

Principal Analysis:

  • A downtrend wave 3{-2}, began on July 27 and is underway.
  • Within wave 3{-2}, wave 2{-3}, an upward correction, began on August 18 and is in its middle subwave, declining wave B{-4}.
  • The corrective pattern is taking the form of a Zigzag, with five subwaves within wave A{-4}.

Alternative Analysis.

  • Wave 2(-3} ended on September 14.
  • The decline that followed is either downtrending wave wave 3{-3} or a connector wave X{-4} within a compound correction.

Big picture:

  • The wave 3{-2} downtrend is a subwave of wave 4{-1}, a downtrend that began on January 4, 2022.
  • Wave 4{-1}, in turn, is a subwave of wave 5{0}, an expanding Diagonal Triangle that began on December 26, 2018.
  • Wave 4{-1} may eventually reach the lower boundary of wave 5{0}, presently slightly below 1800 and declining further each day.
  • Wave 4{-1} will be followed by rising wave 5{-1}, the final wave in the Triangle.

We Are Here.

These are the waves currently in progress under my principal analysis. Each line on the list shows the wave number, with the subscript in curly brackets, the traditional degree name, the starting date, the starting price of the S&P 500 E-mini futures, and the direction of the wave.

  • S&P 500 Index:
  • 5{+3} Supercycle, 7/8/1932, 4.40 (up)
  • 5{+2} Cycle, 12/9/1974, 60.96 (up)
  • 5{+1} Primary, 3/6/2009, 666.79 (up)
  • 5{0} Intermediate, 12/26/2018, 2346.58 (up)
  • S&P 500 Futures and index:
  • 4{-1} Minor, 1/4/2022, 4953.25 (down) (futures), 4818.62 (down) (index)
  • S&P 500 Futures:
  • 3{-2} Minute, 7/27/2023, 3502 (down)

Reading the chart. Price movements — waves – – in Elliott wave analysis are labeled with numbers within trending waves and letters with corrective waves. The subscripts — numbers in curly brackets — designate the wave’s degree, which, in Elliott wave analysis, means the relative position of a wave within the larger and smaller structures that make up the chart. R.N. Elliott, who in the 1930s developed the form of analysis that bears his name, viewed the chart as a complex structure of smaller waves nested within larger waves, which in turn are nested within still larger waves. In mathematics it’s called a fractal structure, where at every scale the pattern is similar to the others.

Learning and other resources. Elliott wave analysis provides context, not prophecy. As the 20th century semanticist Alfred Korzybski put it in his book Science and Sanity (1933), “The map is not the territory … The only usefulness of a map depends on similarity of structure between the empirical world and the map.” And I would add, in the ever-changing markets, we can judge that similarity of structure only after the fact.

See the menu page Analytical Methods for a rundown on where to go for information on Elliott wave analysis.

By Tim Bovee, Portland, Oregon, September 19, 2023

Disclaimer

Tim Bovee, Private Trader tracks the analysis and trades of a private trader for his own accounts. Nothing in this blog constitutes a recommendation to buy or sell stocks, options or any other financial instrument. The only purpose of this blog is to provide education and entertainment.

No trader is ever 100 percent successful in his or her trades. Trading in the stock and option markets is risky and uncertain. Each trader must make trading decisions for his or her own account, and take responsibility for the consequences.

License
Creative Commons License

All content on Tim Bovee, Private Trader by Timothy K. Bovee is licensed under a Creative Commons Attribution-ShareAlike 4.0 International License.

Based on a work at www.timbovee.com.

Trader’s Notebook

3:30 p.m. New York time

Half an hour before the closing bell. The S&P 500 futures rose by nearly 30 points during the session and then dropped back slightly, remaining above the 50% Fibonacci retracement level.

This morning’s analysis stands unchanged. I’ve updated the chart.

9:35 a.m. New York time

What’s happening now? The S&P 500 E-mini futures initially traded sideways overnight and then began to fall, from slightly above 4500 down into the 4480s.

What does it mean? The middle of three subwaves within an upward 2nd wave correction that began on August 18 continues, reaching below the 50% Fibonacci retracement level. (The Fibonacci ladder is shown on the chart in red.)

That middle wave is a declining B wave that began on September 14 from 4566. It will be followed by a rising C wave that most likely will rise above the B wave’s starting point and will complete the corrective pattern.

What is the alternative? It’s possible that the entire corrective pattern ended at the September 14 high. If so, then either a 3rd wave downtrend has begun or the upward correction is taking a compound form, with two or three corrective patterns within it.

[S&P 500 E-mini futures at 3:30 p.m., 2-hour bars, with volume]

What does Elliott wave theory say? Here are the waves that underly the analyses.

Principal Analysis:

  • A downtrend wave 3{-2}, began on July 27 and is underway.
  • Within wave 3{-2}, wave 2{-3}, an upward correction, began on August 18 and is in its middle subwave, declining wave B{-4}.
  • The corrective pattern is taking the form of a Zigzag, with five subwaves within wave A{-4}.

Alternative Analysis.

  • Wave 2(-3} ended on September 14.
  • The decline that followed is either downtrending wave wave 3{-3} or a connector wave X{-4} within a compound correction.

Big picture:

  • The wave 3{-2} downtrend is a subwave of wave 4{-1}, a downtrend that began on January 4, 2022.
  • Wave 4{-1}, in turn, is a subwave of wave 5{0}, an expanding Diagonal Triangle that began on December 26, 2018.
  • Wave 4{-1} may eventually reach the lower boundary of wave 5{0}, presently slightly below 1800 and declining further each day.
  • Wave 4{-1} will be followed by rising wave 5{-1}, the final wave in the Triangle.

We Are Here.

These are the waves currently in progress under my principal analysis. Each line on the list shows the wave number, with the subscript in curly brackets, the traditional degree name, the starting date, the starting price of the S&P 500 E-mini futures, and the direction of the wave.

  • S&P 500 Index:
  • 5{+3} Supercycle, 7/8/1932, 4.40 (up)
  • 5{+2} Cycle, 12/9/1974, 60.96 (up)
  • 5{+1} Primary, 3/6/2009, 666.79 (up)
  • 5{0} Intermediate, 12/26/2018, 2346.58 (up)
  • S&P 500 Futures and index:
  • 4{-1} Minor, 1/4/2022, 4953.25 (down) (futures), 4818.62 (down) (index)
  • S&P 500 Futures:
  • 3{-2} Minute, 7/27/2023, 3502 (down)

Reading the chart. Price movements — waves – – in Elliott wave analysis are labeled with numbers within trending waves and letters with corrective waves. The subscripts — numbers in curly brackets — designate the wave’s degree, which, in Elliott wave analysis, means the relative position of a wave within the larger and smaller structures that make up the chart. R.N. Elliott, who in the 1930s developed the form of analysis that bears his name, viewed the chart as a complex structure of smaller waves nested within larger waves, which in turn are nested within still larger waves. In mathematics it’s called a fractal structure, where at every scale the pattern is similar to the others.

Learning and other resources. Elliott wave analysis provides context, not prophecy. As the 20th century semanticist Alfred Korzybski put it in his book Science and Sanity (1933), “The map is not the territory … The only usefulness of a map depends on similarity of structure between the empirical world and the map.” And I would add, in the ever-changing markets, we can judge that similarity of structure only after the fact.

See the menu page Analytical Methods for a rundown on where to go for information on Elliott wave analysis.

By Tim Bovee, Portland, Oregon, September 18, 2023

Disclaimer

Tim Bovee, Private Trader tracks the analysis and trades of a private trader for his own accounts. Nothing in this blog constitutes a recommendation to buy or sell stocks, options or any other financial instrument. The only purpose of this blog is to provide education and entertainment.

No trader is ever 100 percent successful in his or her trades. Trading in the stock and option markets is risky and uncertain. Each trader must make trading decisions for his or her own account, and take responsibility for the consequences.

License
Creative Commons License

All content on Tim Bovee, Private Trader by Timothy K. Bovee is licensed under a Creative Commons Attribution-ShareAlike 4.0 International License.

Based on a work at www.timbovee.com.

Trader’s Notebook

3:30 p.m. New York time

Half an hour before the closing bell. The S&P 500 futures fell during the session, reaching the 4490s, near the 50% Fibonacci retracement level.

The strength of the decline suggests that the overnight peak, 4566, was the end of the first subwave, wave A{-4}, within the upward correction, wave 2{-3}, that began on August 18. As a result, I’ve promoted this morning’s alternative analysis to the position of principal analysis. Wave B{-4}, the declining middle subwave, is now in progress.

A B-wave is subject to two rules in Elliott Wave Theory.

  • If it’s a Zigzag pattern, with five subwaves within the A-wave, then the B-wave cannot fall beyond the starting point of the A wave. In this case, that would set an absolute lower limit of 4350.
  • If it’s a Flat pattern, with three subwaves in the A-wave, then the B wave must retrace at least 90% of the previous A-wave. In this case, that sets an absolute minimum decline to 4371.75.

On the chart, I’ve labeled five subwaves within wave A{-4}. That’s the count of a Zigzag. If I squint my eyes real hard, after a couple of beers, I can see a way to count three subwaves total within wave A{-4}, the count of a Flat.

The Zigzag seems to me to be the best match for the reality of the chart. But of course, I’ve had charts overturn best matches before, and no doubt will again. So I shall treat the Flat scenario as an alternative analysis.

I’ve updated the chart, retaining its Zigzag scenario labeling.

9:35 a.m. New York time

What’s happening now? The S&P 500 E-mini futures fell overnight from the 4560s to the 4540s, and fell further as the opening bell sounded.

What does it mean? At its high point the price came to within 10 points of the 78.6% Fibonacci retracement level, a common reversal point for corrections, such as the one now underway. (The Fibonacci ladder appears on the chart in red.)

The upward correction that began on August 18, a 2nd wave, is now in the 5th subwave of its 1st of three segments of a corrective pattern. The present rising A wave will be followed by a declining B wave and a rising C wave that will complete the corrective pattern.

The present A wave has taken a month so far, suggesting that the corrective pattern will likely continue into the depths of winter. No guarantees, of course. Although waves within a pattern tend to be of roughly similar magnitude, there can still be quite a bit of variety among them.

What is the alternative? It is possible that the overnight peak, 4566, was the end of the A wave and that the B wave has begun. Promoted to the principal analysis in the afternoon posting.

[S&P 500 E-mini futures at 3:30 p.m., 2-hour bars, with volume]

What does Elliott wave theory say? Here are the waves that underly the analyses, updated for the afternoon.

Principal Analysis:

  • A downtrend wave 3{-2}, began on July 27 and is underway.
  • Within wave 3{-2}, wave 2{-3}, an upward correction, began on August 18 and is in its middle subwave, declining wave B{-4}.
  • The corrective pattern is taking the form of a Zigzag, with five subwaves within wave A{-4}.

Alternative Analysis:

  • The corrective pattern is taking the form of a Flat, with three subwaves within wave A{-4}.

Big picture:

  • The wave 3{-2} downtrend is a subwave of wave 4{-1}, a downtrend that began on January 4, 2022.
  • Wave 4{-1}, in turn, is a subwave of wave 5{0}, an expanding Diagonal Triangle that began on December 26, 2018.
  • Wave 4{-1} may eventually reach the lower boundary of wave 5{0}, presently slightly below 1800 and declining further each day.
  • Wave 4{-1} will be followed by rising wave 5{-1}, the final wave in the Triangle.

We Are Here.

These are the waves currently in progress under my principal analysis. Each line on the list shows the wave number, with the subscript in curly brackets, the traditional degree name, the starting date, the starting price of the S&P 500 E-mini futures, and the direction of the wave.

  • S&P 500 Index:
  • 5{+3} Supercycle, 7/8/1932, 4.40 (up)
  • 5{+2} Cycle, 12/9/1974, 60.96 (up)
  • 5{+1} Primary, 3/6/2009, 666.79 (up)
  • 5{0} Intermediate, 12/26/2018, 2346.58 (up)
  • S&P 500 Futures and index:
  • 4{-1} Minor, 1/4/2022, 4953.25 (down) (futures), 4818.62 (down) (index)
  • S&P 500 Futures:
  • 3{-2} Minute, 7/27/2023, 3502 (down)

Reading the chart. Price movements — waves – – in Elliott wave analysis are labeled with numbers within trending waves and letters with corrective waves. The subscripts — numbers in curly brackets — designate the wave’s degree, which, in Elliott wave analysis, means the relative position of a wave within the larger and smaller structures that make up the chart. R.N. Elliott, who in the 1930s developed the form of analysis that bears his name, viewed the chart as a complex structure of smaller waves nested within larger waves, which in turn are nested within still larger waves. In mathematics it’s called a fractal structure, where at every scale the pattern is similar to the others.

Learning and other resources. Elliott wave analysis provides context, not prophecy. As the 20th century semanticist Alfred Korzybski put it in his book Science and Sanity (1933), “The map is not the territory … The only usefulness of a map depends on similarity of structure between the empirical world and the map.” And I would add, in the ever-changing markets, we can judge that similarity of structure only after the fact.

See the menu page Analytical Methods for a rundown on where to go for information on Elliott wave analysis.

By Tim Bovee, Portland, Oregon, September 15, 2023

Disclaimer

Tim Bovee, Private Trader tracks the analysis and trades of a private trader for his own accounts. Nothing in this blog constitutes a recommendation to buy or sell stocks, options or any other financial instrument. The only purpose of this blog is to provide education and entertainment.

No trader is ever 100 percent successful in his or her trades. Trading in the stock and option markets is risky and uncertain. Each trader must make trading decisions for his or her own account, and take responsibility for the consequences.

License
Creative Commons License

All content on Tim Bovee, Private Trader by Timothy K. Bovee is licensed under a Creative Commons Attribution-ShareAlike 4.0 International License.

Based on a work at www.timbovee.com.

Trader’s Notebook

3:30 p.m.New York time

Half an hour before the closing bell. A major reanalysis of the S&P 500 futures, the second in one day.

The futures rose above 4745.75, for a second time violating a rule of Elliott Wave Theory: A 2nd wave can’t move above the start of the preceding 1st wave of the same degree. If it does, then something else is going on. The map no longer matches the territory and must be redrawn. The analysis no longer matches the chart and must be revised.

As was the case with this morning’s revision, and all of the revisions I recall over\r the past few years, the relative size of waves within the fractal structure — their degree — is where the map’s precision fails In Elliott wave analysis there is no certainty about the degree until later events unfold. Before then, the degree is a guess. And that is why in every Trader’s Notebook edition that I post contains a caveat: “Elliott wave analysis provides context, not prophecy.” Which is doubly true today.

In the discussion that follows I’ll be using the labeling system that appears on the chart. For a brief explanation of how it works, see the “Reading the chart” section further down.

The revision was triggered on the futures when wave 2{-4}, an upward correction, moved above the starting point of wave 1{-4}, a peak attained on July 27. Such a breakout hasn’t occurred on the S&P 500 index.

In this analysis I’ve chosen to go with the futures. The futures have risen less than cents above what was the wave 1[-4} starting point, staying within their 25-cent minimum move. However, the index, with a 1-cent minimum move, remains more than 100 points below the corresponding starting point.

That tells me that something real is happening over and above the granularity of the two products. The continual trading of the futures provide information missing from the index, and then lends credence to the futures. Could that be the wrong choice? Of course, and if it is we’ll all find out as the price progresses. Meanwhile, it’s an anomaly, a coin toss, and as the coin rose I called futures.

Going forward, the main implication of the new analysis is that the present upward correction is larger than it first appeared to be. The upward potential will be with us longer, and the net major downtrend has been pushed further into the future.

But the downtrend will arrive, eventually,and the key syllable is “trend”, A trend is always more powerful than a correction, and as a trader who is profoundly averse to a buy-and-hold strategy, I tend to treat my trades during a correction as short-term ventures.

Here’s the revised chart. I’ve kept this morning’s chart below for readers wanting to compare the two.

[S&P 500 E-mini futures at 3:30 p.m., 50-minute bars, with volume]

Here are the changes I’ve made in this afternoon’s analysis:

  • Within wave 2{-3}, an upward correction that began on August 18…
    • The rise that began on August 18 has been changed from being in its third and final wave, wave C{-4}, to being in wave A{-4}, its first subwave.
    • The September 1 peak, which had been labeled wave A{-5}, the first subwave of the correction, has been labeled as wave C{-5}, a subwave of wave A{-4}, the first subwave of the wave 2{-3} upward correction.
    • The September 7 low, previously labeled as wave 1{-1}, the end of the first subwave of a downtrend, wave 3{-3}, which began on September 1, is now the end of wave D{-5}, the fourth of five subwaves within wave A{-4}, the first subwave of the wave 2{-3} upward correction.

Basically, everything was shifted up a degree, which required some smaller changes.

Here is revised Principal analysis summary:

  • A downtrend wave 3{-2}, began on July 27 and is underway.
  • Within wave 3{-2}, wave 2{-3}, an upward correction, began on August 18 and is in its first subwave, wave A{-4}.
  • Wave A{-4} is in its final subwave, rising wave E{-5}.

I’ve known people who reject Elliott wave analysis because it’s analysis can require revision at the drop of a hat. Their observation is true, and I think of it as being both the gift and the curse of Elliott Wave Theory. A gift because unlike other methods, Elliott clearly signals when its wrong. A curse because things are often uncertain, and that can make analysis difficult.

10:25 a.m. New York time

BSX options exit. I’ve exited my short iron condor position on BSX for a 100% profit and have updated the entry analysis with full details.

10 a.m. New York time

Note: This morning’s analysis, below, has been overtaken by events. See the afternoon analysis, above, ofr a discussion of what has changed.

What’s happening now? The S&P 500 E-mini futures rose overnight, moving above the September11 high of 4543.50 as the opening bell approached and touched the September 1 high, 4547.75. The S&P 500 index moved above its September 11 high, 4490.27, but remained well below its September 1 high, 4541.25.

What does it mean? Under the rules of Elliott wave analysis, a 2nd wave cannot move above the beginning of the preceding 1sst wave. If it a does, then the chart must be revised.

The higher high means that the 2nd wave upward correction that began on September 7 is still underway on both the futures and the index charts. The 3rd wave downtrend that began on September 1 came close being eclipsed by a higher high on the futures, but the rise did not move above that high, so that upward movement’s labeling remains intact.

In Elliott wave labeling terminology, here are the changes:

  • Downtrending wave 3{-4} has not yet begun.
  • An upward correction that began on September 7, Wave 2{-4}, is still underway.
  • Wave 2{-4} internally is in wave C{-4}, the final wave of the corrective pattern.

This is all happening within a larger downtrend, wave 3{-3}, that began on September 1 and that is a subwave of a still larger downtrend, wave 3{-2}, that began on July 27.

What are the alternatives? If the price on the futures rises above its high so far today, 4547.75, it will have moved above the start of the preceding 1st wave, on September 1 from 4547.75. The index remains well bellow the peak of the corresponding1st wave.

That creates a dilemma. The futures move in 25-cent increments, and the index, in 1-cent increments. In terms of price, the index has far more granularity. However, the futures trade 24-7 except for weekends, the index trades from 9:30 a.m. to 3 p.m. New York time. In terms of time, the futures have greater completeness than does the index.

So if that peak is exceeded on the futures but not the index, which do we believe? Good question. Still thinking about it.

[Note that this chart’s anlysis has been overtaken by events. See above for the latest.]

[S&P 500 E-mini futures at 10 a.m., 50-minute bars, with volume]

What does Elliott wave theory say? This section’s Principal analysis has been outdated by a revised analysis posted in the afternoon edition. I’ve retained it for readers wanting to run a detailed comparison of the two analysis

Here are the waves that underly the analyses as laid out in the morning analysis. See above for the afternoon revision of the Principal analysis.

Principal analysis

  • A downtrend wave 3{-2}, began on July 27 is underway.
  • Within wave 3{-2}, wave 3{-3}, a powerful downtrend, began on September 1 and is in its second subwave, wave 2{-4}, an upward correction that began on September 11.
  • By one count, wave 2{-4} is in its final subwave, rising wave C{-5}, but it’s also possible that declining wave B{-5} is still underway.

Big picture

  • Both the wave 2{-2} correction and wave 3{-2} downtrend are subwaves of wave 4{-1}, a downtrend that began on January 4, 2022.
  • Wave 4{-1}, in turn, is a subwave of wave 5{0}, an expanding Diagonal Triangle that began on December 26, 2018.
  • Wave 4{-1} may eventually reach the lower boundary of wave 5{0}, presently slightly below 1800 and declining further each day.
  • Wave 4{-1} will be followed by rising wave 5{-1}, the final wave in the Triangle.

We Are Here.

These are the waves currently in progress under my principal analysis. Each line on the list shows the wave number, with the subscript in curly brackets, the traditional degree name, the starting date, the starting price of the S&P 500 E-mini futures, and the direction of the wave.

  • S&P 500 Index:
  • 5{+3} Supercycle, 7/8/1932, 4.40 (up)
  • 5{+2} Cycle, 12/9/1974, 60.96 (up)
  • 5{+1} Primary, 3/6/2009, 666.79 (up)
  • 5{0} Intermediate, 12/26/2018, 2346.58 (up)
  • S&P 500 Futures and index:
  • 4{-1} Minor, 1/4/2022, 4953.25 (down) (futures), 4818.62 (down) (index)
  • S&P 500 Futures:
  • 3{-2} Minute, 7/27/2023, 3502 (down)

Reading the chart. Price movements — waves – – in Elliott wave analysis are labeled with numbers within trending waves and letters with corrective waves. The subscripts — numbers in curly brackets — designate the wave’s degree, which, in Elliott wave analysis, means the relative position of a wave within the larger and smaller structures that make up the chart. R.N. Elliott, who in the 1930s developed the form of analysis that bears his name, viewed the chart as a complex structure of smaller waves nested within larger waves, which in turn are nested within still larger waves. In mathematics it’s called a fractal structure, where at every scale the pattern is similar to the others.

Learning and other resources. Elliott wave analysis provides context, not prophecy. As the 20th century semanticist Alfred Korzybski put it in his book Science and Sanity (1933), “The map is not the territory … The only usefulness of a map depends on similarity of structure between the empirical world and the map.” And I would add, in the ever-changing markets, we can judge that similarity of structure only after the fact.

See the menu page Analytical Methods for a rundown on where to go for information on Elliott wave analysis.

By Tim Bovee, Portland, Oregon, September 14, 2023

Disclaimer

Tim Bovee, Private Trader tracks the analysis and trades of a private trader for his own accounts. Nothing in this blog constitutes a recommendation to buy or sell stocks, options or any other financial instrument. The only purpose of this blog is to provide education and entertainment.

No trader is ever 100 percent successful in his or her trades. Trading in the stock and option markets is risky and uncertain. Each trader must make trading decisions for his or her own account, and take responsibility for the consequences.

License
Creative Commons License

All content on Tim Bovee, Private Trader by Timothy K. Bovee is licensed under a Creative Commons Attribution-ShareAlike 4.0 International License.

Based on a work at www.timbovee.com.

Trader’s Notebook

3:30 p.m. New York time

Half an hour before the closing bell. The S&P 500 futures worked their way back in to the 4530s during the session and then returned to below 4510.

The price completed a small trending wave containing five subwaves. I’ve altered this morning’s count by pushing those subwaves down one degree, to {-6}, making the overnight low the end of wave 1{-5}. An upward correction, wave 2{-5}, is now underway.

Otherwise, this morning’s analysis stands. I’ve updated the chart.

9:35 a.m. New York time

What’s happening now? The S&P 500 E-mini futures traded sideways overnight, whipsawing briefing after new inflation numbers were released and then quickly returning to the 4510s, where the price had spent most of its time since the last session closed.

At the opening bell the price rose into the 4120s.

What does it mean? The decline that began on September 11, the beginning of a 3rd wave downtrend, is now in its 3rd subwave. A 4th wave upward correction and a 5th wave decline lie ahead.

This is happening within a larger 3rd wave downtrend that began on September 1.

What are the alternatives? Corrections typically complete on corrective pattern and their done. Some corrections stretch out with two or three corrective patterns, each separated from its predecessor by a connecting wave. That could be the case here.

[S&P 500 E-mini futures at 3:30 p.m., 45-minute bars, with volume]

What does Elliott wave theory say? Here are the waves that underly the analyses.

Principal analysis

  • A downtrend wave 3{-2}, began on July 27 is underway.
  • Within wave 3{-2}, wave 3{-3}, a powerful downtrend, began on September 1 and is in its third subwave, wave 3{-4}, which is downtrending.
  • Internally, wave 3{-4} is now in wave 2{-5}.

Alternative analysis

  • The end of wave C{-5} ends the first corrective pattern within wave 2{-4}. The subsequent decline is a connector, wave X{-5}, which will be followed by second corrective pattern in a compound correction.

Big picture

  • Both the wave 2{-2} correction and wave 3{-2} downtrend are subwaves of wave 4{-1}, a downtrend that began on January 4, 2022.
  • Wave 4{-1}, in turn, is a subwave of wave 5{0}, an expanding Diagonal Triangle that began on December 26, 2018.
  • Wave 4{-1} may eventually reach the lower boundary of wave 5{0}, presently slightly below 1800 and declining further each day.
  • Wave 4{-1} will be followed by rising wave 5{-1}, the final wave in the Triangle.

We Are Here.

These are the waves currently in progress under my principal analysis. Each line on the list shows the wave number, with the subscript in curly brackets, the traditional degree name, the starting date, the starting price of the S&P 500 E-mini futures, and the direction of the wave.

  • S&P 500 Index:
  • 5{+3} Supercycle, 7/8/1932, 4.40 (up)
  • 5{+2} Cycle, 12/9/1974, 60.96 (up)
  • 5{+1} Primary, 3/6/2009, 666.79 (up)
  • 5{0} Intermediate, 12/26/2018, 2346.58 (up)
  • S&P 500 Futures and index:
  • 4{-1} Minor, 1/4/2022, 4953.25 (down) (futures), 4818.62 (down) (index)
  • S&P 500 Futures:
  • 3{-2} Minute, 7/27/2023, 3502 (down)

Reading the chart. Price movements — waves – – in Elliott wave analysis are labeled with numbers within trending waves and letters with corrective waves. The subscripts — numbers in curly brackets — designate the wave’s degree, which, in Elliott wave analysis, means the relative position of a wave within the larger and smaller structures that make up the chart. R.N. Elliott, who in the 1930s developed the form of analysis that bears his name, viewed the chart as a complex structure of smaller waves nested within larger waves, which in turn are nested within still larger waves. In mathematics it’s called a fractal structure, where at every scale the pattern is similar to the others.

Learning and other resources. Elliott wave analysis provides context, not prophecy. As the 20th century semanticist Alfred Korzybski put it in his book Science and Sanity (1933), “The map is not the territory … The only usefulness of a map depends on similarity of structure between the empirical world and the map.” And I would add, in the ever-changing markets, we can judge that similarity of structure only after the fact.

See the menu page Analytical Methods for a rundown on where to go for information on Elliott wave analysis.

By Tim Bovee, Portland, Oregon, September 13, 2023

Disclaimer

Tim Bovee, Private Trader tracks the analysis and trades of a private trader for his own accounts. Nothing in this blog constitutes a recommendation to buy or sell stocks, options or any other financial instrument. The only purpose of this blog is to provide education and entertainment.

No trader is ever 100 percent successful in his or her trades. Trading in the stock and option markets is risky and uncertain. Each trader must make trading decisions for his or her own account, and take responsibility for the consequences.

License
Creative Commons License

All content on Tim Bovee, Private Trader by Timothy K. Bovee is licensed under a Creative Commons Attribution-ShareAlike 4.0 International License.

Based on a work at www.timbovee.com.

Trader’s Notebook

3:30 p.m. New York time

Half an hour before the closing bell. The S&P 500 futures rose to 4539 during the session and then retreated below 4510. The price remained below the high set on September 11, which I’ve labeled as the end of the upward correction that began on September 7.

No changes to this morning’s analysis. I’ve updated the chart.

9:35 a.m. New York time

What’s happening now? The S&P 500 E-mini futures fell into the 4520s overnight, remaining below the September 11 high.

What does it mean? As my principal analysis I’ve chosen to consider that high, 4543.50, to be the end of the 2nd wave upward correction that began on September 7, counting the correction’s three subwaves as shown on the chart. But it’s ambiguous, and there are other ways of analyzing the price movements.

I chose the end-of-the-correction scenario because the price came so close to the start of the preceding 1st wave — a level no 2nd wave can cross — that there’s very little room for a future C wave.

What are the alternatives? There are three.

Alternative #1: The A-wave scenario

For example, one alternative sees the three subwaves of the upward correction marked on the chart as subwaves of the first leg of the correction — the A wave — within a falling B wave and a rising C wave yet to come.

Alternative #2: Just a little bit higher

I’ve marked the overnight peak as the end of the 2nd wave correction’s C wave, but it’s certainly possible for the price to reduce and move just a little bit higher while remaining below the 1st wave’s starting point.

Alternative #3: A compound correction

Corrections typically complete on corrective pattern and their done. Some corrections stretch out with two or three corrective patterns, each separated from its predecessor by a connecting wave. It could here.

[S&P 500 E-mini futures at 3:30 p.m., 40-minute bars, with volume]

What does Elliott wave theory say? Here are the waves that underly the analyses.

Principal analysis

  • A downtrend wave 3{-2}, began on July 27 is underway.
  • Within wave 3{-2}, wave 3{-3}, a powerful downtrend, began on September 1 and is in its third subwave, wave 3{-4}, which is downtrending.

Alternative #1: The A-wave scenario

  • Wave 2{-4}, the upward correction, has completed its 1st subwave, rising wave A{-5}, and now is in declining wave B{-5}, the second of three subwaves.

Alternative #2: Just a little bit higher

  • The final wave of the upward correction has not yet reached its peak and will rise a few points higher before it is done. Wave C{-5} is still underway.

Alternative #3: A compound correction

  • The end of wave C{-5} ends the first corrective pattern within wave 2{-4}. The subsequent decline is a connector, wave X{-5}, which will be followed by second corrective pattern in a compound correction.

Big picture:

  • Both the wave 2{-2} correction and wave 3{-2} downtrend are subwaves of wave 4{-1}, a downtrend that began on January 4, 2022.
  • Wave 4{-1}, in turn, is a subwave of wave 5{0}, an expanding Diagonal Triangle that began on December 26, 2018.
  • Wave 4{-1} may eventually reach the lower boundary of wave 5{0}, presently slightly below 1800 and declining further each day.
  • Wave 4{-1} will be followed by rising wave 5{-1}, the final wave in the Triangle.

We Are Here.

These are the waves currently in progress under my principal analysis. Each line on the list shows the wave number, with the subscript in curly brackets, the traditional degree name, the starting date, the starting price of the S&P 500 E-mini futures, and the direction of the wave.

  • S&P 500 Index:
  • 5{+3} Supercycle, 7/8/1932, 4.40 (up)
  • 5{+2} Cycle, 12/9/1974, 60.96 (up)
  • 5{+1} Primary, 3/6/2009, 666.79 (up)
  • 5{0} Intermediate, 12/26/2018, 2346.58 (up)
  • S&P 500 Futures and index:
  • 4{-1} Minor, 1/4/2022, 4953.25 (down) (futures), 4818.62 (down) (index)
  • S&P 500 Futures:
  • 3{-2} Minute, 7/27/2023, 3502 (down)

Reading the chart. Price movements — waves – – in Elliott wave analysis are labeled with numbers within trending waves and letters with corrective waves. The subscripts — numbers in curly brackets — designate the wave’s degree, which, in Elliott wave analysis, means the relative position of a wave within the larger and smaller structures that make up the chart. R.N. Elliott, who in the 1930s developed the form of analysis that bears his name, viewed the chart as a complex structure of smaller waves nested within larger waves, which in turn are nested within still larger waves. In mathematics it’s called a fractal structure, where at every scale the pattern is similar to the others.

Learning and other resources. Elliott wave analysis provides context, not prophecy. As the 20th century semanticist Alfred Korzybski put it in his book Science and Sanity (1933), “The map is not the territory … The only usefulness of a map depends on similarity of structure between the empirical world and the map.” And I would add, in the ever-changing markets, we can judge that similarity of structure only after the fact.

See the menu page Analytical Methods for a rundown on where to go for information on Elliott wave analysis.

By Tim Bovee, Portland, Oregon, September 12, 2023

Disclaimer

Tim Bovee, Private Trader tracks the analysis and trades of a private trader for his own accounts. Nothing in this blog constitutes a recommendation to buy or sell stocks, options or any other financial instrument. The only purpose of this blog is to provide education and entertainment.

No trader is ever 100 percent successful in his or her trades. Trading in the stock and option markets is risky and uncertain. Each trader must make trading decisions for his or her own account, and take responsibility for the consequences.

License
Creative Commons License

All content on Tim Bovee, Private Trader by Timothy K. Bovee is licensed under a Creative Commons Attribution-ShareAlike 4.0 International License.

Based on a work at www.timbovee.com.

Trader’s Notebook

3:30 p.m. New York time

Half an hour before the closing bell. The S&P 500 futures reached a session high, so far, of 4543.50, shortly after the opening bell. It then fell back to just below 4520, and rose again.

The movement, designated as a 2nd wave upward correction in Elliott Wave Theory, remained below the starting point of the preceding 1st wave, 4547.75. If the price move above that level, the analysis as it stands now would no longer matche the chart and would be redone.

Meanwhile, this morning’s analysis still stands. I’ve updated the chart.

9:35 a.m. New York time

What’s happening now? When trading resumed overnight, the S&P 500 E-mini futures gapped up by 50 points, at 4514 or a bit more than 1%, and continued to rise, reaching into the 4530s.

What does it mean? The rise invalidates the chart analysis posted on Friday, September 9. Here is how the analysis has changed:

  • The decline from September 1 is raised by one degree, from {-5} to {-4}.
  • The low on September 7 becomes the end of wave 1{-4} within downtrending wave 3{-3}.
  • The gap is the starting point of the 3rd and wave within an upward correction, wave 2{-4}, which is still underway. Maybe. I don’t have great confidence in the labeling of the subwaves within wave 2{-4}.

Under the rules of Elliott Wave Theory, a 2nd wave cannot move above the starting point of the preceding 1st wave, which is 4547.75. If the price does move above that level, then it isn’t a 2nd wave and something else is going on. I’ve marked that level on the chart with a red line.

Caveats: This chart is of the futures, which moves in 25-cent increments. The S&P 500 index moves in 1-cent increments. So it’s possible for a 2nd wave on the futures to move above the start of the preceding 1st wave while the index stays below that level.

If that should happen, then it’s an ambiguity that can only be resolved by the subsequent movement of the price. That’s a long way of saying that the chart has the final say in the matter. What the market does is the territory, and the chart analysis is a map. If the map doesn’t match the territory, then the map must be changed, as is the case today.

Assuming wave 2{-4} remains a valid analysis, it will end soon and will be followed by a wave 3{-4}, a powerful downtrend that will carry the price back to the 4430s and likely quite a distance below that level.

What are the alternatives? It’s possible to count the rise from September 7 as being the 1st subwave within the correction. This scenario leaves a downwave and the a final rising wave to go, with very llittle room for the rising wave to rise.

Reading the chart. Price movements — waves – – in Elliott wave analysis are labeled with numbers within trending waves and letters with corrective waves. The subscripts — numbers in curly brackets — designate the wave’s degree, which, in Elliott wave analysis, means the relative position of a wave within the larger and smaller structures that make up the chart. R.N. Elliott, who in the 1930s developed the form of analysis that bears his name, viewed the chart as a complex structure of smaller waves nested within larger waves, which in turn are nested within still larger waves. In mathematics it’s called a fractal structure, where at every scale the pattern is similar to the others.

[S&P 500 E-mini futures at 3:30 p.m., 40-minute bars, with volume]

What does Elliott wave theory say? Here are the waves that underly the analyses.

Principal analysis

  • A downtrend wave 3{-2}, began on July 27 is underway.
  • Within wave 3{-2}, wave 3{-3}, a powerful downtrend, began on September 1 and is in its second subwave, wave 2{-4}, which is an upward correction.
  • Wave 2{-4} is in its 3rd subwave, rising wave C{-5}

Alternative analysis

  • Wave 2{-4} is in its 1st subwave, rising wave A{-5}

Big picture:

  • Both the wave 2{-2} correction and wave 3{-2} downtrend are subwaves of wave 4{-1}, a downtrend that began on January 4, 2022.
  • Wave 4{-1}, in turn, is a subwave of wave 5{0}, an expanding Diagonal Triangle that began on December 26, 2018.
  • Wave 4{-1} may eventually reach the lower boundary of wave 5{0}, presently slightly below 1800 and declining further each day.
  • Wave 4{-1} will be followed by rising wave 5{-1}, the final wave in the Triangle.

We Are Here.

These are the waves currently in progress under my principal analysis. Each line on the list shows the wave number, with the subscript in curly brackets, the traditional degree name, the starting date, the starting price of the S&P 500 E-mini futures, and the direction of the wave.

  • S&P 500 Index:
  • 5{+3} Supercycle, 7/8/1932, 4.40 (up)
  • 5{+2} Cycle, 12/9/1974, 60.96 (up)
  • 5{+1} Primary, 3/6/2009, 666.79 (up)
  • 5{0} Intermediate, 12/26/2018, 2346.58 (up)
  • S&P 500 Futures and index:
  • 4{-1} Minor, 1/4/2022, 4953.25 (down) (futures), 4818.62 (down) (index)
  • S&P 500 Futures:
  • 3{-2} Minute, 7/27/2023, 3502 (down)

Learning and other resources. Elliott wave analysis provides context, not prophecy. As the 20th century semanticist Alfred Korzybski put it in his book Science and Sanity (1933), “The map is not the territory … The only usefulness of a map depends on similarity of structure between the empirical world and the map.” And I would add, in the ever-changing markets, we can judge that similarity of structure only after the fact.

See the menu page Analytical Methods for a rundown on where to go for information on Elliott wave analysis.

By Tim Bovee, Portland, Oregon, September 11, 2023

Disclaimer

Tim Bovee, Private Trader tracks the analysis and trades of a private trader for his own accounts. Nothing in this blog constitutes a recommendation to buy or sell stocks, options or any other financial instrument. The only purpose of this blog is to provide education and entertainment.

No trader is ever 100 percent successful in his or her trades. Trading in the stock and option markets is risky and uncertain. Each trader must make trading decisions for his or her own account, and take responsibility for the consequences.

License
Creative Commons License

All content on Tim Bovee, Private Trader by Timothy K. Bovee is licensed under a Creative Commons Attribution-ShareAlike 4.0 International License.

Based on a work at www.timbovee.com.

Trader’s Notebook

3:30 p.m. New York time

Half an hour before the closing bell. During the session the S&P 500 futures moved a bit above the overnight high, into the 4470s, and then dropped back by into the 4450s.

On the chart the new peak became the end point of the small 2nd wave correction, wave 2{-6}. Otherwise, this morning’s analysis is unchanged.

I’ve updated the chart.

9:35 a.m. New York time

What’s happening now? The S&P 500 E-mini futures traded between the 4440s and 4460s overnight.

What does it mean? Now in progress: A 3rd-wave downtrend nested within another 3rd waves of larger size. Third waves tend to be the most energetic part of a trend, and I see a lot of power built into this fractal structure.

In my wave labeling system, the wave number is followed by a subscript showing the degree — the relative position — in the fractal structure. The number shows degrees below what the initial developer of Elliott Wave Theory, R.N. Elliott, called the Intermediate degree. The current Intermediate wave is wave 5{0} in my system, which began on December 26, 2018.

From large to small, the waves are structured like this. The largest wave, 4{-1}, began on January 4, 2022. It is the next to the last wave of an expanding Diagonal Triangle, which is the Intermediate wave, 5{0}.

Next down, the wave labeled 3{-2}, began on June 27 of the present year. Within it, wave 3{-3} began on September 1.

Wave 3{-3} is in its first subwave, wave 1{-4}, which is in its final wave down. That final falling wave, 5{-5}, began on September 6 and is in a 3rd wave, wave 3{-6}.

Wave 3{-6} will soon be followed by an upward correction, wave 4{-6}, and then a final declining wave, 5{-6}, which will complete the parent wave, 5{-5}. The grandparent wave, 3{-4}, will roll into a an upward correction, wave 4{-4}, and then a final downtrending wave 5{-4}.

When wave 5{-4} is complete, it will also be the end of the parent wave 1{-4}, which is only the first wave within wave 3{-3}, which will have four more waves to go.

That’s a lot of downside ahead.

What are the alternatives? A new trending wave presents a labeling problem. The wave itself has a clear position within the fractal hierarchy, but what about the 1st subwave? Is it one degree below the main downtrend, or is it two degrees, or even three? And so while the labeling on wave 1{-4} is clear, the labeling one wave lower on the chart, wave 5{-5}, could in fact be two waves lower, 5{-6}, or even three, 5{-7}. Only the passage of time can sort it out.

[S&P 500 E-mini futures at 3:30 p.m., 35-minute bars, with volume]

What does Elliott wave theory say? Here are the waves that underly the analyses.

Principal analysis

  • A downtrend wave 3{-2}, began on July 27 is underway.
  • Internally, wave 3{-2} complete its first subwave, wave 1{-3}, on August 18, and wave 2{-3}, an upward correction, began.
  • Wave 3{-3}, a powerful downtrend, began on September 1 and is in its first subwave, wave 1{-4}.
  • Wave 1{-4} is in its 5th and final subwave, wave 5{-5}, which began on September 6.
  • Internall, wave 5{-5} is in its middle subwave, 3{-6}.

Big picture:

  • Both the wave 2{-2} correction and wave 3{-2} downtrend are subwaves of wave 4{-1}, a downtrend that began on January 4, 2022.
  • Wave 4{-1}, in turn, is a subwave of wave 5{0}, an expanding Diagonal Triangle that began on December 26, 2018.
  • Wave 4{-1} may eventually reach the lower boundary of wave 5{0}, presently slightly below 1800 and declining further each day.
  • Wave 4{-1} will be followed by rising wave 5{-1}, the final wave in the Triangle.

We Are Here.

These are the waves currently in progress under my principal analysis. Each line on the list shows the wave number, with the subscript in curly brackets, the traditional degree name, the starting date, the starting price of the S&P 500 E-mini futures, and the direction of the wave.

  • S&P 500 Index:
  • 5{+3} Supercycle, 7/8/1932, 4.40 (up)
  • 5{+2} Cycle, 12/9/1974, 60.96 (up)
  • 5{+1} Primary, 3/6/2009, 666.79 (up)
  • 5{0} Intermediate, 12/26/2018, 2346.58 (up)
  • S&P 500 Futures and index:
  • 4{-1} Minor, 1/4/2022, 4953.25 (down) (futures), 4818.62 (down) (index)
  • S&P 500 Futures:
  • 3{-2} Minute, 7/27/2023, 3502 (down)

Reading the chart. Price movements — waves – – in Elliott wave analysis are labeled with numbers within trending waves and letters with corrective waves. The subscripts — numbers in curly brackets — designate the wave’s degree, which, in Elliott wave analysis, means the relative position of a wave within the larger and smaller structures that make up the chart. R.N. Elliott, who in the 1930s developed the form of analysis that bears his name, viewed the chart as a complex structure of smaller waves nested within larger waves, which in turn are nested within still larger waves. In mathematics it’s called a fractal structure, where at every scale the pattern is similar to the others.

Learning and other resources. Elliott wave analysis provides context, not prophecy. As the 20th century semanticist Alfred Korzybski put it in his book Science and Sanity (1933), “The map is not the territory … The only usefulness of a map depends on similarity of structure between the empirical world and the map.” And I would add, in the ever-changing markets, we can judge that similarity of structure only after the fact.

See the menu page Analytical Methods for a rundown on where to go for information on Elliott wave analysis.

By Tim Bovee, Portland, Oregon, September 8, 2023

Disclaimer

Tim Bovee, Private Trader tracks the analysis and trades of a private trader for his own accounts. Nothing in this blog constitutes a recommendation to buy or sell stocks, options or any other financial instrument. The only purpose of this blog is to provide education and entertainment.

No trader is ever 100 percent successful in his or her trades. Trading in the stock and option markets is risky and uncertain. Each trader must make trading decisions for his or her own account, and take responsibility for the consequences.

License
Creative Commons License

All content on Tim Bovee, Private Trader by Timothy K. Bovee is licensed under a Creative Commons Attribution-ShareAlike 4.0 International License.

Based on a work at www.timbovee.com.