3:30 p.m. New York time
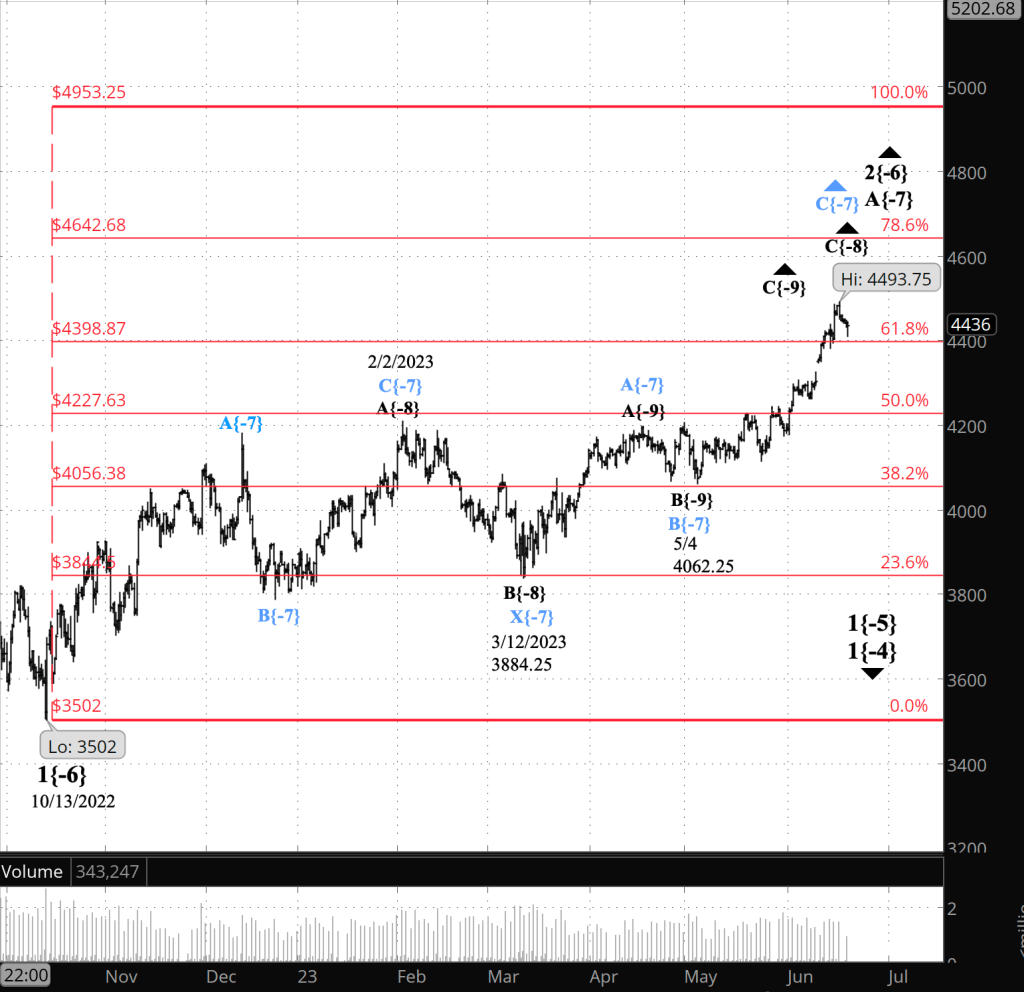
Half an hour before the closing bell. The S&P 500 futures has reached a low during the session of 4403.50, just a few dollars above the 61.8% Fibonacci retracement level, and then rose back into the 4430s. The indicator continues to go nowhere. This morning’s analysis stands unchanged. I’ve updated the chart.
9:35 a.m. New York time
What’s happening now? The S&P 500 E-mini futures fell overnight into the 4110s as an upward correction that began on October 13, 2022 continues.
What does it mean? The present rise began on May 4 from 4062.25. The S&P 500 has been limited to small movements since the recent correction peak, 4493.75, on June 16. The correction is a 2nd wave, and under the rules of Elliott wave analysis, the highest the correction’s price can rise is the starting point of the preceding 1st wave, 4953.25.
What are the choices? I’ve found two principal analyses of chart, both equally likely. One analysis is labeled on the chart in black and referred to as the Black Analysis. The other is labeled in blue and referred to as the Blue Analysis.
Black Analysis, A-wave scenario: The wave labels on the chart in black show a simple correction, with the first subwave, wave A{-7}, within the upward correction, wave 2{-6}, still underway and nearing its end.
Blue Analysis, C-wave scenario: The blue wave labels show the correction having taken a compound form. Compound corrections can contain up to three corrective patterns. The first pattern ended on February 2. The second pattern is now nearing completion. The end of the second pattern could be the end of the upward correction and the beginning of a powerful downtrend, or it could be followed by a relatively shallow declining connection wave, called an X-wave, and then a third corrective pattern.

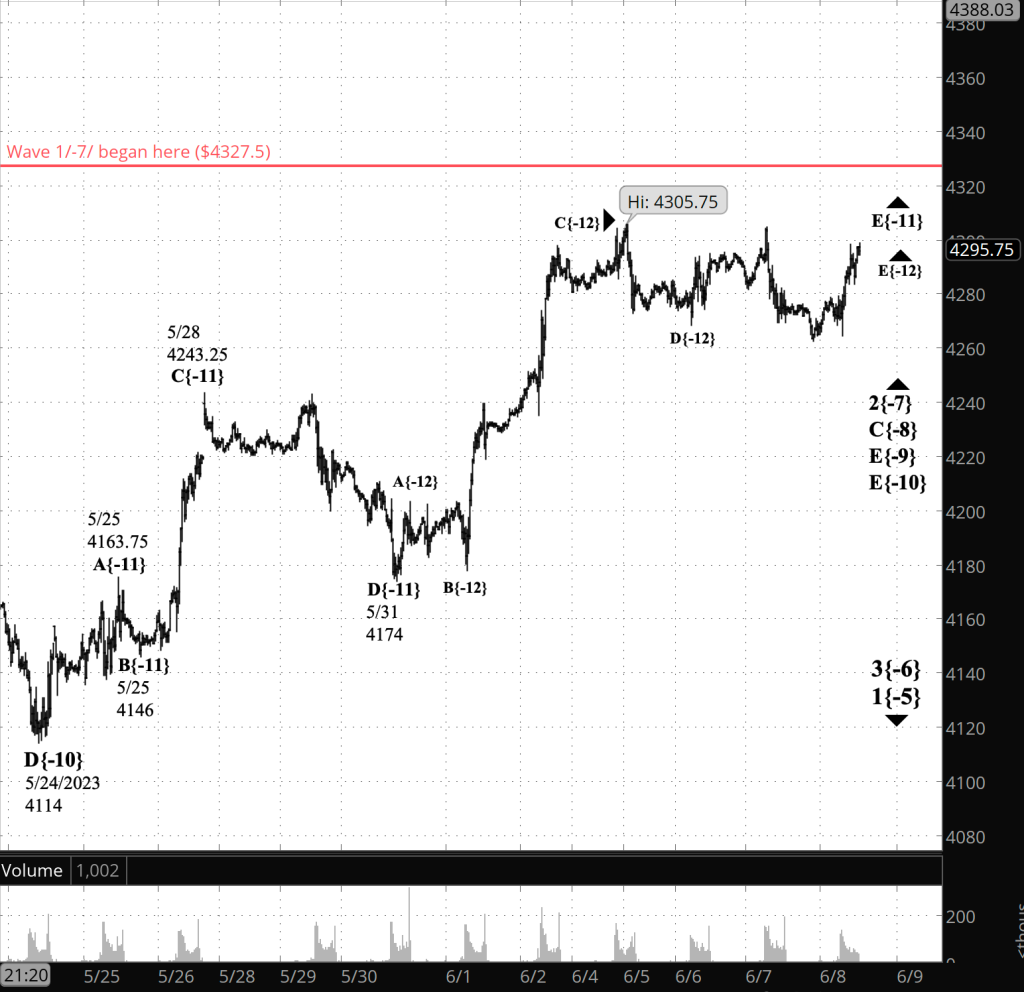
[S&P 500 E-mini futures at 3:30 p.m., 8-hour bars, with volume]
Reading the chart. Price movements — waves – – in Elliott wave analysis are labeled with numbers within trending waves and letters with corrective waves. The subscripts — numbers in curly brackets — designate the wave’s degree, which, in Elliott wave analysis, means the relative position of a wave within the larger and smaller structures that make up the chart. R.N. Elliott, who in the 1930s developed the form of analysis that bears his name, viewed the chart as a complex structure of smaller waves nested within larger waves, which in turn are nested within still larger waves. In mathematics it’s called a fractal structure, where at every scale the pattern is similar to the others.
What does Elliott wave theory say? Here are the waves that underly the analyses.
Black Analysis, simple correction (black labeling on the chart):
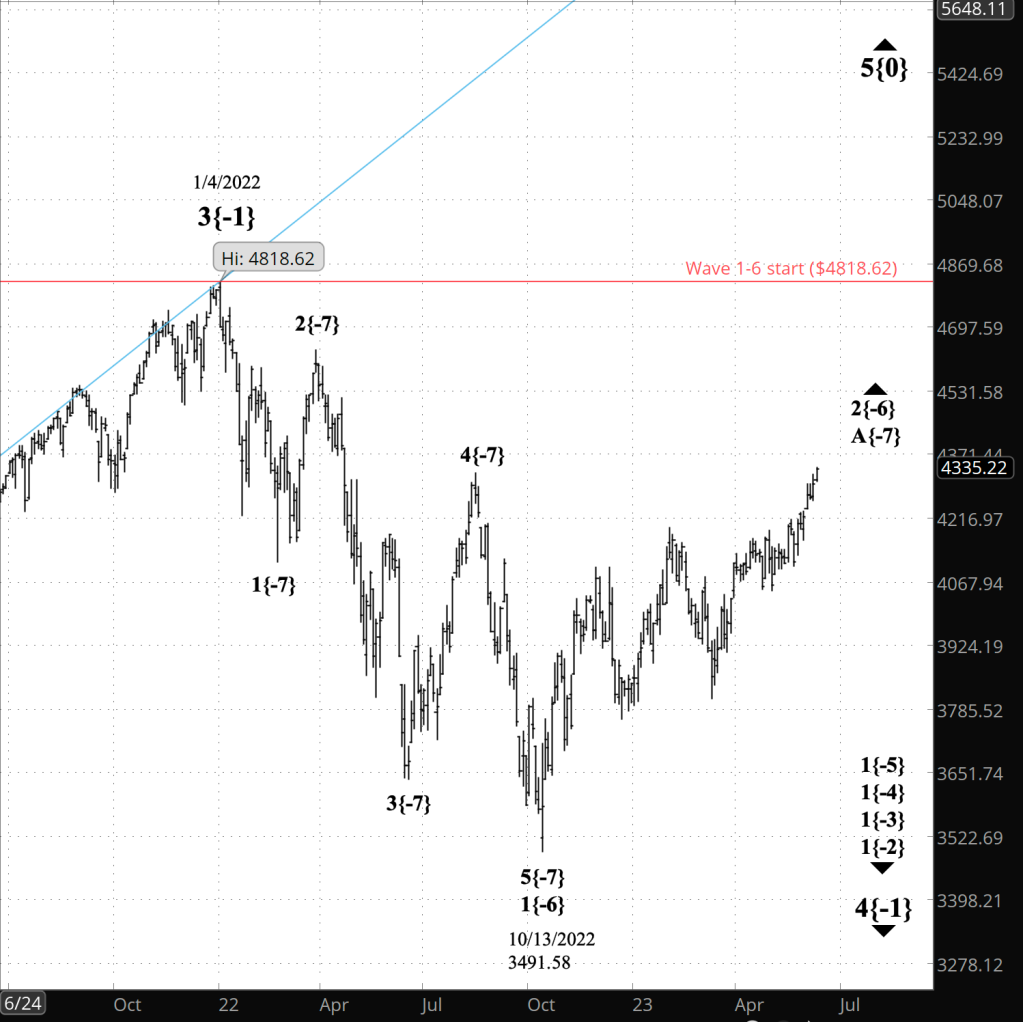
- An upward correction, a Zigzag, wave 2{-6}, began on October 13, 2022 and is underway.
- The correction’s first subwave, wave A{-7}, is underway and will have five subwaves.
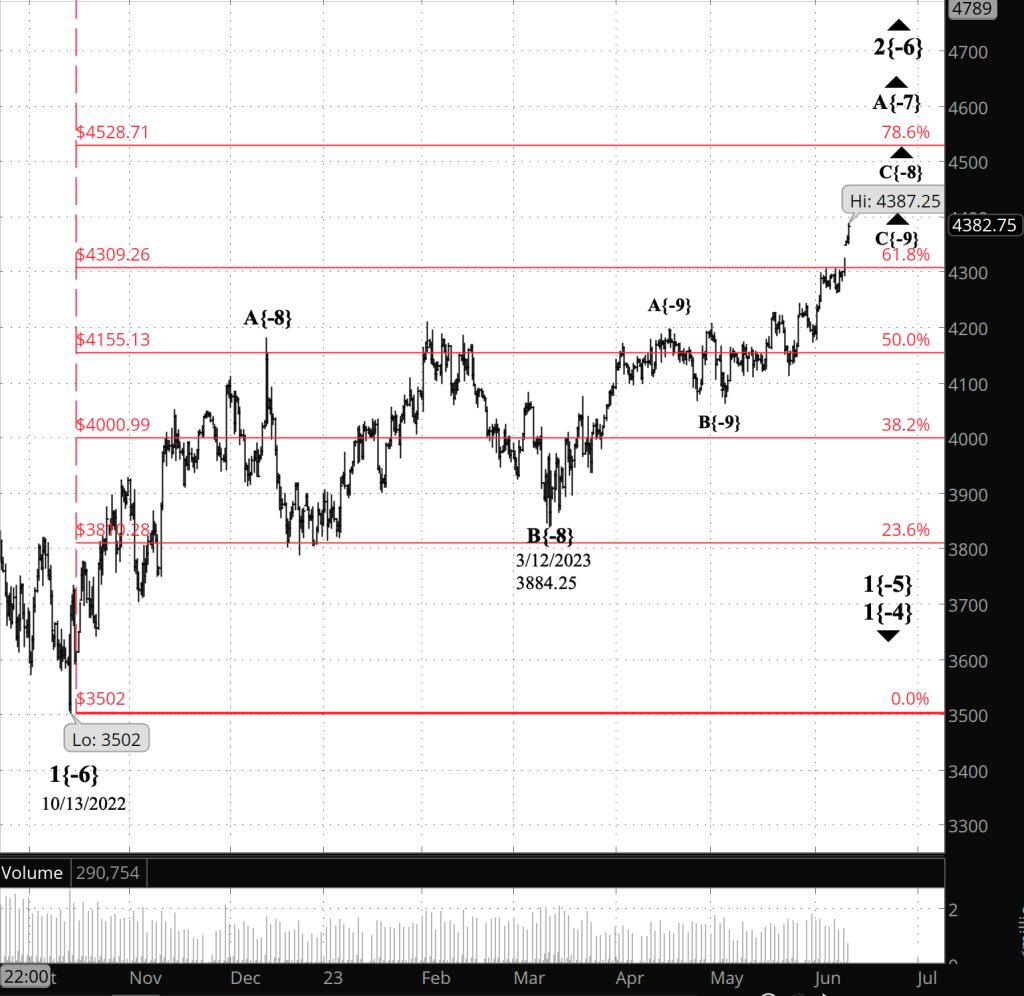
- Wave A{-7} at present is in its 3rd subwave, wave C{-8}.
- Wave C{-8} is in its 3rd subwave, wave C{-9}.
- Wave 2{-6}, when complete, will be followed by a powerful downtrend, wave 3{-6}.
- Under the rules of Elliott wave analysis, wave 2{-6} cannot move beyond the beginning of wave 1{-6}, which was the January 4, 2022 peak at 4953.25. (I’ve adjusted the January 4 peak.)
Blue Analysis, compound correction (blue labeling on the chart):
- The upward correction, wave 2{-6}, is taking a compound form, which can contain up to three corrective patterns.
- The correction is in its second corrective pattern, which is in wave C{-7}, its final wave.
Future Alternatives, an additional corrective pattern or the end of the correction?
- In either scenario, wave C{-7}, when complete, will either be followed by a separator wave, X{-7}, and then an additional corrective pattern, or will be the end of the wave 2{-6} correction and will be followed by a powerful downtrend, wave 3{-6}.
- Compound corrections can contain no more than three corrective patterns.
We Are Here.
These are the waves currently in progress under my principal analysis. Each line on the list shows the wave number, with the subscript in curly brackets, the traditional degree name, the starting date, the starting price of the S&P 500 E-mini futures, and the direction of the wave.
- S&P 500 Index:
- 5{+3} Supercycle, 7/8/1932, 4.40 (up)
- 5{+2} Cycle, 12/9/1974, 60.96 (up)
- 5{+1} Primary, 3/6/2009, 666.79 (up)
- 5{0} Intermediate, 12/26/2018, 2346.58 (up)
- S&P 500 Futures and index:
- 4{-1} Minor, 1/4/2022, 4953.25 (down) (futures), 4818.62 (down) (index)
- S&P 500 Futures:
- 1{-2} Minute, 1/4/2022, 4953.25 (down)
- 1{-3} Minuette, 1/4/2022, 4953.25 (down)
- 1{-4} Subminuette, 1/4/2022, 4953.25 (down)
- 1{-5} Micro, 1/4/2022, 4953.25 (down)
- 2{-6} Minuscule, 10/13/2022, 3577.75 (up)
Learning and other resources. Elliott wave analysis provides context, not prophecy. As the 20th century semanticist Alfred Korzybski put it in his book Science and Sanity (1933), “The map is not the territory … The only usefulness of a map depends on similarity of structure between the empirical world and the map.” And I would add, in the ever-changing markets, we can judge that similarity of structure only after the fact.
See the menu page Analytical Methods for a rundown on where to go for information on Elliott wave analysis.
By Tim Bovee, Portland, Oregon, June 21, 2023
Disclaimer
Tim Bovee, Private Trader tracks the analysis and trades of a private trader for his own accounts. Nothing in this blog constitutes a recommendation to buy or sell stocks, options or any other financial instrument. The only purpose of this blog is to provide education and entertainment.
No trader is ever 100 percent successful in his or her trades. Trading in the stock and option markets is risky and uncertain. Each trader must make trading decisions for his or her own account, and take responsibility for the consequences.
License
All content on Tim Bovee, Private Trader by Timothy K. Bovee is licensed under a Creative Commons Attribution-ShareAlike 4.0 International License.
Based on a work at www.timbovee.com.


You must be logged in to post a comment.