3:30 p.m. New York time
Half an hour before the closing bell. The S&P 500 futures reached a new high point today, the peak so far of the uptrend that began on November 21.
Elliott Wave Theory: The peak is part of a 4th-wave upward correction, wave 4{-10}, within wave A{-9], the latter being the firsr subwave of wave 2{-8}..
9:35 a.m. New York time.
What’s happening now. The S&P 500 E-mini futures closed last week at 6833.50 and resumed trading at 6890, a 56.50 openng gap. As the opening bell approached, the price exceeded 6900.
What does it mean? The pattern is an expanding triangle, a less common form in Elliott Wave Theory analysis wherein each high moves higher than the one before the each low moves lower. Altogether there are five subwaves.
The boundaries of the triangle are marked on the chart with red dashed lines.
The smaller waves are trending upward, but the larger degrees — the ones that really move the market — are downtrending.
The triangle is wave 4{-10}, a relatively small wave that is a subwave of wave A{-9}, the initial subwave of wave 2{-8}, which began on November 21 from 6525.
Wave 2 is the second of five subwaves within downtrending wave 5{-7}, the final subwave of wave 5{-6}, also downtrending, and encompassing those waves are a series of 1st waves, each larger than the one before it, to wave 1{-2}. They all began on October 8 in a major reversal from 6812.25.
When wave 2{-8} is complete, downtrending wave 3{-8} will begin, carrying the down to the low 6500s and most likely lower.
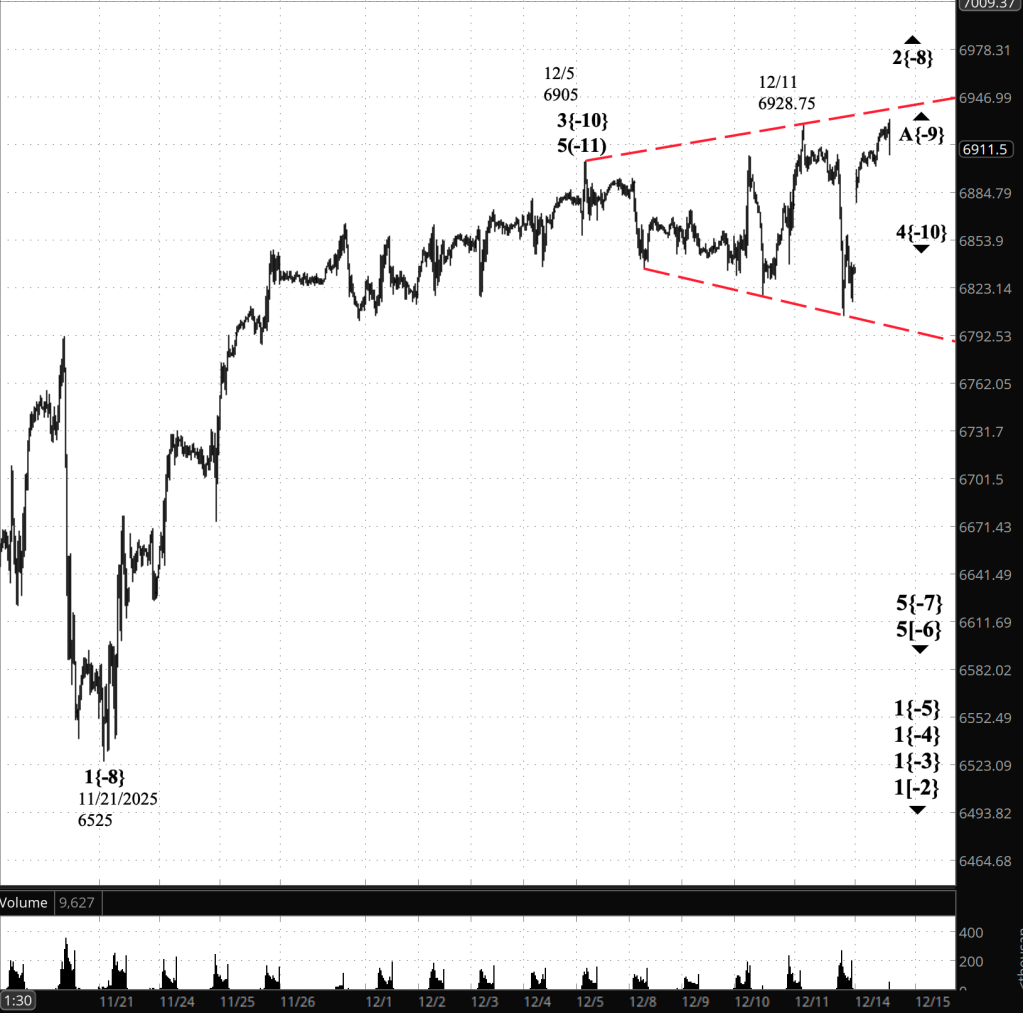
[S&P 500 E-mini futures at 3:30 p.m., 35-minute bars, with volume]
Waves Now Underway
These are the waves currently in progress under my principal analysis. Each line on the list shows the wave number, with the subscript in curly brackets, the traditional degree name, the starting date, the starting price of the S&P 500 E-mini futures, and the direction of the wave.
Most of the waves began not long ago, on October 8, 2025. See my essay posted on October 12, 2025, “The End of the Rise from 1932? Elliott Wave Theory Says ‘Yes’”, for a discussion of how that happened.
The difficult problem of estimating when a wave change should be accept as real rather than a headfake is addressed by the essay titled, “Is This Reversal Real?: How to Tell Without Being Whipsawed”.
- 1{+4} Supermillennium, (unknown start date or start price) {down}
- A hypothetical wave one degree higher than Supercyle, needed to make the wave analysis complete.
- S&P 500 Index:
- 1{+3} Supercycle, 10/8/2025, 6812.25 (down}
- 1{+2} Cycle, 10/8/2025, 6812.25 (down}
- 1{+1} Primary, 10/8/2025, 6812.25 (down}
- 1{0} Intermediate, 10/8/2025, 6812.25 (down}
- 1{-1} Minor, 10/8/2025, 6812.25 (down}
- 1{-2} Minute, 10/8/2025, 6812.25 (down}
- S&P 500 Futures
- 1{-3} Minuette 10/8/2025, 6812.25 (down}
- 1{-4} Subminutte 10/8/2025, 6812.25 (down}
- 1{-5} Micro, 10/8/2025, 6812.25 (down}
- 5{-6} Submicro, 10/29/2025, 6953.75 (down)
- 5{-7} Minuscule, 11/20/2025, 6791.25 (down)
- 2{-8} (none), 11/21/2025, 6525 (up)
- A{-9} (none), 11/21/2025, 6525 (up)
Reading the chart. Price movements — waves – – in Elliott Wave Theory analysis are labeled with numbers within trending waves and letters with corrective waves. The subscripts — numbers in curly brackets — designate the wave’s degree, which, in Elliott Wave analysis, means the relative position of a wave within the larger and smaller structures that make up the chart. R.N. Elliott, who in the 1930s developed the form of analysis that bears his name, viewed the chart as a complex structure of smaller waves nested within larger waves, which in turn are nested within still larger waves. In mathematics it’s called a fractal structure, where at every scale the pattern is similar to the others.
Learning and other resources. Elliott Wave analysis provides context, not prophecy. As the 20th century semanticist Alfred Korzybski put it in his book Science and Sanity (1933), “The map is not the territory … The only usefulness of a map depends on similarity of structure between the empirical world and the map.” And I would add, in the ever-changing markets, we can judge that similarity of structure only after the fact.
See the menu page Analytical Methods for a rundown on where to go for information on Elliott Wave analysis.
By Tim Bovee, Portland, Oregon, December 15, 2025
Disclaimer
Tim Bovee, Private Trader tracks the analysis and trades of a private trader for his own accounts. Nothing in this blog constitutes a recommendation to buy or sell stocks, options or any other financial instrument. The only purpose of this blog is to provide education and entertainment.
No trader is ever 100 percent successful in his or her trades. Trading in the stock and option markets is risky and uncertain. Each trader must make trading decisions for his or her own account, and take responsibility for the consequences.
All content on Tim Bovee, Private Trader by Timothy K. Bovee is licensed under a Creative Commons Attribution-ShareAlike 4.0 International License.
Based on work at www.timbovee.com


You must be logged in to post a comment.