Trader’s Notebook

3:30 p.m. New York time

Half an hour before the closing bell. The S&P 500 futures rose during the session, reaching into the 4280s so far. The rise is the first subwave within small 4th-wave upward correction within the 1st-wave downtrend that began on October 12. The wave nomenclature is wave A{-10} within wave 4{-9}, a subwave within wave 1{-8}.

I’ve updated the chart.

11 a.m. New York time

SPY options position exited. I’ve ended my bear call options spread on SPY seven days prior to expiration for half of maximum potential profit and have updated the trade analysis with full results.

9:35 a.m. New York time

What’s happening now? The S&P 500 E-mini futures initially stayed in a narrow band, in the 4350s and 4360s, and then fell to 4215.25 as the opening bell approached.

What does it mean? The low-degree downtrend that began on October 17 continues to work through its 3rd wave of five — wave 3{-9}. A small 4th-wave upward correction will follow and then a final 5th-wave push to the downside will complete the downtrend.

Within the fractal structure of the chart, the end of the low-degree downtrend will also end a downtrend one-degree higher, which will move to an upward correction. The beauty of trends is that they are so predictable. Like waves at the beach, their subwaves wash ashore in the direction of the trend, and then retreat, taking back the distance they traveled in a pattern that varies little from trend to trend whatever the degree.

All of this is happening within a 3rd degree downtrend six-degrees larger, wave 3{-3}, which is in its 3rd subwave and will have some distance to travel before moving into a 4th wave correction. Going still higher, everything that has been taking place since January 4, 2022 has been part of wave 4{-1}, the next-to-the-last wave within an expanding Diagonal Triangle, the 5th wave of an uptrend, wave 5{0}, that began on December 26, 2018.

What are the alternatives? Under the alternative, scenario degree labels are lower than the reality on the chart. The degree {-8} waves, for example, ought to be labeled {-7} and the {-9} wave changed to {-8}.

[S&P 500 E-mini futures at 3:30 p.m., 70-minute bars, with volume]

What does Elliott wave theory say? Here are the waves that underly the analyses.

Principal Analysis:

  • A downtrend, wave 3{-2}, began on July 27 and is underway.
  • Within wave 3{-2}, a smaller downtrend, wave 3{-3}, began on September 14 and is in its initial subwave, wave 1{-4}.
  • With wave 1{-4}, subwave 5{-5}, an downtrend, is underway, having begun on October 12.
  • Wave 5{-5} is in its first subwave, wave 1{-6}.
  • Within wave 1{-6}, waves 1{-7} and 1{-8} are underway.
  • Within 1{-8}, wave 3{-9} is underway and is in a wave 4{-10} upward correction.

Alternative Analysis

  • The degrees in the principal analysis are lower than they will eventually turn out to be. The present downtrending wave 3{-9} is wave 3{-8} or perhaps even 3{-7}.

We Are Here.

These are the waves currently in progress under my principal analysis. Each line on the list shows the wave number, with the subscript in curly brackets, the traditional degree name, the starting date, the starting price of the S&P 500 E-mini futures, and the direction of the wave.

  • S&P 500 Index:
  • 5{+3} Supercycle, 7/8/1932, 4.40 (up)
  • 5{+2} Cycle, 12/9/1974, 60.96 (up)
  • 5{+1} Primary, 3/6/2009, 666.79 (up)
  • 5{0} Intermediate, 12/26/2018, 2346.58 (up)
  • S&P 500 Futures and index:
  • 4{-1} Minor, 1/4/2022, 4953.25 (down) (futures), 4818.62 (down) (index)
  • S&P 500 Futures:
  • 3{-2} Minute, 7/27/2023, 3502 (down)
  • 3{-3}, Minuette, 9/14/2023, 4566 (down)
  • 1{-4}, Subminuette, 9/14/2023, 4566 (down)
  • 5{-5}, Micro, 10/12/2023, 4430.50 (down)
  • 1{-6}, Submicro, 10/12/2023, 4430.50 (down)
  • 1{-7}, Minuscule, 10/12/2023, 4430.50 (down)

Reading the chart. Price movements — waves – – in Elliott wave analysis are labeled with numbers within trending waves and letters with corrective waves. The subscripts — numbers in curly brackets — designate the wave’s degree, which, in Elliott wave analysis, means the relative position of a wave within the larger and smaller structures that make up the chart. R.N. Elliott, who in the 1930s developed the form of analysis that bears his name, viewed the chart as a complex structure of smaller waves nested within larger waves, which in turn are nested within still larger waves. In mathematics it’s called a fractal structure, where at every scale the pattern is similar to the others.

Learning and other resources. Elliott wave analysis provides context, not prophecy. As the 20th century semanticist Alfred Korzybski put it in his book Science and Sanity (1933), “The map is not the territory … The only usefulness of a map depends on similarity of structure between the empirical world and the map.” And I would add, in the ever-changing markets, we can judge that similarity of structure only after the fact.

See the menu page Analytical Methods for a rundown on where to go for information on Elliott wave analysis.

By Tim Bovee, Portland, Oregon, October 23, 2023

Disclaimer

Tim Bovee, Private Trader tracks the analysis and trades of a private trader for his own accounts. Nothing in this blog constitutes a recommendation to buy or sell stocks, options or any other financial instrument. The only purpose of this blog is to provide education and entertainment.

No trader is ever 100 percent successful in his or her trades. Trading in the stock and option markets is risky and uncertain. Each trader must make trading decisions for his or her own account, and take responsibility for the consequences.

License
Creative Commons License

All content on Tim Bovee, Private Trader by Timothy K. Bovee is licensed under a Creative Commons Attribution-ShareAlike 4.0 International License.

Based on a work at www.timbovee.com.
SPY Trade

S&P 500 ETF Trust (SPY)

Lot 2023-8

Update 10/23/2023: I exited my short bull put vertical spread on October 23, seven days before expiration, for a $0.61 debit per contract/share, a profit before fees of $60 per contract. Shares were trading at $419.30, down $3.44 from the entry level.

The Implied Volatility Rank at exit was 59.8%, up 11.1 points from the entry level.

I exited on the day after entry because the position reached 49.6% of maximum potential profit, a rounding error away from my normal exit point for options positions.

Shares fell by 0.8% over three days for a -99% annual rate. The options position produced a 98,4% return for a +11,967% annual rate.


I have entered a bear call vertical spread on SPY, using options that trade for the last time 10 days hence, on October 30. The premium is a $1.21 credit per contract share and the stock at the time of entry was priced at $422.74.

The Implied Volatility Ratio stood at 48.7%.

Premium:$1.21Expire OTM
SPY-bear call spreadStrikeOddsDelta
Calls
Long433.0081.0%19
Break-even430.2175.0%25
Short429.0069.0%31

The premium is 60.5% of the width of the short/long spread. The profit zone covers a 1.8% move to the upside and an unlimited move to the downside.

The risk/reward ratio is 2.3 :1, with maximum risk of $279 and maximum reward of $121 per contract.

How I chose the trade. I selected the short strike prices based on Elliott Wave analysis of the underlying stock chart. The wave behind the trade is wave 5{-10}, which began on October 17, 2023.

By Tim Bovee, Portland, Oregon, October 20, 2023

Disclaimer

Tim Bovee, Private Trader tracks the analysis and trades of a private trader for his own accounts. Nothing in this blog constitutes a recommendation to buy or sell stocks, options or any other financial instrument. The only purpose of this blog is to provide education and entertainment.

No trader is ever 100 percent successful in his or her trades. Trading in the stock and option markets is risky and uncertain. Each trader must make trading decisions for his or her own account, and take responsibility for the consequences.

License
Creative Commons License

All content on Tim Bovee, Private Trader by Timothy K. Bovee is licensed under a Creative Commons Attribution-ShareAlike 4.0 International License.

Based on a work at www.timbovee.com.

Trader’s Notebook

3:30 p.m. New York time

Half an hour before the closing bell. The S&P 500 futures fell into the 4250s during the session. The 3rd wave downtrend that began on October 17 continued and is in its 5th and final wave.

When the 3rd wave is complete, an upward correction, a 4th wave, will begin.

This morning’s analysis is unchanged. I’ve updated the chart.

11:45 a.m. New York time

SPY 10DTE options position entered. I’ve continued my trade series aimed at understanding the value, or lack of value, of trading very short-term options. The goal is to get close to 8 days until expiration at entry. Each trade is chosen based on an Elliott Wave analysis of the underlying stock’s chart.

The first two attempts reached 50% of maximum potential profit, the first on the same day as entry, making it a day trade, and second on the second day after entry.

In this case — the third trade — I’ve entered bear call spread on SPY that expires in 10 days. The trade is meant to profit from a very low degree downtrend, wave 5{-10}, which began on October 17.

I’ve posted an analysis of the trade.

9:35 a.m. New York time

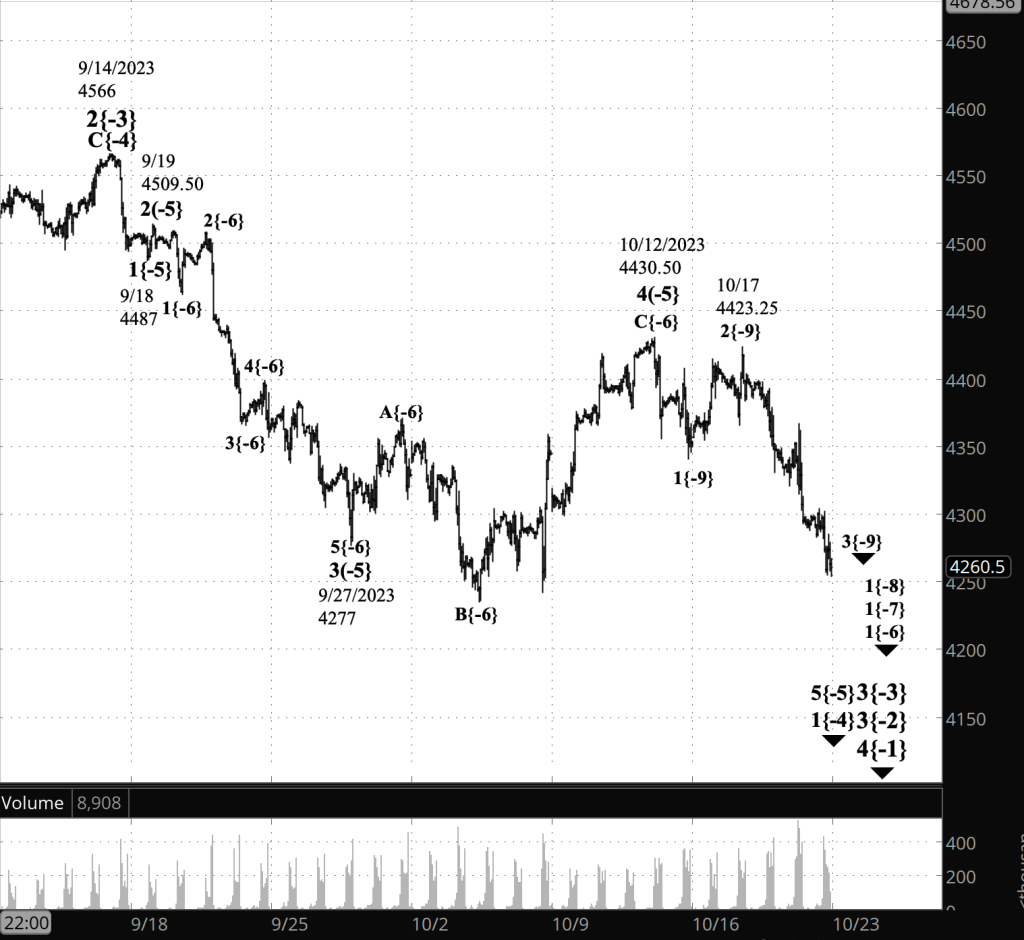
What’s happening now? The S&P 500 E-mini futures traded sideways overnight, staying between the 43-oughts and the 4280s.

What does it mean? The movement is an upward correction of relatively low degree within a 3rd-wave downtrend that began on October 17. The downtrend, wave 3{-9}, is four degrees lower than a larger downtrend, wave 5{-5}, which began on October 12 and has dominated the market for the past week. The 5th wave, in turn, a subwave two degrees lower than wave 3{-3}, which began on September 13 and which, if typical, will dominate the chart for the rest of the year.

Wave 3{-9} has moved below the startng point of the preceding 1st wave, eliminating the alternative scenario that had wave 2{-9} still underway and forming a compound correction.

What are the alternatives? The degree labels are lower than the reality on the chart. The degree {-8} waves, for example, ought to be labeled {-7} and the {-9} wave changed to {-8}.

[S&P 500 E-mini futures at 3:30 p.m., 70-minute bars, with volume]

What does Elliott wave theory say? Here are the waves that underly the analyses.

Principal Analysis:

  • A downtrend, wave 3{-2}, began on July 27 and is underway.
  • Within wave 3{-2}, a smaller downtrend, wave 3{-3}, began on September 14 and is in its initial subwave, wave 1{-4}.
  • With wave 1{-4}, subwave 5{-5}, an downtrend, is underway, having begun on October 12.
  • Wave 5{-5} is in its first subwave, wave 1{-6}.
  • Within wave 1{-6}, waves 1{-7} and 1{-8} are underway.
  • Within 1{-8}, wave 3{-9} is underway and is in a wave 4{-10} upward correction.

Alternative Analysis

  • The degrees in the principal analysis are lower than they will eventually turn out to be. The present downtrending wave 3{-9} is wave 3{-8} or perhaps even 3{-7}.

We Are Here.

These are the waves currently in progress under my principal analysis. Each line on the list shows the wave number, with the subscript in curly brackets, the traditional degree name, the starting date, the starting price of the S&P 500 E-mini futures, and the direction of the wave.

  • S&P 500 Index:
  • 5{+3} Supercycle, 7/8/1932, 4.40 (up)
  • 5{+2} Cycle, 12/9/1974, 60.96 (up)
  • 5{+1} Primary, 3/6/2009, 666.79 (up)
  • 5{0} Intermediate, 12/26/2018, 2346.58 (up)
  • S&P 500 Futures and index:
  • 4{-1} Minor, 1/4/2022, 4953.25 (down) (futures), 4818.62 (down) (index)
  • S&P 500 Futures:
  • 3{-2} Minute, 7/27/2023, 3502 (down)

Reading the chart. Price movements — waves – – in Elliott wave analysis are labeled with numbers within trending waves and letters with corrective waves. The subscripts — numbers in curly brackets — designate the wave’s degree, which, in Elliott wave analysis, means the relative position of a wave within the larger and smaller structures that make up the chart. R.N. Elliott, who in the 1930s developed the form of analysis that bears his name, viewed the chart as a complex structure of smaller waves nested within larger waves, which in turn are nested within still larger waves. In mathematics it’s called a fractal structure, where at every scale the pattern is similar to the others.

Learning and other resources. Elliott wave analysis provides context, not prophecy. As the 20th century semanticist Alfred Korzybski put it in his book Science and Sanity (1933), “The map is not the territory … The only usefulness of a map depends on similarity of structure between the empirical world and the map.” And I would add, in the ever-changing markets, we can judge that similarity of structure only after the fact.

See the menu page Analytical Methods for a rundown on where to go for information on Elliott wave analysis.

By Tim Bovee, Portland, Oregon, October 20, 2023

Disclaimer

Tim Bovee, Private Trader tracks the analysis and trades of a private trader for his own accounts. Nothing in this blog constitutes a recommendation to buy or sell stocks, options or any other financial instrument. The only purpose of this blog is to provide education and entertainment.

No trader is ever 100 percent successful in his or her trades. Trading in the stock and option markets is risky and uncertain. Each trader must make trading decisions for his or her own account, and take responsibility for the consequences.

License
Creative Commons License

All content on Tim Bovee, Private Trader by Timothy K. Bovee is licensed under a Creative Commons Attribution-ShareAlike 4.0 International License.

Based on a work at www.timbovee.com.
Trader’s Notebook

3:30 p.m. New York time

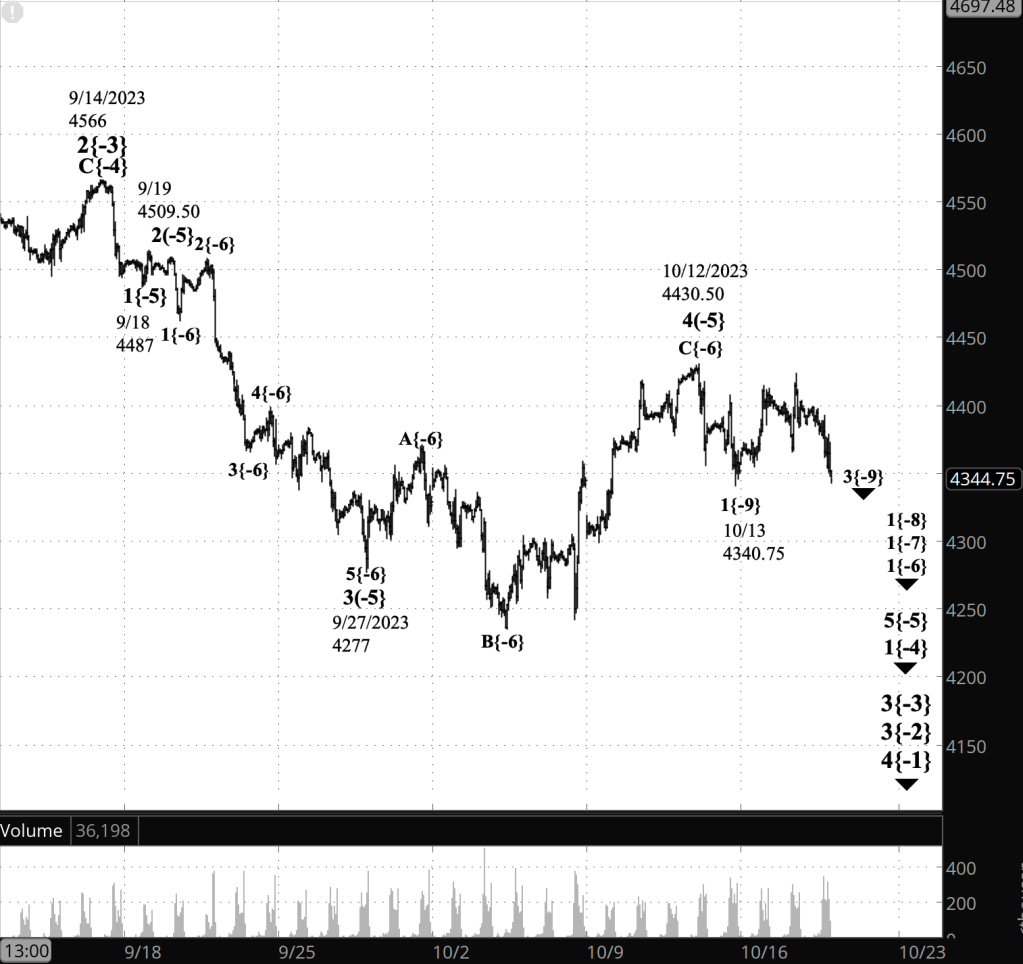
Half an hour before the closing bell. The S&P 500 futures continued to fall during the session, coming close to 4300. The rapid return to the downside answers this morning’s questions. The upward movement overnight was a low-degree upward correction within the 3rd-wave downtrend that began on October 17. However, it isn’t part of an A wave, as I wrote this morning, but is the whole correction, wave 4{-10}.

Otherwise, the analysis is unchanged. I’ve updated the chart.

11:10 a.m. New York time

SPY 9DTE options positions exited. I exited my short bear call options spreads on SPY, two days after entry, for half of maximum potential profit. The positions were entered a few minutes apart. Both were entered nine days before expiration (9DTE), the first for 50% of max and the second for 52.6% of max. They were exited seven days before expiration, for a holding period of two days. I’ve updated the trade analyses for both the first position and the second position with full details of the exits.

9:35 a.m. New York time

What’s happening now? The S&P 500 E-mini futures fell to 4320.75 overnight and then rose into the 4350s.

What does it mean? The rise has five waves internally, suggesting …

  • … that it is a 4th subwave, the A-wave of a low-degree upward correction within the 3rd-wave downtrend that began on October 17.
  • … or the 3rd wave downtrend ended at the overnight low, 4320.75 and a slightly higher degree 4th wave upward correction began from that point.

It’s a 4th-wave upward correction. The question is, what is it’s degree, {-10} or {-9}.

For the chart, I’ve marked it as a subwave within the October 17 downtrend –wave 4{-10} within wave 3{-9}. The alternative, wave 4{-9}, is equally possible. Only seeing what happens next will allow us to know which is a correct map of the chart.

What are the alternatives? And there are more alternatives.

Alternative #1: The degree labels are lower than the reality on the chart. The degree {-8} waves, for example, ought to be labeled {-7} and the {-9} wave changed to {-8}.

Alternative #2: The final leg of the upward correction — wave C{-6} within wave 4{-5} — ended at the overnight high and the correction is taking a compound structure. Declining wave X{-6}, a connector wave, has begun and will be followed by a second corrective pattern.

[S&P 500 E-mini futures at 3:30 p.m., hourly bars, with volume]

What does Elliott wave theory say? Here are the waves that underly the analyses.

Principal Analysis:

  • A downtrend, wave 3{-2}, began on July 27 and is underway.
  • Within wave 3{-2}, a smaller downtrend, wave 3{-3}, began on September 14 and is in its initial subwave, wave 1{-4}.
  • With wave 1{-4}, subwave 5{-5}, an downtrend, is underway, having begun on October 12.
  • Wave 5{-5} is in its first subwave, wave 1{-6}.
  • Within wave 1{-6}, waves 1{-7} and 1{-8} are underway.
  • Within 1{-8}, wave 3{-9} is underway and is in a wave 4{-10} upward correction.
  • Equally possible, within 1{-8}, wave 4{-9}, an upward correction, is underway, [This possibility was disproven by later events.]

Alternative Analysis #1: Degrees

  • The degrees in the principal analysis are lower than they will eventually turn out to be. The present downtrending wave 3{-9} is wave 3{-8} or perhaps even 3{-7}.

Alternative Analysis #2: Compound Correction

  • An upward correction, wave 4{-5}, is underway and is forming a compound structure. The first corrective pattern ended on October 12, and a declining connector subwave, wave X{-4}, is underway.

We Are Here.

These are the waves currently in progress under my principal analysis. Each line on the list shows the wave number, with the subscript in curly brackets, the traditional degree name, the starting date, the starting price of the S&P 500 E-mini futures, and the direction of the wave.

  • S&P 500 Index:
  • 5{+3} Supercycle, 7/8/1932, 4.40 (up)
  • 5{+2} Cycle, 12/9/1974, 60.96 (up)
  • 5{+1} Primary, 3/6/2009, 666.79 (up)
  • 5{0} Intermediate, 12/26/2018, 2346.58 (up)
  • S&P 500 Futures and index:
  • 4{-1} Minor, 1/4/2022, 4953.25 (down) (futures), 4818.62 (down) (index)
  • S&P 500 Futures:
  • 3{-2} Minute, 7/27/2023, 3502 (down)

Reading the chart. Price movements — waves – – in Elliott wave analysis are labeled with numbers within trending waves and letters with corrective waves. The subscripts — numbers in curly brackets — designate the wave’s degree, which, in Elliott wave analysis, means the relative position of a wave within the larger and smaller structures that make up the chart. R.N. Elliott, who in the 1930s developed the form of analysis that bears his name, viewed the chart as a complex structure of smaller waves nested within larger waves, which in turn are nested within still larger waves. In mathematics it’s called a fractal structure, where at every scale the pattern is similar to the others.

Learning and other resources. Elliott wave analysis provides context, not prophecy. As the 20th century semanticist Alfred Korzybski put it in his book Science and Sanity (1933), “The map is not the territory … The only usefulness of a map depends on similarity of structure between the empirical world and the map.” And I would add, in the ever-changing markets, we can judge that similarity of structure only after the fact.

See the menu page Analytical Methods for a rundown on where to go for information on Elliott wave analysis.

By Tim Bovee, Portland, Oregon, October 19, 2023

Disclaimer

Tim Bovee, Private Trader tracks the analysis and trades of a private trader for his own accounts. Nothing in this blog constitutes a recommendation to buy or sell stocks, options or any other financial instrument. The only purpose of this blog is to provide education and entertainment.

No trader is ever 100 percent successful in his or her trades. Trading in the stock and option markets is risky and uncertain. Each trader must make trading decisions for his or her own account, and take responsibility for the consequences.

License
Creative Commons License

All content on Tim Bovee, Private Trader by Timothy K. Bovee is licensed under a Creative Commons Attribution-ShareAlike 4.0 International License.

Based on a work at www.timbovee.com.
Trader’s Notebook

3:30 p.m. New York time

Half an hour before the closing bell. The S&P 500 futures fell throughout the session, reaching into the 4340s so far as the closing bell approached. This morning’s analysis is unchanged. I’ve updated the chart.

9:40 a.m. New York time

SPY options entry. I’ve posted the trade analyses of two bear call options spreads on SPY, entered October 17 with nine days remaining before expiration. Publication of the analyses was delayed by circumstances. After placing the first trade, I decided to double down and placed a second identical trade, so there are two analyses with different premiums: The first position and the second position.

9:35 a.m. New York time

What’s happening now? The S&P 500 E-mini futures fell during the session, from just below 4400 after yesterday’s closing bell to the 4370s as today’s opening bell approached.

What does it mean? The 3rd wave of a low-degree downtrend continues. The downtrend is a subwave within a series of nested first waves within a 5th wave downtrend began on October 12 that is four degrees larger.

Encompassing the whole structure is a 3rd wave downtrend, two degrees larger than the 5th, which began on September 14.

What are the alternatives? There are two:

Alternative #1: The degree labels are lower than the reality on the chart. The degree {-8} waves, for example, ought to be labeled {-7} and the {-9} wave changed to {-8}.

Alternative #2: The final leg of the upward correction — wave C{-6} within wave 4{-5} — ended at the overnight high and the correction is taking a compound structure. Declining wave X{-6}, a connector wave, has begun and will be followed by a second corrective pattern.

[S&P 500 E-mini futures at 3:30 p.m., hourly bars, with volume]

What does Elliott wave theory say? Here are the waves that underly the analyses.

Principal Analysis:

  • A downtrend, wave 3{-2}, began on July 27 and is underway.
  • Within wave 3{-2}, a smaller downtrend, wave 3{-3}, began on September 14 and is in its initial subwave, wave 1{-4}.
  • With wave 1{-4}, subwave 5{-5}, an downtrend, is underway, having begun on October 12.
  • Wave 5{-5} is in its first subwave, wave 1{-6}.
  • Within wave 1{-6}, waves 1{-7}, 1{-8} and 3{-9} are underway

Alternative Analysis #1: Degrees

  • The degrees in the principal analysis are lower than they will eventually turn out to be. The present downtrending wave 3{-9} is wave 3{-8} or perhaps even 3{-7}.

Alternative Analysis #2: Compound Correction

  • An upward correction, wave 4{-5}, is underway and is forming a compound structure. The first corrective pattern ended on October 12, and a declining connector subwave, wave X{-4}, is underway.

We Are Here.

These are the waves currently in progress under my principal analysis. Each line on the list shows the wave number, with the subscript in curly brackets, the traditional degree name, the starting date, the starting price of the S&P 500 E-mini futures, and the direction of the wave.

  • S&P 500 Index:
  • 5{+3} Supercycle, 7/8/1932, 4.40 (up)
  • 5{+2} Cycle, 12/9/1974, 60.96 (up)
  • 5{+1} Primary, 3/6/2009, 666.79 (up)
  • 5{0} Intermediate, 12/26/2018, 2346.58 (up)
  • S&P 500 Futures and index:
  • 4{-1} Minor, 1/4/2022, 4953.25 (down) (futures), 4818.62 (down) (index)
  • S&P 500 Futures:
  • 3{-2} Minute, 7/27/2023, 3502 (down)

Reading the chart. Price movements — waves – – in Elliott wave analysis are labeled with numbers within trending waves and letters with corrective waves. The subscripts — numbers in curly brackets — designate the wave’s degree, which, in Elliott wave analysis, means the relative position of a wave within the larger and smaller structures that make up the chart. R.N. Elliott, who in the 1930s developed the form of analysis that bears his name, viewed the chart as a complex structure of smaller waves nested within larger waves, which in turn are nested within still larger waves. In mathematics it’s called a fractal structure, where at every scale the pattern is similar to the others.

Learning and other resources. Elliott wave analysis provides context, not prophecy. As the 20th century semanticist Alfred Korzybski put it in his book Science and Sanity (1933), “The map is not the territory … The only usefulness of a map depends on similarity of structure between the empirical world and the map.” And I would add, in the ever-changing markets, we can judge that similarity of structure only after the fact.

See the menu page Analytical Methods for a rundown on where to go for information on Elliott wave analysis.

By Tim Bovee, Portland, Oregon, October 18, 2023

Disclaimer

Tim Bovee, Private Trader tracks the analysis and trades of a private trader for his own accounts. Nothing in this blog constitutes a recommendation to buy or sell stocks, options or any other financial instrument. The only purpose of this blog is to provide education and entertainment.

No trader is ever 100 percent successful in his or her trades. Trading in the stock and option markets is risky and uncertain. Each trader must make trading decisions for his or her own account, and take responsibility for the consequences.

License
Creative Commons License

All content on Tim Bovee, Private Trader by Timothy K. Bovee is licensed under a Creative Commons Attribution-ShareAlike 4.0 International License.

Based on a work at www.timbovee.com.
SPY Trade

S&P 500 ETF Trust (SPY)

Lot 2023-7

Update 10/19/2023: I exited my short bear call vertical spread on October, 7 days before expiration, for a $0.63 debit per contract/share, a profit before fees of $70 per contract. Shares were trading at $429.48, down $3.60 from the entry level.

The Implied Volatility Rank at exit was 40.3%, up 8.3 points from the entry level.

I exited two days after entry because the position exceeded 50% of maximum potential profit, my normal exit point for optons positions.

Shares fell by 0.8% over two days for a -152% annual rate. The options position produced a 111.1% return for a +20,278% annual rate.


I have entered a bear call vertical spread on SPY, using options that trade for the last time nine days hence, on October 26. The premium is a $1.33 credit per contract share and the stock at the time of entry was priced at $433.39.

The Implied Volatility Ratio stood at 32.0%.

Premium:$1.33Expire OTM
SPY-bear call spreadStrikeOddsDelta
Puts
Long444.0086.0%14
Break-even440.2678.0%21.5
Short439.0070.0%29

The premium is 53.2% of the width of the short/long spread. The profit zone covers a 1.6% move to the upside with no limit on the downside.

The risk/reward ratio is 2.8 :1, with maximum risk of $367 and maximum reward of $133 per contract.

How I chose the trade. I entered the position based on Elliott wave analysis with the host of profitng from a low-degree declining wave 3{-9} of the S&P 500 futures, based on an analysis conducted on October 17, 2023.

By Tim Bovee, Portland, Oregon, October 17, 2023

Disclaimer

Tim Bovee, Private Trader tracks the analysis and trades of a private trader for his own accounts. Nothing in this blog constitutes a recommendation to buy or sell stocks, options or any other financial instrument. The only purpose of this blog is to provide education and entertainment.

No trader is ever 100 percent successful in his or her trades. Trading in the stock and option markets is risky and uncertain. Each trader must make trading decisions for his or her own account, and take responsibility for the consequences.

License
Creative Commons License

All content on Tim Bovee, Private Trader by Timothy K. Bovee is licensed under a Creative Commons Attribution-ShareAlike 4.0 International License.

Based on a work at www.timbovee.com.
SPY Trade

S&P 500 ETF Trust (SPY)

Lot 2023-6

Update 10/19/2023: I exited my short bear call vertical spread on October, 7 days before expiration, for a $0.63 debit per contract/share, a profit before fees of $63 per contract. Shares were trading at $429.48, down $3.60 from the entry level.

The Implied Volatility Rank at exit was 40.3%, up 8.3 points from the entry level.

I exited two days after entry because the position reached 50% of maximum potential profit, my normal exit point for optons positions.

Shares fell by 0.8% over two days for a -152% annual rate. The options position produced a 100.0% return for a +18,250% annual rate.


I have entered a bear call vertical spread on SPY, using options that trade for the last time nine days hence, on October 26. The premium is a $1.26 credit per contract share and the stock at the time of entry was priced at $433.08.

The Implied Volatility Ratio stood at 32.8%.

Premium:$1.26Expire OTM
SPY-bear call spreadStrikeOddsDelta
Puts
Long444.0086.0%14
Break-even440.2678.0%21.5
Short439.0070.0%29

The premium is 50.4% of the width of the short/long spread. The profit zone covers a 1.7% move to the upside with no limit on the downside.

The risk/reward ratio is 3 :1, with maximum risk of $374 and maximum reward of $126 per contract.

How I chose the trade. I entered the position based on Elliott wave analysis with the host of profitng from a low-degree declining wave 3{-9} of the S&P 500 futures, based on an analysis conducted on October 17, 2023.

By Tim Bovee, Portland, Oregon, October 17, 2023

Disclaimer

Tim Bovee, Private Trader tracks the analysis and trades of a private trader for his own accounts. Nothing in this blog constitutes a recommendation to buy or sell stocks, options or any other financial instrument. The only purpose of this blog is to provide education and entertainment.

No trader is ever 100 percent successful in his or her trades. Trading in the stock and option markets is risky and uncertain. Each trader must make trading decisions for his or her own account, and take responsibility for the consequences.

License
Creative Commons License

All content on Tim Bovee, Private Trader by Timothy K. Bovee is licensed under a Creative Commons Attribution-ShareAlike 4.0 International License.

Based on a work at www.timbovee.com.
Trader’s Notebook

3:30 p.m. New York time

Half an hour before the closing bell. The S&P 500 futures fell during the session to 4365.75 and then rose to 4423.75 and then declined from that daily high. I’ve edited to chart to show the session peak as the end of wave 2{-9} and the beginning of wave 3{-9}, a minor change required because the session rose higher than the overnight peak. Otherwise, no changes. I’ve updated the chart.

SPY short bear call spread entry. Continuing to experiment with trades closer to expiration, I entered a bear call options spread on SPY that will expire in nine days, on October 26. I then rushed off to get three vaccination jabs. Upon returning home, I jumped into updating my options ledger with the new position, and then only had time to prep for the afternoon analysis before dashing off to a meeting. I’ll write up the trade analysis and post it this evening or overnight. My goal with this position is to capture some profit from wave 3{-9}, discussed in the analysis.

October 18: I’ve posted the trade analyses. After placing the first trade, I decided to double down and placed a second trade, so there are two analyses with different premiums: The first position and the second position.

9:35 a.m. New York time

What’s happening now? The S&P 500 E-mini futures fell overnight and reaching into the 4370s.

What does it mean? The low degree 3rd wave within a five-wave downtrend that began on October 12 is underway. A 3rd wave is never the shortest wave in a trend and is often the longest. On the chart, the wave is labeled 3{-9}.

The 3rd wave will be followed by a 4th wave upward correction and then a 5th wave downtrend that, if it follows the typical pattern, will move beyond the end of the preceding 1st wave. In this case, wave 1{-9} ended on October 13 at 4340.75, and perhaps significantly below that level.

This is all happening within downtrending wave 4{-5}, four degrees larger, implying the “down” will dominate the chart for some time to come.

In assessing the chart, I’ve moved the end of the 1st wave from the previous lowest low in the chart to the later October 13 low and labeled the October 16 high as the end wave wave 2. Wave 3{-9} is presently in progress.

What are the alternatives? There are two:

Alternative #1: The degree labels are lower than the reality on the chart. The degree {-8} waves, for example, ought to be labeled {-7} and the {-9} wave changed to {-8}.

Alternative #2: The final leg of the upward correction — wave C{-6} within wave 4{-5} — ended at the overnight high and the correction is taking a compound structure. Declining wave X{-6}, a connector wave, has begun and will be followed by a second corrective pattern.

[S&P 500 E-mini futures at 3:30 p.m., hourly bars, with volume]

What does Elliott wave theory say? Here are the waves that underly the analyses.

Principal Analysis:

  • A downtrend, wave 3{-2}, began on July 27 and is underway.
  • Within wave 3{-2}, a smaller downtrend, wave 3{-3}, began on September 14 and is in its initial subwave, wave 1{-4}.
  • With wave 1{-4}, subwave 5{-5}, an downtrend, is underway, having begun on October 12.
  • Wave 5{-5} is in its first subwave, wave 1{-6}.
  • Within wave 1{-6}, waves 1{-7}, 1{-8} and 3{-9} are underway

Alternative Analysis #1: Degrees

  • The degrees in the principal analysis are lower than they will eventually turn out to be. The present downtrending wave 3{-9} is wave 3{-8} or perhaps even 3{-7}.

Alternative Analysis #2: Compound Correction

  • An upward correction, wave 4{-5}, is underway and is forming a compound structure. The first corrective pattern ended on October 12, and a declining connector subwave, wave X{-4}, is underway.

We Are Here.

These are the waves currently in progress under my principal analysis. Each line on the list shows the wave number, with the subscript in curly brackets, the traditional degree name, the starting date, the starting price of the S&P 500 E-mini futures, and the direction of the wave.

  • S&P 500 Index:
  • 5{+3} Supercycle, 7/8/1932, 4.40 (up)
  • 5{+2} Cycle, 12/9/1974, 60.96 (up)
  • 5{+1} Primary, 3/6/2009, 666.79 (up)
  • 5{0} Intermediate, 12/26/2018, 2346.58 (up)
  • S&P 500 Futures and index:
  • 4{-1} Minor, 1/4/2022, 4953.25 (down) (futures), 4818.62 (down) (index)
  • S&P 500 Futures:
  • 3{-2} Minute, 7/27/2023, 3502 (down)

Reading the chart. Price movements — waves – – in Elliott wave analysis are labeled with numbers within trending waves and letters with corrective waves. The subscripts — numbers in curly brackets — designate the wave’s degree, which, in Elliott wave analysis, means the relative position of a wave within the larger and smaller structures that make up the chart. R.N. Elliott, who in the 1930s developed the form of analysis that bears his name, viewed the chart as a complex structure of smaller waves nested within larger waves, which in turn are nested within still larger waves. In mathematics it’s called a fractal structure, where at every scale the pattern is similar to the others.

Learning and other resources. Elliott wave analysis provides context, not prophecy. As the 20th century semanticist Alfred Korzybski put it in his book Science and Sanity (1933), “The map is not the territory … The only usefulness of a map depends on similarity of structure between the empirical world and the map.” And I would add, in the ever-changing markets, we can judge that similarity of structure only after the fact.

See the menu page Analytical Methods for a rundown on where to go for information on Elliott wave analysis.

By Tim Bovee, Portland, Oregon, October 17, 2023

Disclaimer

Tim Bovee, Private Trader tracks the analysis and trades of a private trader for his own accounts. Nothing in this blog constitutes a recommendation to buy or sell stocks, options or any other financial instrument. The only purpose of this blog is to provide education and entertainment.

No trader is ever 100 percent successful in his or her trades. Trading in the stock and option markets is risky and uncertain. Each trader must make trading decisions for his or her own account, and take responsibility for the consequences.

License
Creative Commons License

All content on Tim Bovee, Private Trader by Timothy K. Bovee is licensed under a Creative Commons Attribution-ShareAlike 4.0 International License.

Based on a work at www.timbovee.com.

Trader’s Notebook

3:30 p.m. New York time

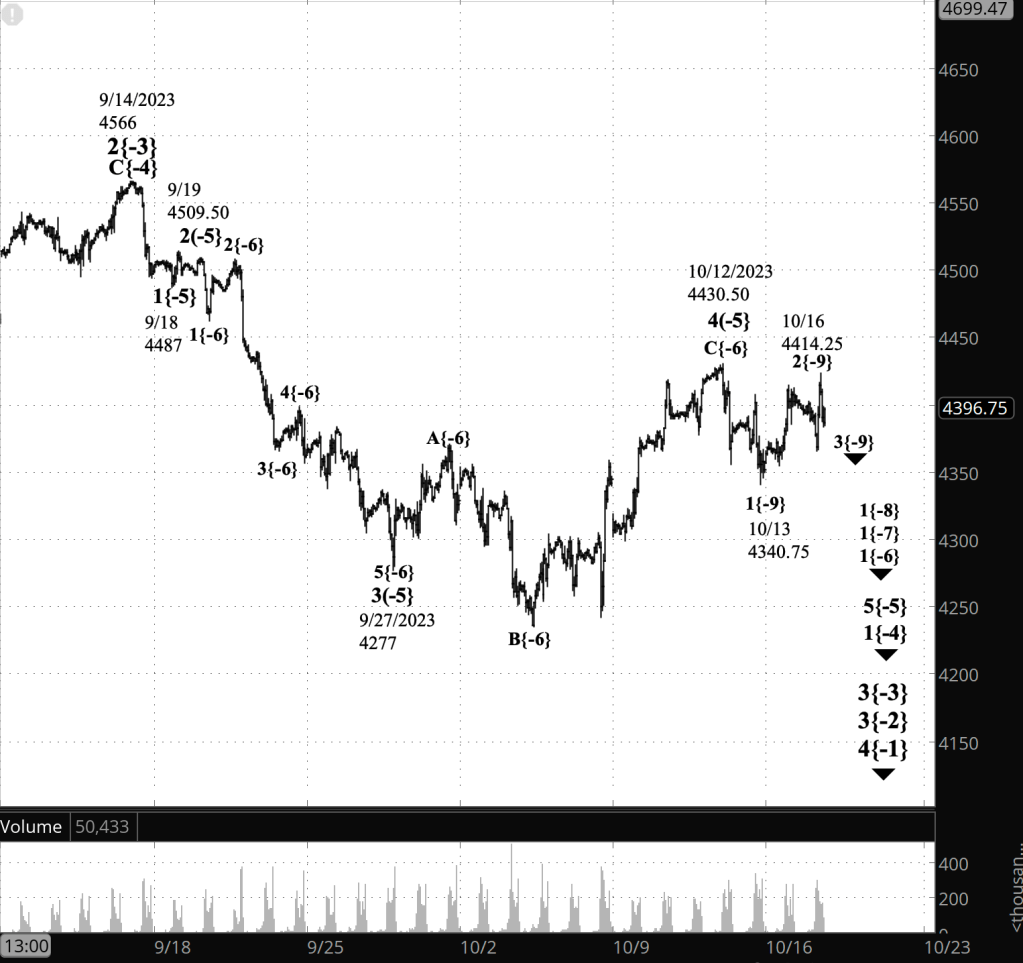
Half an hour before the closing bell. The S&P 500 futures rose to a session high of 4414.25 and then pulled back, fluctuating around 4400 except for a brief foray into the 4380s. This morning’s analysis is unchanged. A low degree upward correction, wave 2{-10}, is either still underway or perhaps ended at the high. I’ve updated the chart.

9:35 a.m. New York time

What’s happening now? The S&P 500 E-mini futures fluctuated sideways from the 4350s and the 4370s after trading resumed overnight, reaching higher into the 4380s as the opening bell approached.

What does it mean? A 5th-wave downtrend began on October 12 and is now in the early stages of its 1st subwave.

What are the alternatives? There are two:

Alternative #1: The degree labels are lower than the reality on the chart. The degree {-8} waves, for example, ought to be labeled {-7} and the {-9} wave changed to {-8}.

Alternative #2: The final leg of the upward correction — wave C{-6} within wave 4{-5} — ended at the overnight high and the correction is taking a compound structure. Declining wave X{-6}, a connector wave, has begun and will be followed by a second corrective pattern.

The Chart. I’ve broadened the chart to show the entirety, so far, of the 5th-wave downward correction, wave 5{-5} on the chart. At this point the main we’ve I’m tracking to understand the market are of degree {-5} and degree {-4}

[S&P 500 E-mini futures at 3:30 p.m., 55-minute bars, with volume]

What does Elliott wave theory say? Here are the waves that underly the analyses.

Here are the waves that underly the analyses.

Principal Analysis:

  • A downtrend, wave 3{-2}, began on July 27 and is underway.
  • Within wave 3{-2}, a smaller downtrend, wave 3{-3}, began on September 14 and is in its initial subwave, wave 1{-4}.
  • With wave 1{-4}, subwave 5{-5}, an downtrend, is underway, having begun on October 12.
  • Wave 5{-5} is in its first subwave, wave 1{-6}.

Alternative Analysis #1: Degrees

  • The low on October 13 was the end of wave 1{-9} within downtrending wave 3{-8}.

Alternative Analysis #2: Compound Correction

  • An upward correction, wave 4{-5}, is underway and is forming a compound structure. The first corrective pattern ended on October 12, and a declining connector subwave, wave X{-4}, is underway.

Big picture:

  • The wave 3{-2} downtrend is a subwave of wave 4{-1}, a downtrend that began on January 4, 2022.
  • Wave 4{-1}, in turn, is a subwave of wave 5{0}, an expanding Diagonal Triangle that began on December 26, 2018.
  • Wave 4{-1} may eventually reach the lower boundary of wave 5{0}, presently slightly below 1800 and declining further each day.
  • Wave 4{-1} will be followed by rising wave 5{-1}, the final wave in the Triangle.

We Are Here.

These are the waves currently in progress under my principal analysis. Each line on the list shows the wave number, with the subscript in curly brackets, the traditional degree name, the starting date, the starting price of the S&P 500 E-mini futures, and the direction of the wave.

  • S&P 500 Index:
  • 5{+3} Supercycle, 7/8/1932, 4.40 (up)
  • 5{+2} Cycle, 12/9/1974, 60.96 (up)
  • 5{+1} Primary, 3/6/2009, 666.79 (up)
  • 5{0} Intermediate, 12/26/2018, 2346.58 (up)
  • S&P 500 Futures and index:
  • 4{-1} Minor, 1/4/2022, 4953.25 (down) (futures), 4818.62 (down) (index)
  • S&P 500 Futures:
  • 3{-2} Minute, 7/27/2023, 3502 (down)

Reading the chart. Price movements — waves – – in Elliott wave analysis are labeled with numbers within trending waves and letters with corrective waves. The subscripts — numbers in curly brackets — designate the wave’s degree, which, in Elliott wave analysis, means the relative position of a wave within the larger and smaller structures that make up the chart. R.N. Elliott, who in the 1930s developed the form of analysis that bears his name, viewed the chart as a complex structure of smaller waves nested within larger waves, which in turn are nested within still larger waves. In mathematics it’s called a fractal structure, where at every scale the pattern is similar to the others.

Learning and other resources. Elliott wave analysis provides context, not prophecy. As the 20th century semanticist Alfred Korzybski put it in his book Science and Sanity (1933), “The map is not the territory … The only usefulness of a map depends on similarity of structure between the empirical world and the map.” And I would add, in the ever-changing markets, we can judge that similarity of structure only after the fact.

See the menu page Analytical Methods for a rundown on where to go for information on Elliott wave analysis.

By Tim Bovee, Portland, Oregon, October 16, 2023

Disclaimer

Tim Bovee, Private Trader tracks the analysis and trades of a private trader for his own accounts. Nothing in this blog constitutes a recommendation to buy or sell stocks, options or any other financial instrument. The only purpose of this blog is to provide education and entertainment.

No trader is ever 100 percent successful in his or her trades. Trading in the stock and option markets is risky and uncertain. Each trader must make trading decisions for his or her own account, and take responsibility for the consequences.

License
Creative Commons License

All content on Tim Bovee, Private Trader by Timothy K. Bovee is licensed under a Creative Commons Attribution-ShareAlike 4.0 International License.

Based on a work at www.timbovee.com.

Trader’s Notebook

3:30 p.m. New York time

Half an hour before the closing bell. The S&P 500 futures continued its trending 3rd-wave decline within a larger 1st wave downtrend that began on October 12. No change from this morning’s principal analysis.

I find it easy to get lost in the minutiae of the near-term charts, those small degrees, within the vast fractal pattern, that I use for my trading.

Occasionally, I like to remind myself that the dramatic rises and falls of those lower degrees are contained within much larger behemoths, slow-moving waves that determine the well-being of our households, our economy, our nation and ultimately the world.

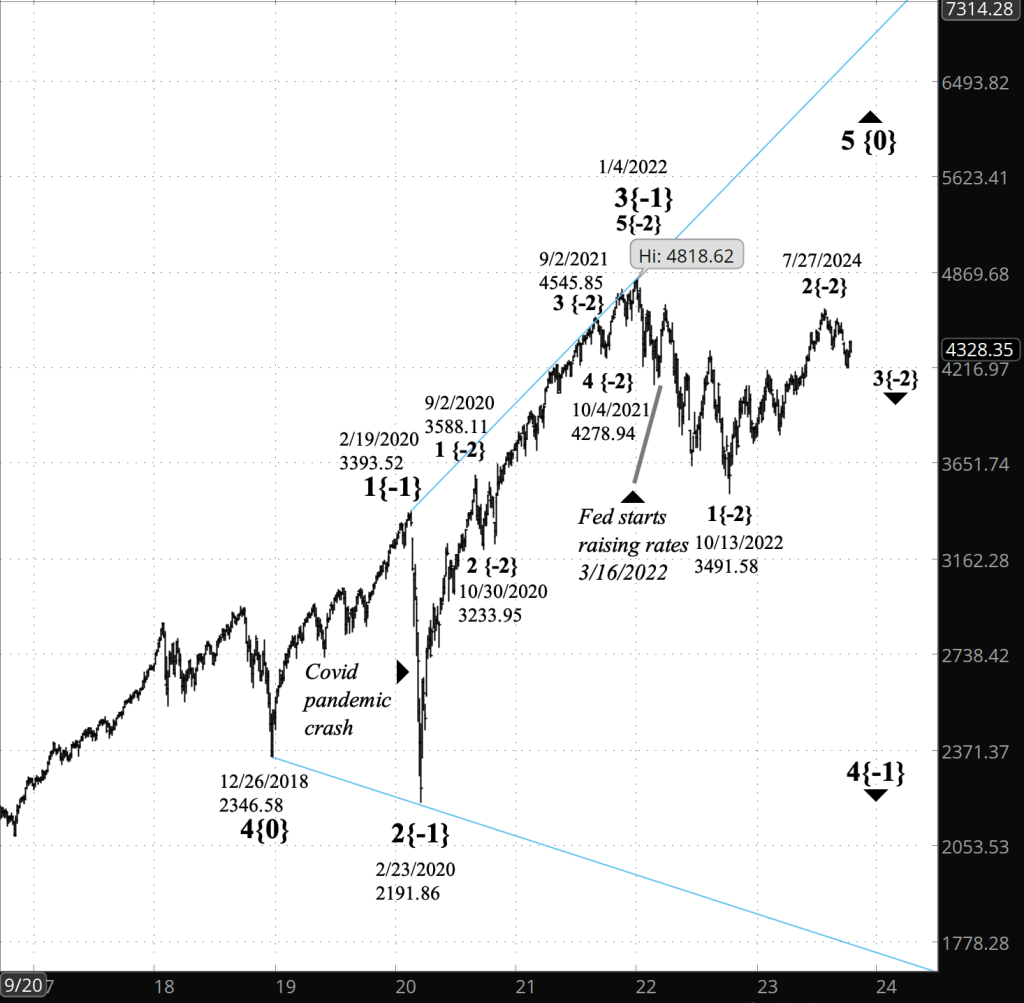
The following chart is of S&P 500 index showing the entirely of wave 5{0} — an Intermediate wave in the nomenclature of the inventor of Elliott Wave Theory, R.N. Elliott. Every wave we’ve seen in the index for the past five years has been a subwave of wave 5{0}, which began on December 26, 2018.

[S&P 500 index at 3:25 p.m., 3-day bars]

Wave 5{0} has taken the form of an expanding Diagonal Triangle and is the final subwave within uptrending wave 5{+1}. Internally, wave 5{0} is in turn in its next-to-the-last subwave, declining wave 4{-1}, which began on January 4, 2022, which in turn in its middle subwave, wave 3{-2}.

I’ve drawn in the triangle’s price channel with blue lines. If the chart proceeds as usual, the price in wave 4{-1} will approach the lower boundary, presently in the 1700s and moving lower each day. When the 4th wave is complete, wave 5{-1} will return to the triangle’s upper boundary, now in the 6720s and moving higher each day. And that will be the end of wave 5{0}, which will be followed by a very large downtrend. Which, of course, will have its upwaves and downwaves of various degrees, large and small, that will give futures traders many opportunities to make a fortune or lose it.

When I posted this morning’s analysis I had not yet determined how the reanalysis of the chart impacted the alternatives to the principal analysis. I’ve concluded that Alternative #1 in the October 12 post is no longer valid. The alternative postulated that wave C{-6} within wave 4{-5}, the larger upward correction that began on September 27 is underway.

Alternative #2 in that same post is, however, still a viable alternative, and I’ve inserted it back into the “What are the alternatives” section below.

I’ve updated this morning’s chart, below.

9:35 a.m. New York time

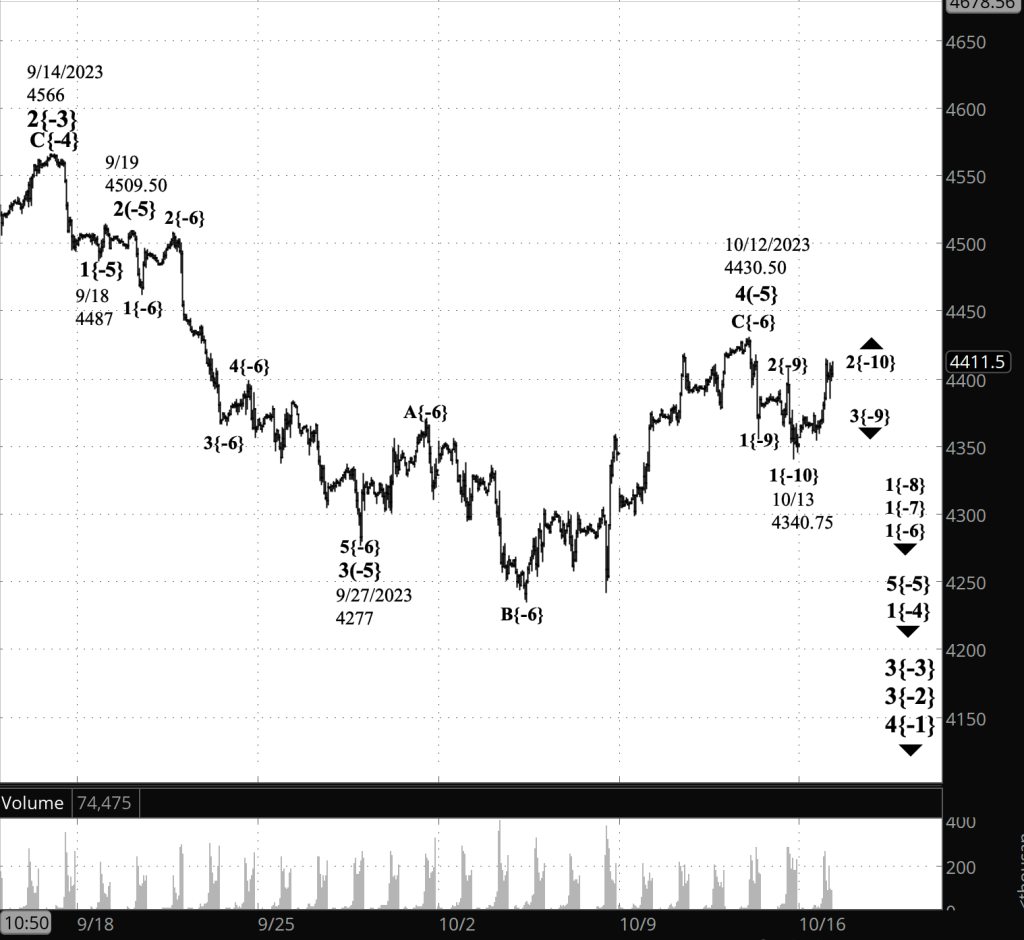
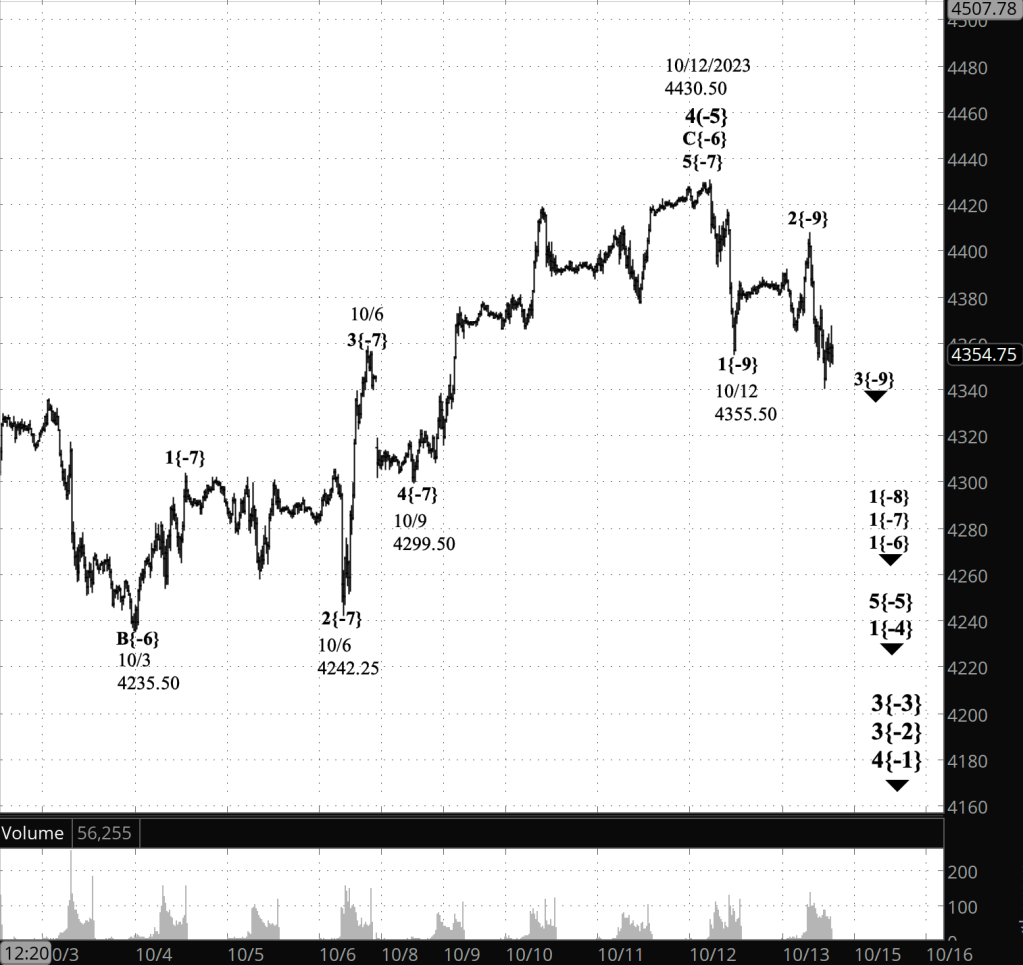
What’s happening now? The S&P 500 E-mini futures rose overnight, carrying the price from the 43760s to above 4400.

What does it mean? I had identified the movement as part a low-degree 4th wave upward correction that began on October 12 from 4355.50. But then the chart broke a rule of Elliott Wave Theory: If a 4th wave moves above the 1st wave of the same degree, then it’s not a 4th wave. Something else is going on.

The only possible “something else”, it seems to me at first glance, is that the rise from October 11 is that the decilne on October 12 is a very rapid five-wave downtrend that is a 1st wave — wave 1{-9} on the chart. And the rise that followed and is still underway is a 2nd wave upward correction — wave 2{-9}, both within downtrending wave 1{-8}.

A 2nd wave, under the rules of Elliott Wave Theory, can’t move beyond the start of the preceding 1st wave, which is 4430.50 at this point. There’s still some distance to go.

It is common for 2nd waves to end at the 78.6% Fibonacci retracement level in relation to the preceding 1st wave, which is 4404.24 on this chart. When the 2nd wave is complete, it will be followed by a 3rd wave downtrend, wave 3{-9}.

What are the alternatives? There is one. The final leg of the upward correction — wave C{-6} within wave 4{-5} — ended at the overnight high and the correction takes a compound structure. Declining wave X{-6}, a connector wave, has begun and will be followed by a second corrective pattern.

[S&P 500 E-mini futures at 3:30 po.m., x-minute bars, with volume]

What does Elliott wave theory say?

Here are the waves that underly the analyses.

Principal Analysis:

  • A downtrend, wave 3{-2}, began on July 27 and is underway.
  • Within wave 3{-2}, a smaller downtrend, wave 3{-3}, began on September 14 and is in its initial subwave, wave 1{-4}.
  • With wave 1{-4}, subwave 5{-5}, an downtrend, is underway, having begun on October 12.
  • Wave 5{-5} is in its first subwave, wave 1{-6}.

Alternative Analysis:

  • An upward correction, wave 4{-5}, is underway and is forming a compound structure. The first corrective pattern ended on October 12, and a declining connector subwave, wave X{-4}, is underway.

Big picture:

  • The wave 3{-2} downtrend is a subwave of wave 4{-1}, a downtrend that began on January 4, 2022.
  • Wave 4{-1}, in turn, is a subwave of wave 5{0}, an expanding Diagonal Triangle that began on December 26, 2018.
  • Wave 4{-1} may eventually reach the lower boundary of wave 5{0}, presently slightly below 1800 and declining further each day.
  • Wave 4{-1} will be followed by rising wave 5{-1}, the final wave in the Triangle.

We Are Here.

These are the waves currently in progress under my principal analysis. Each line on the list shows the wave number, with the subscript in curly brackets, the traditional degree name, the starting date, the starting price of the S&P 500 E-mini futures, and the direction of the wave.

  • S&P 500 Index:
  • 5{+3} Supercycle, 7/8/1932, 4.40 (up)
  • 5{+2} Cycle, 12/9/1974, 60.96 (up)
  • 5{+1} Primary, 3/6/2009, 666.79 (up)
  • 5{0} Intermediate, 12/26/2018, 2346.58 (up)
  • S&P 500 Futures and index:
  • 4{-1} Minor, 1/4/2022, 4953.25 (down) (futures), 4818.62 (down) (index)
  • S&P 500 Futures:
  • 3{-2} Minute, 7/27/2023, 3502 (down)

Reading the chart. Price movements — waves – – in Elliott wave analysis are labeled with numbers within trending waves and letters with corrective waves. The subscripts — numbers in curly brackets — designate the wave’s degree, which, in Elliott wave analysis, means the relative position of a wave within the larger and smaller structures that make up the chart. R.N. Elliott, who in the 1930s developed the form of analysis that bears his name, viewed the chart as a complex structure of smaller waves nested within larger waves, which in turn are nested within still larger waves. In mathematics it’s called a fractal structure, where at every scale the pattern is similar to the others.

Learning and other resources. Elliott wave analysis provides context, not prophecy. As the 20th century semanticist Alfred Korzybski put it in his book Science and Sanity (1933), “The map is not the territory … The only usefulness of a map depends on similarity of structure between the empirical world and the map.” And I would add, in the ever-changing markets, we can judge that similarity of structure only after the fact.

See the menu page Analytical Methods for a rundown on where to go for information on Elliott wave analysis.

By Tim Bovee, Portland, Oregon, October 13, 2023

Disclaimer

Tim Bovee, Private Trader tracks the analysis and trades of a private trader for his own accounts. Nothing in this blog constitutes a recommendation to buy or sell stocks, options or any other financial instrument. The only purpose of this blog is to provide education and entertainment.

No trader is ever 100 percent successful in his or her trades. Trading in the stock and option markets is risky and uncertain. Each trader must make trading decisions for his or her own account, and take responsibility for the consequences.

License
Creative Commons License

All content on Tim Bovee, Private Trader by Timothy K. Bovee is licensed under a Creative Commons Attribution-ShareAlike 4.0 International License.

Based on a work at www.timbovee.com.