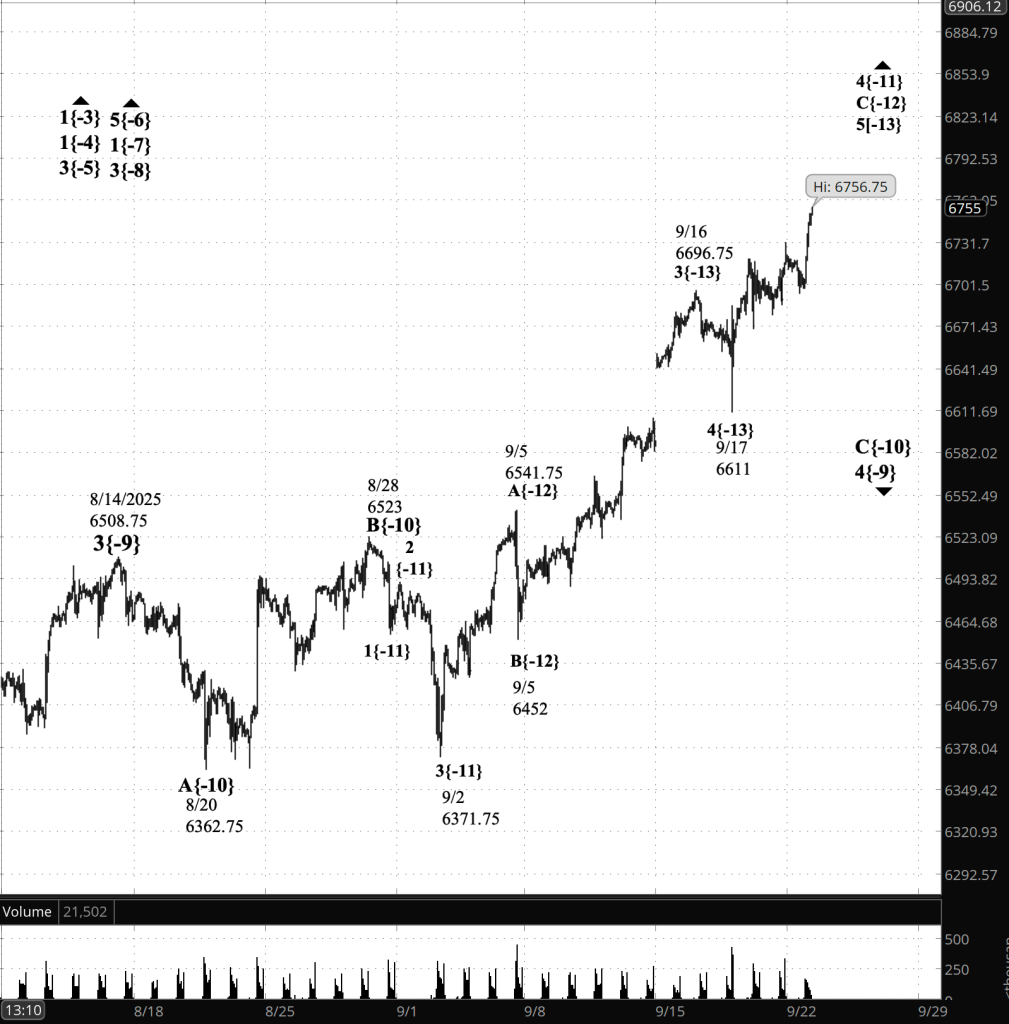
3:30 p.m. New York time
Half an hour before the closing bell. The S&P 500 rose sharply during the session, exceeding the previous peak.
Elliott Wave Theory: The new high also confirmed that wave C within a 4th-wave upward correction that began on September 5 is underway.
There was a possibility, discussed in the morning analysis, that the September 30 peak was the end of wave C, and that the decline that followed was an X wave, connecting the first three-wave corrective pattern with a second such pattern in a complex correction.
The complex correction by my count will happen. But the first corrective pattern is still underway.
Wave C is expected to end somewhere between 6765 and 6800, based on the size of other waves in the structure, keeping in mind that forecasting is an informed guess at its best. I’m never surprised when a forecast fails to hit the mark.
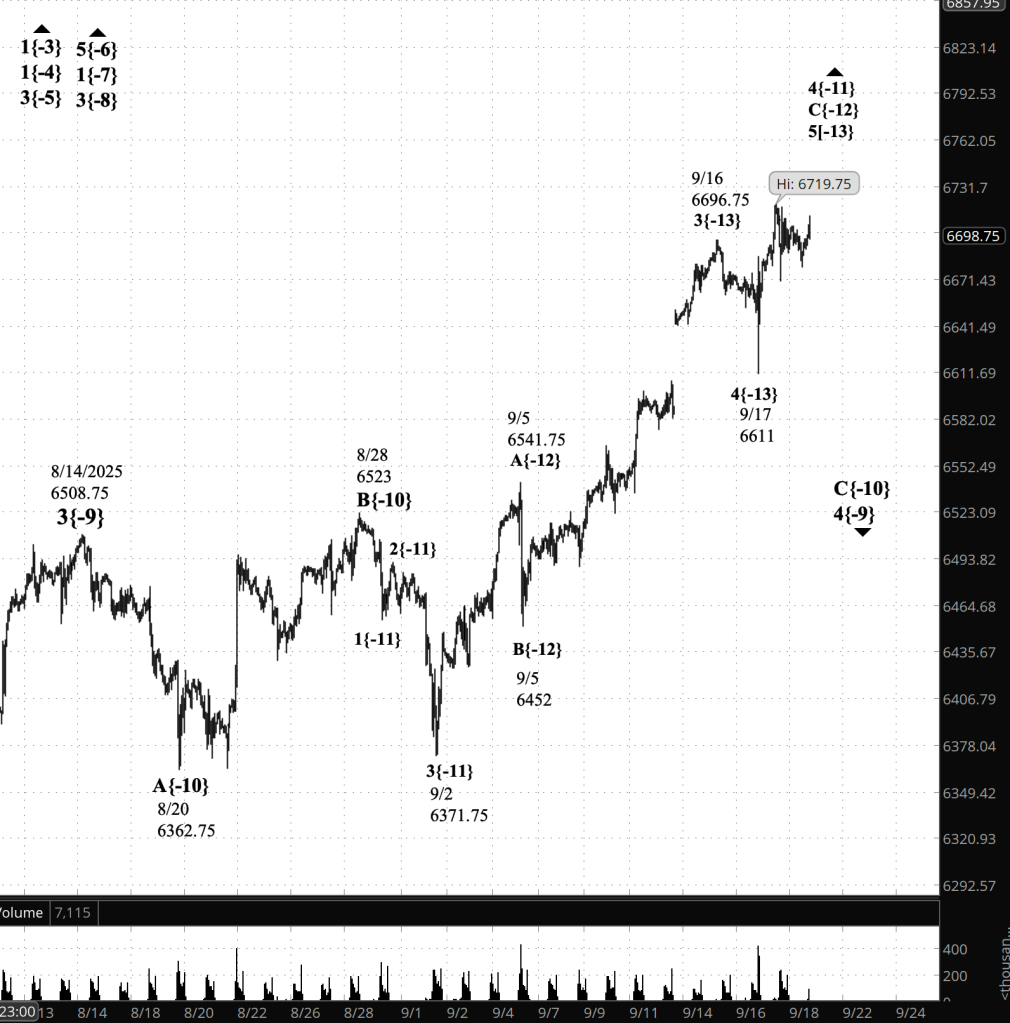
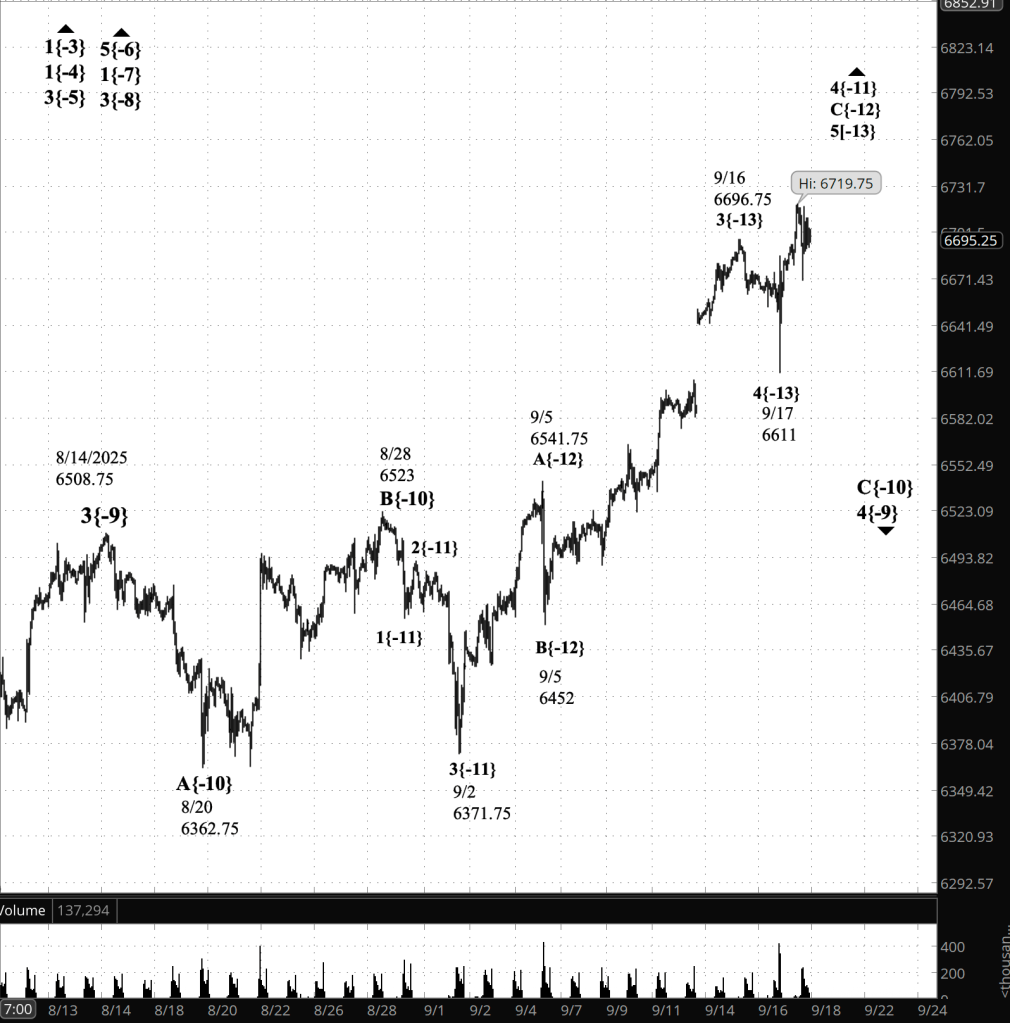
9:35 a.m. New York time.
What’s happening now. The S&P 500 E-mini futures fell overnight, down to 6680, as the federal government partially shutdown over a funding bill dispute in Congress. The price then reversed, rising back into the 6710s.
What does it mean? Elliott Wave Theory sees a couple of possibilities here. One is that we’re in the midst of yet another falling subwave within rising wave C of a rising 4th-wave correction. If that’s the case, then wave C will likely exceed the prior high, 6743.50, as wave C continues.
Alternatively, as wave C carried the parent 4th wave into the territory of the preceding 1st wave, it became clear that wave 4 was tracing a complex correction pattern. Most corrective waves have three subwaves — A, B and C. Typically, that’s the end of the correction. In complex corrections, the three-wave corrective pattern is followed by a separator wave — an X-wave in the earlier Elliott Wave Theory nomenclature, which I still use. It’s possible that September 30 peak was the end of wave C, and decline that followed, still underway, is wave X, to be followed by another three-wave corrective pattern within wave 4. A complex correction can contain up to three corrective patterns.
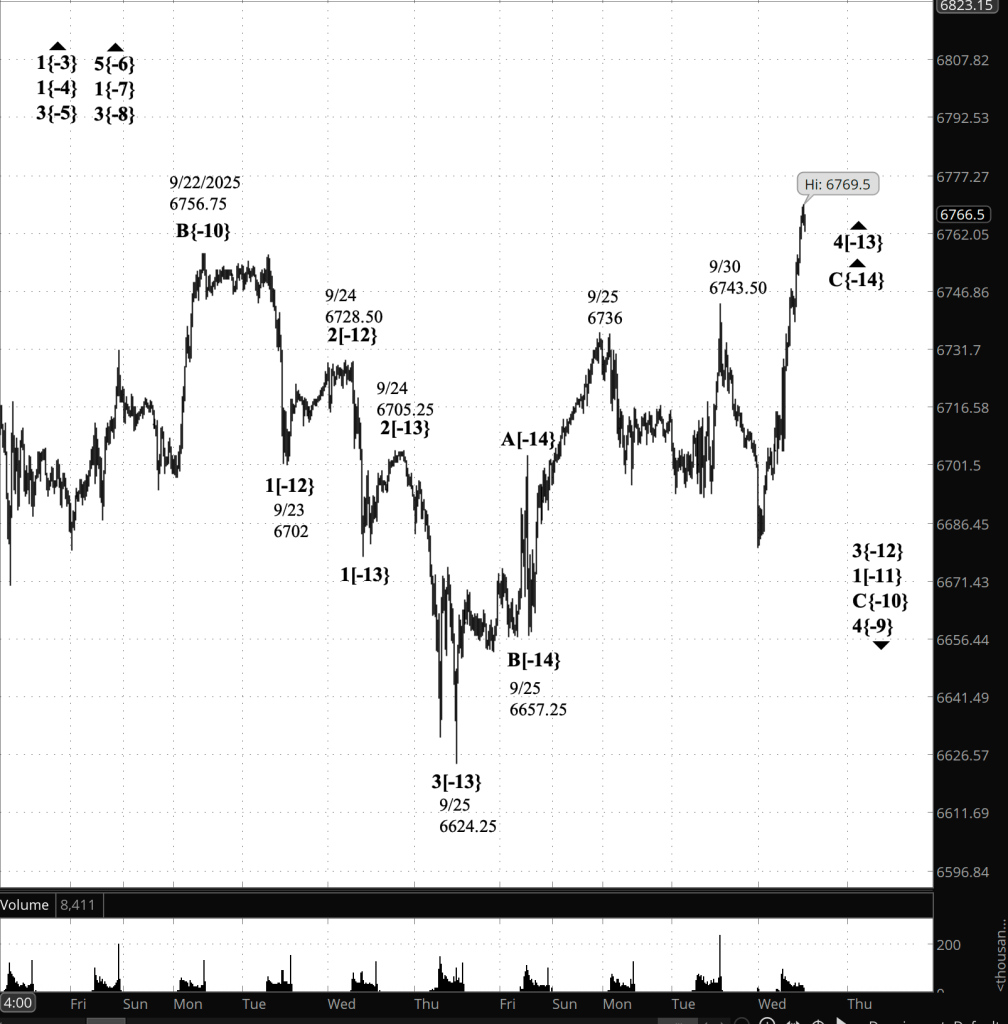
[S&P 500 E-mini futures at 3:30 p.m., 20-minute bars, with volume]
Waves Now Underway
These are the waves currently in progress under my principal analysis. Each line on the list shows the wave number, with the subscript in curly brackets, the traditional degree name, the starting date, the starting price of the S&P 500 E-mini futures, and the direction of the wave.
- S&P 500 Index:
- 5{+3} Supercycle, 7/8/1932, 4.40 (up)
- 5{+2} Cycle, 12/9/1974, 60.96 (up)
- 5{+1} Primary, 3/6/2009, 666.79 (up)
- 5{0} Intermediate, 2/11/2016, 1810.10 (up)
- 3{-1} Minor, 3/23/2020, 2191.36 (up)
- 1{-2} Minute, 7/31/2025, 6468.50 (down)
- S&P 500 Futures
- 1{-3} Minuette, 10/13/2022, 4603 (up)
- 1{-4} Subminuette, 4/7/2025, 4832 (up)
- 3{-5} Micro, 4/21/2025, 5127.25 (up)
- 5{-6} Submicro, 8/1/2025, 6249.50 (up)
- 1{-7} Minuscule, 8/1/2025, 6349.50 (up)
- 3{-8} (unnamed), 8/5/2025, 6313.25 (up)
- 4{-9} (unnamed), 8/14/2025, 6508.75 (down)
- C{-10} (unnamed), 9/22/2025, 6756.75 (down)
- 1{-11} (unnamed), 9/22/2025, 6756.75 (down)
- 3{-12} (unnamed), 9/24/2025, 6728.50 (down)
- 4{-13} (unnamed), 9/25/2025, 6624.25 (up)
- C{-14} (unnamed), 9/25/2025, 6657.25 (up)
Reading the chart. Price movements — waves – – in Elliott Wave Theory analysis are labeled with numbers within trending waves and letters with corrective waves. The subscripts — numbers in curly brackets — designate the wave’s degree, which, in Elliott Wave analysis, means the relative position of a wave within the larger and smaller structures that make up the chart. R.N. Elliott, who in the 1930s developed the form of analysis that bears his name, viewed the chart as a complex structure of smaller waves nested within larger waves, which in turn are nested within still larger waves. In mathematics it’s called a fractal structure, where at every scale the pattern is similar to the others.
Learning and other resources. Elliott Wave analysis provides context, not prophecy. As the 20th century semanticist Alfred Korzybski put it in his book Science and Sanity (1933), “The map is not the territory … The only usefulness of a map depends on similarity of structure between the empirical world and the map.” And I would add, in the ever-changing markets, we can judge that similarity of structure only after the fact.
See the menu page Analytical Methods for a rundown on where to go for information on Elliott Wave analysis.
By Tim Bovee, Portland, Oregon, October 1 , 2025
Disclaimer
Tim Bovee, Private Trader tracks the analysis and trades of a private trader for his own accounts. Nothing in this blog constitutes a recommendation to buy or sell stocks, options or any other financial instrument. The only purpose of this blog is to provide education and entertainment.
No trader is ever 100 percent successful in his or her trades. Trading in the stock and option markets is risky and uncertain. Each trader must make trading decisions for his or her own account, and take responsibility for the consequences.
All content on Tim Bovee, Private Trader by Timothy K. Bovee is licensed under a Creative Commons Attribution-ShareAlike 4.0 International License.
Based on work at www.timbovee.com


You must be logged in to post a comment.