3:30 p.m. New York time
Half an hour before the closing bell. Elliott Wave Theory: The S&P 500 futures continue to work through a 4th-wave downward correction that began over night and so far has retraced a great deal of the preceding 3rd wave, having paused at 78.6% of the Fibonacci retracement ladder.
The waves are of a relatively small degree — days rather than weeks, and I expect wave 4 to end its decline an wave 5 to begin its rise, perhaps tomorrow or perhaps on Wednesday.
12:05 p.m. New York time.
[Note: Late due to technical issues.]
What’s happening now. The S&P 500 E-mini futures .resumed trading with a 24.75 opening gap to the upside as the new week began. The price rose further to 6457.75, and then reversed, working its way back down into the 6410s.
What does it mean? Elliott Wave Theory sees the opening gap and subsequent rise as the end of the low-degree 3rd wave that began on July 25 and the beginnng of a 4th-wave downward correction. Wave 5 will follow, completing a larger 5th wave that began on July 24.
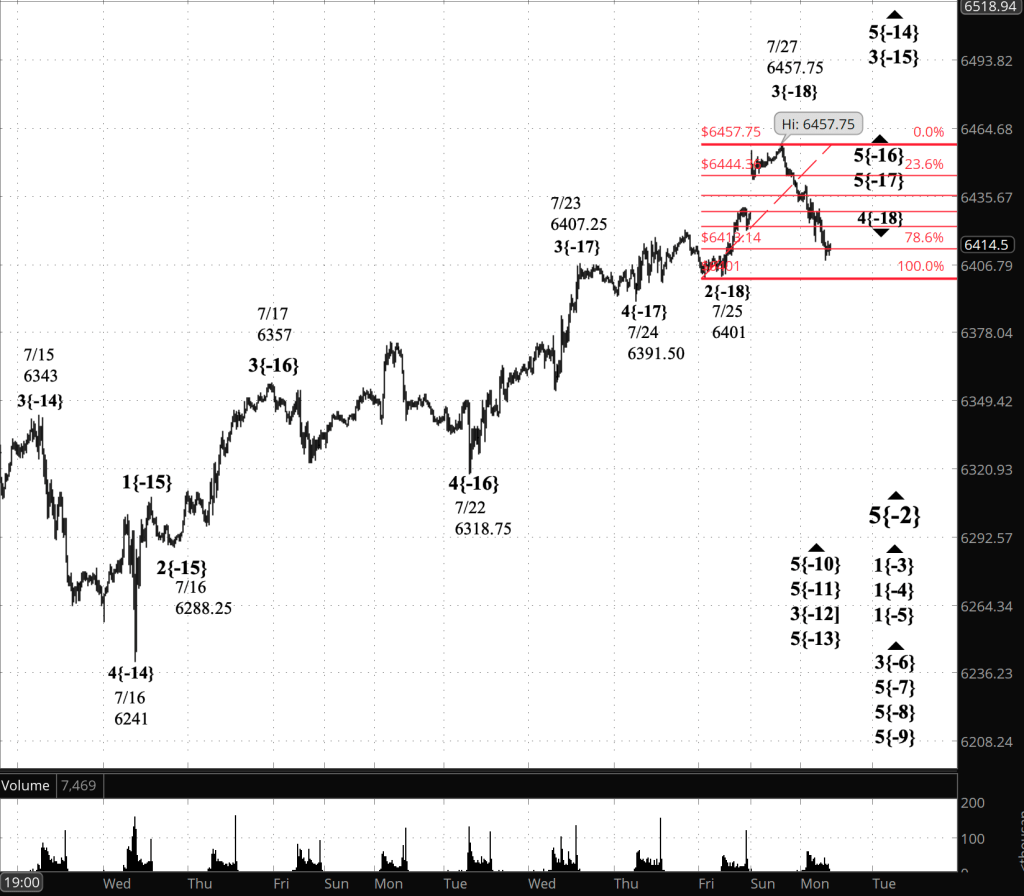
[S&P 500 E-mini futures at 12:05 p.m., 20-minute bars, with volume]
Waves Now Underway
These are the waves currently in progress under my principal analysis. Each line on the list shows the wave number, with the subscript in curly brackets, the traditional degree name, the starting date, the starting price of the S&P 500 E-mini futures, and the direction of the wave.
- S&P 500 Index:
- 5{+3} Supercycle, 7/8/1932, 4.40 (up)
- 5{+2} Cycle, 12/9/1974, 60.96 (up)
- 5{+1} Primary, 3/6/2009, 666.79 (up)
- 5{0} Intermediate, 2/11/2016, 1810.10 (up)
- 3{-1} Minor, 3/23/2020, 2191.36 (up)
- 5{-2} Minute, 4/7/2025, 4832 (up)
- S&P 500 Futures
- 1{-3} Minuette, 4/7/2025, 4832 (up)
- 1{-4} Subminuette, 4/7/2025, 4832 (up)
- 1{-5} Micro, 4/7/2025, 4832 (up)
- 3{-6} Submicro, 4/24/2025, 5260 (up)
- 5{-7} Minuscule, 4/25/2025, 5550 (up)
- 5{-8} (unnamed), 5/7/2025, 5596 (up)
- 5{-9} (unnamed), 5/23/2025, 5756.50 (up)
- 5{-10} (unnamed), 6/22/2025, 5959 (up)
- 5{-11} (unnamed), 6/27/2025, 6183.25 (up)
- 3{-12} (unnamed), 6/30/2025, 6224 (up)
- 5{-13} (unnamed), 7/14/2025, 6529.75 (up)
- 5{-14} (unnamed), 7/16/2025, 6241 (up)
- 3{-15} (unnamed), 7/16/2025, 6288.25 (up)
- 5{-16} (unnamed), 7/22/2025, 6318.75 (up)
- 5{-17} (unnamed), 7/24/2024, 6391.50 (up)
- 4{-18} (unnamed), 7/25/224, 6457.75 (down)
Reading the chart. Price movements — waves – – in Elliott Wave Theory analysis are labeled with numbers within trending waves and letters with corrective waves. The subscripts — numbers in curly brackets — designate the wave’s degree, which, in Elliott Wave analysis, means the relative position of a wave within the larger and smaller structures that make up the chart. R.N. Elliott, who in the 1930s developed the form of analysis that bears his name, viewed the chart as a complex structure of smaller waves nested within larger waves, which in turn are nested within still larger waves. In mathematics it’s called a fractal structure, where at every scale the pattern is similar to the others.
Learning and other resources. Elliott Wave analysis provides context, not prophecy. As the 20th century semanticist Alfred Korzybski put it in his book Science and Sanity (1933), “The map is not the territory … The only usefulness of a map depends on similarity of structure between the empirical world and the map.” And I would add, in the ever-changing markets, we can judge that similarity of structure only after the fact.
See the menu page Analytical Methods for a rundown on where to go for information on Elliott Wave analysis.
By Tim Bovee, Portland, Oregon, July 28, 2025
Disclaimer
Tim Bovee, Private Trader tracks the analysis and trades of a private trader for his own accounts. Nothing in this blog constitutes a recommendation to buy or sell stocks, options or any other financial instrument. The only purpose of this blog is to provide education and entertainment.
No trader is ever 100 percent successful in his or her trades. Trading in the stock and option markets is risky and uncertain. Each trader must make trading decisions for his or her own account, and take responsibility for the consequences.
All content on Tim Bovee, Private Trader by Timothy K. Bovee is licensed under a Creative Commons Attribution-ShareAlike 4.0 International License.
Based on a work at www.timbovee.com.


You must be logged in to post a comment.