Just to put things in perspective…

It has been an interesting ride, the past few days, as the trees begin to blossom, the hay fever pollen begins its disruptive whirl, and the stock market trips on a rock and falls off a cliff.

The Coronavirus Crash of 2020, young though it is, promises to have a large impact on the economy, our politics — on how we feel about our lives.

But a look at the long-term chart shows that, so far at least, it’s no big deal.

Screen Shot 2020-02-28 at 7.42.22 AM

The chart above shows the Dow Jones Industrial Average from 1906 to a few minutes ago today. The chart is logarithmic, meaning that it accurately shows percentage change. Compared to the Crash of 1929 or the Crash of 1987, or even the Crash of 2008 that kicked off the Great Recession, which broke our world and stunted the prospects of a generation, our Coronavirus Crash of 2020 so far is barely visible.

Yet, there’s a less hopeful lesson to be drawn from the chart. The markets have been on the rise since the Crash of 1929 hit its low point in 1932.

One reality of the markets is that what goes up will eventually go down. No trend lasts forever. So the possibility exists that the decline from the market high of a few days ago is not just a correction of the last market rise, but rather is a multi-year, perhaps multi-decade correction of the rise from 1932.

Of course, any decline of that magnitude would have long uptrends within the dominant downtrend. So we would still have bull seasons and bear seasons. Life, and trading, would go on., although perhaps with less optimism than we’ve seen in the past 88-year-long bull market that began in the Great Depression.

Note: I don’t attribute the downturn solely to the COVID-19 (coronavirus) pandemic that appears to have begun. I think there are a lot of factors at work, including a full decade of economic growth, without a recession. Business downturns tend to happen more often than that. The consensus has been developing for months that it’s time for the economy to shed some of its optimism. If I’m correct, then we could be in for a significant decline. If I’m not correct, then, let the good times roll.

By Tim Bovee, Portland, Oregon, February 28, 2020

Read More »

Live: Friday, February 28, 2020

11:20 a.m. New York time

I’ve posted a brief discussion of the long-term chart. I mean, really long term: The Dow Jones Industrial Average from 1906 until today. It’s titled, “Just to put things in perspective…

10:10 a.m. New York time

In stocks, one of my AAPL lots, the one with the highest entry price, triggered its stop/loss and was sold. AAPL is in the  Genetics, Robotics and S&P 500 portfolios. Two lots remain.

The AAPL sale provided a $258.78 credit per share, down $59.22 from the entry price, an 18.6% loss over 10 days for a -680% annual rate.

Also triggered, the stop/loss on another S&P 500 stock, QRVO, for a $92.52 credit per share, down $17.74 from entry, producing a 16.1% loss over 15 days for a -391% annual rate.

Remaining stock positions:  AAPL and TSM.

9:55 a.m. New York time

Today is management day for my short iron condor options positions expiring after the closing bell on March 20. It’s the day that I exit my profitable positions, only retaining the losing positions in the hope that they’ll return to profitability in the 21 days until expiration.

Actually, it’s going to be a very easy management day, for none of my nine short iron condor positions is profitable at present. Indeed, all contain options that are trading in the money. For a short options position, in the money means the position will be unprofitable when it expires, and indeed almost always will be exchanged for short shares of stock, a minor pain in the neck when it happens.

Here’s table showing how far in the money my positions are this morning. As an analytical tool, I’ve taken the 14-day average true range (ATR) — a measure of how far a stock can be expected to fluctuate in a day — and divided it by the distance the price is in the money, showing how many days of normal trading it would take to return to profitability.

SYM
LAST
SHORT PUT
DIFF%
DIFF$
ITM?
ATR
ATR DAYS
QQQ 202.04 215 -6.0% (12.96) x 4.15 -3.1
SMH 126.83 137 -7.4% (10.18) x 3.71 -2.7
XBI 88.45 89 -0.6% (0.55) x 2.29 -0.2
XLB 52.36 58 -9.7% (5.64) x 1.01 -5.6
XLE 44.56 51.21 -13.0% (6.65) x 1.26 -5.3
XLI 73.16 80 -8.6% (6.84) x 1.36 -5.0
XLK 85.94 95 -9.5% (9.06) x 2.08 -4.4
XLP 57.73 62 -6.9% (4.27) x 0.76 -5.6
XLV 92.44 99 -6.6% (6.56) x 1.53 -4.3

By that measure, XBI is in the best shape, only 0.2 of its ATR day way from the profit point. The worst is XLB, which is 5.6 ATR days away from profitability.

There’s no way to salvage these positions by selling off losing options. A short spread strategy limits the potential loss, and implicitly when I set up the position, I knew what I could afford to lose. So I’ll hang on to the positions and take my profits if any do indeed return to profitability, or take my losses if they don’t.

By Tim Bovee, Portland, Oregon, February 28, 2020

Read More »

Live: Thursday, February 27, 2020

7:45 p.m. New York time

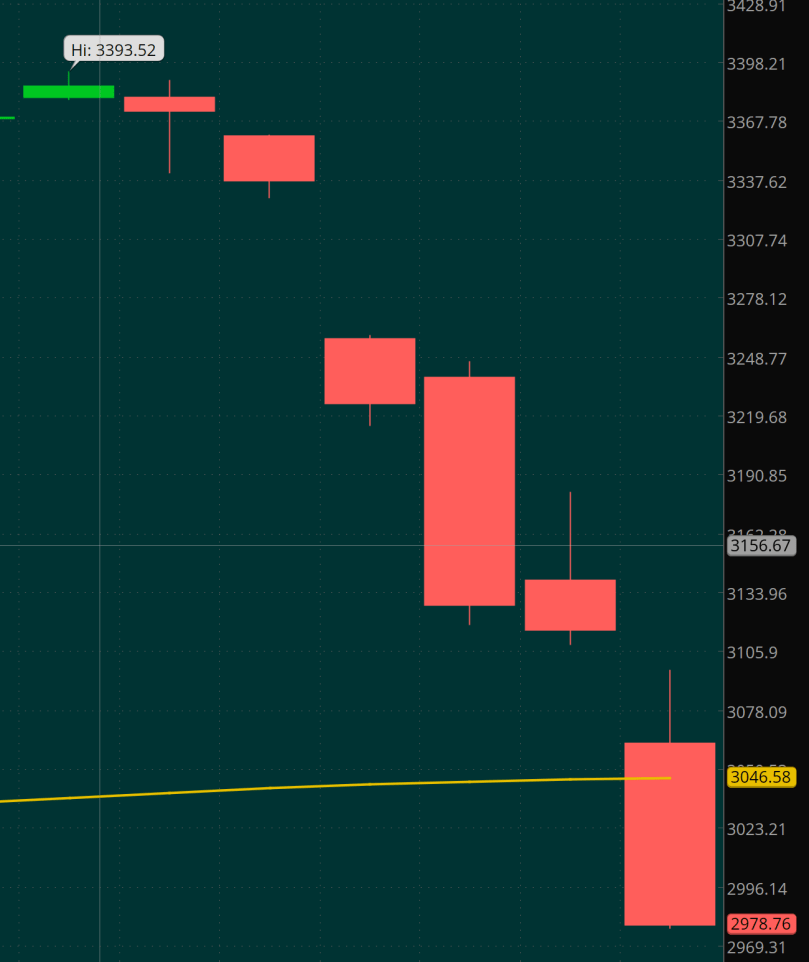
And now the exciting part of the day. The S&P500 closed below the average price of the past 200 days — a moving average. This is only the sixth time that has happened after January 2009, when a below average close kicked off the crash of the Great Recession. Since, a move below the 200 day moving average has happened in June 2010, August 2011, August 2015, October 2018, May 2019, and now, today.

Some were short-term sojourns below the moving average. The 2019, 2015 and 2011 declines were significant. The 2009 drop below the moving average accompanied the Great Recession, which had and is still has an impact on our lives.
Screen Shot 2020-02-27 at 4.40.54 PM

7:20 p.m. New York time

Three additional stock positions triggered their stops shortly before the closing bell. Here are the results:

  • AEL in the Growth Portfolio, sold for a $27.19 credit per share, down $5.91 from the entry price, a 17.9% loss over seven days for a -931% annual rate.
  • KBH in Value, for a $343.83 credit, down $5.10 from the entry price, a 12.8% loss over seven days for a -666% annual rate.
  • RL in the S&P 500, for a $102.37 credit, down $19.60 from the entry price, down 16.1% over 13 days for a -451% annual rate.

I have three stock positions left, not counting my new grown income positions in TLT, the long-term Treasury bonds exchange-funded fund. Those left are AAPL in the Genetics, Robotics and S&P 500 portfolios, QRVO in the S&P 500, and TSM in Robotics.

4:10 p.m. New York time

AEL, KBH and RL hit their stops. Results to come.

1:35 p.m. New York time

INVA in the Momentum Portfolio has triggered its stop/loss, for a $14.03 credit per share, down $1.22 from the entry price. The position sustained an 8.0% loss over six days for a -487% annual rate.

1:10 p.m. New York time

BRY in the Value Portfolio has triggered its stop loss, for a $6.40 credit, down 59 cents per share from the entry price. The return was an 8.4% loss over 29 days for a -105% annual rate.

11:20 a.m. New York time

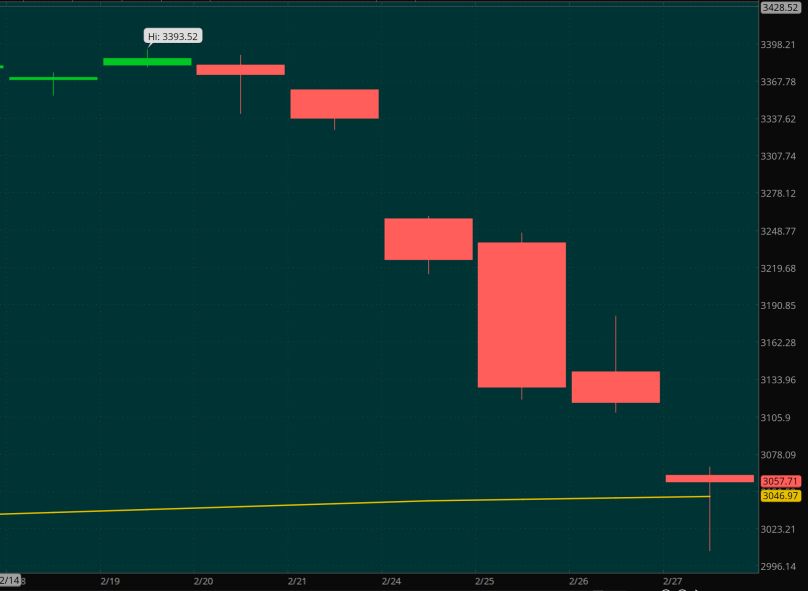
Every exit strategy requires a re-entry strategy. Here’s mine.

First, a chart of the index showing the decline, including the price piercing the 200-day moving average before recoiling back above.
Screen Shot 2020-02-27 at 8.14.23 AM

If the S&P 500 closes below it’s 200-day moving average and then continues to drop in subsequent days, I shall consider the market to be in a longer-term downtrend and shall rework my trading strategies, using more short options spreads, a great vehicle for trading a declining market.

If the S&P 500 moves above its peak prior to the present decline, 3393.52, then I shall consider the downtrend to have ended and shall return to my normal strategy in bullish times, using the Zacks analysis.

In all cases my decision will also be informed by the Elliott Wave count, which I’ve used in the past. A change of the Elliott Wave analysis to uptrending at a reasonably high level would prompt a re-entry, even if below the 200-day moving average. A continuation of the Elliott count as downtrending would keep me out of stocks even if the S&P500 is above its recent peak.

10:40 a.m. New York time

I have placed the funds freed from the exits into TLT, an exchange-traded fund tracking the 30-year Treasury bonds. It is rising, as it tends to do when there’s an expectation of the Federal Reserve lowering rates. And it pays a dividend yielding about 2% annually. Liquidity, capital gains, a reasonable dividend — not a bad parking spot in stormy weather.

10:10 a.m.  New York time

Eleven positions triggered their tightened stop/losses in the first 15 minutes of trading, and then the sell-storm calmed. One of the positions, REGN, showed a profit. I exited my other profitable positions on Wednesday.

Below are the results of today’s exits so far, in spreadsheet form. (Two spreadsheets, to fit the page width.)

First, information about the positions traded and their portfolios, and the credit received from the trade:

sym portfolio bench credit
APAM momentum x 30.08
DAL sp500 x 46.14
DVA momentum sp500 x 78.77
GIII value 22.07
IBP growth x 64.11
LITE growth 74.10
PHM growth sp500 41.23
REGN genetics 461.67
SNX growth 129.16
STM growth 27.10
TER robotics 59.53

And the results of the trades, in dollars and percentages.

sym return/share$ return% days annualized%
APAM -6.25 -17.2% 20 -314%
DAL -12.67 -21.5% 14 -562%
DVA -9.27 -10.5% 15 -256%
GIII -5.84 -20.9% 17 -449%
IBP -11.17 -14.8% 13 -417%
LITE -18.20 -19.7% 16 -450%
PHM -4.29 -9.4% 27 -127%
REGN 62.83 15.8% 7 +821%
SNX -13.27 -9.3% 22 -155%
STM -3.78 -12.3% 16 -280%
TER -11.62 -16.3% 21 -284%

9:40 a.m. New York time

Before the opening bell I tightened my stop/losses on everything to a trailing percentage reflecting one day’s average movement, using the ATRWilder (average true range) as a basis. The range of stops was from 2% to 4%. And a number have been triggered in the first 10 minutes of trading. I’lll wait until the sell-storm calms and then post results.

By Tim Bovee, Portland, Oregon, February 27, 2020

Read More »

Live: Wednesday, February 26, 2020

11:40 a.m. New York time

In stocks, I exited three profitable positions. Normally I cut my losers and keep my winners, but this is a circumstance where the markets, after their dramatic declines, may well bounce back. So, prudence dictates that I preserve what what I earned and optimism dictates that I wait and see what happens to the rest.

The exits:

  • CDNA, from the Genetics Portfolio, for a $25.47 credit, up $1.50 from the entry debt, producing a 6.3% return over 40 days for a +57% annual rate.
  • MOD, Value Portfolio, for an $8.30 credit, up 43 cents from entry, for a 5.5% return over 22 days, a +91% annual rate.
  • TCEHY, Robotics Portfolio, for a $51.54 credit, up $3.35 from the entry debit, a 7.0% return over 27 days for a +94% annual rate.

I’m hanging on to REGN, my biggest earner, which contrary to all the other stocks in my portfolios continues to rise. I’m keeping a close watch on it, and shall exit if it drops below the low of the current day. REGN is presently showing a 12% return.

I plan no entries today, and the Zacks algorithm didn’t remove any stocks from their portfolios.

In my nine short iron condor options, five continue to be priced in the money, below the strike price on their short puts. For a short position, in the money is when a trader loses money. The three ITM short iron condors are XLB, XLE, XLI, XLK and XLV.

A bounce back up in the broad markets will bring the five positions back into potentially profitable territory. When I manage winners (if any) on Friday, I shall also decide about the losers, either exiting the put legs, during them into bear call spreads, or hanging on to them in the hope that their prices will return to profitable ranges.

By Tim Bovee, Portland, Oregon, February 26, 2020

Read More »

Live: Tuesday, February 25, 2020

3:25 p.m. New York time

And as the closing bell approaches, my short iron condor position on SMH drops into unprofitability. Here’s a quick-and-dirty table showing my short iron condors and how far below the short put strike prices they are. As a percentage, nothing too terrifying.

SYM
LATE IN SESSION
SHORT PUT
DIFF%
DIFF$
ITM?
QQQ 216.71 215 0.8% 1.71
SMH 135.66 137 -1.0% -1.34 x
XBI 91.62 89 2.9% 2.62
XLB 56.365 58 -2.8% -1.635 x
XLE 49.375 51.21 -3.6% -1.835 x
XLI 78.2819 80 -2.1% -1.7181 x
XLK 92.89 95 -2.2% -2.11 x
XLP 62.165 62 0.3% 0.165
XLV 97.425 99 -1.6% -1.575 x

2:20 p.m. New York time

The stock position GH in my Genetics Portfolio has triggered its trailing 20% stop/loss, exiting for a $71.64 credit per share, down $4.50 from the entry debit. The position produced a 5.9% loss over 22 days for a -98% annual rate.

12:10 p.m. New York time

Of my nine short iron condor options positions, five have moved below the strike price of the short puts that make up the iron condor strategy. They cover a wide variety of sectors: XLB for for materials, XLE for energy, XLI industry, XLK technology and XLV for health care.

The positions with all legs remaining out of the money — the good spot — are QQQ for the NADSAQ, SMH for semi-conductors, XBI for biotech and XLP for consumer staples.

10:45 a.m. New York time

Yesterday’s dive in the markets — the headlines said it plunged, but honestly, having watched the value of my mutual funds evaporate during the Crash of ’87, when the market lost 25% in one day, this little 3%+ stubbed toe doesn’t seem too terribly impressive by comparison.

I lost two positions to my standard trailing 20% stop/loss, which is a fairly robust performance in a portfolio that had 28 positions.

My short iron condor positions made it through Monday with all options out of the money — the good place. However, this morning my XLE position saw the price move beyond it’s short put strike price of $51.21, to $50.79 at the time I’m writing. Friday is 21 days before expiration, when I manage options positions, and for the moment I’ll keep close watch on XLE but take no action.

I follow three big-picture metrics that give me guidance on when to pull out of the markets.

  • One is the 200-day moving average on SPY, the exchange-traded fund that tracks the S&P 500. The closing price on Monday stood at 3.1% above the simple moving average, compared to 9.85 above at Friday’s close. The action point is a persistent close below the moving average.
  • Another metric, more economics oriented, is the Sahm Rule, a Federal Reserve metric that can be used to gain early warning of when the economy has moved into a recession. The Fed’s alarm signal is when the Sahm moves above 50. My alarm signal is when the metric moves about 20. It presently stands at zero for the second month in a row and will next be updated on Friday next week, March 6.
  • A third metric — more of an experiment, really — is the average Zacks rank of the stocks in the Dow Jones Industrial Average — the DJ30. A rank of one is the best and five is the worst. It has been steady at a rank of 2.8. Anything lower than 3 is a “buy” signal. I have no specific action point on this metric, but if it moves above 3 then I’ll start to worry, and the higher it goes, the more likely I’ll be to act, most likely making the decision in conjunction with the trend of the most sensitive of the three metrics, the moving average.

And so, today, with the market looking a bit dazed.

My focus portfolios are Growth and Genetics. I plan no new entries in either. In honor of yesterday’s declines, I’ve added a new requirement, that the Fisher Transform (FT) metric be in uptrend mode. I’ve used the FT for quite some time in an options context. An explanation of the FT may found here.

None of the Genetics Portfolio prospects met that requirement. One of the Growth Portfolio prospects — UTHR — has an uptrending signal, with earnings to be released on Wednesday before the opening bell. The Zacks Earnings Surprise Predictor is negative, and so I’m staying away from it.

Bottom line: I plan no stock entries today.

I took profits on CYH, exiting after it made a huge rise after earnings were announced. The Street estimate was a 47-cent loss. The actual net income was a 40-cent gain. I figured the only reasonable next move was a decline.

I exited CYH for a $6.11 credit, up $1.60 from the entry debit. The position produced a 35.5% gain over 29 days for a +447% annual rate.

Also, I made one transfer to the Bench, as RL’s Zacks rank dropped from “strong buy” (1) to “buy” (2), removing it from the SP500 Portfolio. It can remain on the Bench with a rank 3 (“hold”), as long as either the growth or momentum metrics show an A or B. A drop to the “hold” rank (3) or both the growth and momentum metrics moving at worse than B would trigger a sale.

Finally, SNX, which had been benched, regained its place in the Growth Portfolio.

By Tim Bovee, Portland, Oregon, February 25, 2020

Read More »

Live: Monday, February 24, 2020

12:30 p.m. New York time

TNK in the Value Portfolio hit its trailing 20% stop/loss a few minutes ago and was sold for a $12.91 per share credit, down $1.24 from the entry price. The sale resulted in an 8.8% loss for 14 days, or a -228% annual rate. TNK was a valid member of the Value Portfolio as of the latest Zacks analysis. The price has long been on a long decline since January. A reversion to an uptrend ended after only four days, and the downtrend resumed on February 14. The stop/loss was triggered two days before the earnings announcement.

10:25 a.m. New York time

The trailing 20% stop/loss on my stock position on EDIT in the Genetics Portfolio was triggered this morning amid a general decline in the markets.

I exited EDIT for a 23.30 credit per share, down $5.69 from the entry price, resulting in a 19.6% loss over 27 days for a -265% annual rate. The stop was triggered two days before EDIT’s next earning announcement. It still remains as a potential trade in the Genetics Portfolio, with a Zacks rank of 2 (“buy”).

Otherwise, my stock activities today have all been Bench transfers. INVA was benched after its Zacks rank dropped to 2, costing it it’s spot in the Momentum Portfolio, and two benched symbols again qualified for their portfolios and were sent back into play: KBH in Value and PHM in Growth.

I plan no entries today until the markets stabilize a bit.

In my short iron condor options positions, no trades are in sight today. I’ll manage the positions 21 days out from expiration, which is next Friday.

By Tim Bovee, Portland, Oregon, February 24, 2020

Read More »

Live: Friday, February 21, 2020

9:45 a.m. New York time

In stocks, I’ve added INVA to the Momentum Portfolio, which — along with Robotics — is today’s focus — for a $15.25 debit per share.

KBH dropped from the Value Portfolio, a day after I entered the position, and was moved to the Bench, along with PHM, which was dropped from the Growth Portfolio, although it remains viable in the SP500 Portfolio.

By Tim Bovee, Portland, Oregon, February 21, 2020

Read More »

Live: Thursday, February 20, 2020

9:45 a.m. New York time

Yesterday’s short iron condor exits cleared my accounts of the FEB series of options positions. My options contracts now expire on March 20. Their next milestone comes on February 28, which is 21 days before expiration. On that day I shall exit all profitable positions.

The unprofitable positions is the problem, as always. Do I get rid of them immediately? Do I hang on to them until expiration week, in the hope that they will improve? I’ve tried both strategies for good and bad results. Each position, after all, is sui generis, and my best strategy is, I would think, to treat each losing position separately, without an overarching rule.

I’ll begin to buy the next series of options, APR, on March 3.

Having freed up cash with the sale of FEBs, I entered several new share positions in today’s focus portfolios, Growth and Genetics. The Growth symbol also appears on the Momentum Portfolio. I exited a former Value Portfolio position now on the Bench and used those funds to add a position to Value.

The trades:

  • Growth
    • Entry: AEL, for a debit of $33.10 per share.
  • Genetics
    • Entry: REGN, , a $398.84 debit.
  • Value
    • Entry: KBH, a $39.93 debit.
  • Bench
    • Exit: RUSHA (formerly Value) for a credit of $43.17 per share, down $0.49 from the entry price.  The loss was 1.1% over 27 days for a -15% annual rate.
    • Transfer: GIII back to Value

By Tim Bovee, Portland, Oregon, February 20, 2020

Read More »

Live: Wednesday, February 19, 2020

3:20 p.m. New York time

I’ve exited my short iron condor position on XLK and updated the analysis with results. This was a full exit, in contrast to my partial TLT and XLE exits.

2:15 p.m. New York time

I’ve updated my analyses of short iron condors on TLT and XLE with results after my partial exit.

12:40 p.m. New York time

I partially exited two losing short iron condor positions today as the FEB series of monthly options nears expiration after Friday’s close. I exited the calls TLT position and the puts in XLE, leaving an out-of-the-money short spread in each case that I anticipate will expire without value. I shall update the analyses later today.

One other losing position from the series, XLK, remains, and I hope to exit it on Thursday.

In shares, I cleaned out three positions from the Bench in order to raise funds for new trades, and also exited a position that had dropped from the Robotics Portfolio and didn’t qualify for the Bench.

The three exits from the Bench, two profitable and one for a loss:

  • AMED, for a $193.89 credit, a $12.56 profit per share. The position produced a 6.9% return over 19 days, or a +133% annual rate.
  • IMKTA, a $36.52 credit, a loss of $6.31 per share, producing a 14.7% loss over 15 days for a -358% annual rate.
  • OESX, a $6.32 credit, a profit of 62 cents per share, producing a 10.9% return over seven days for a +569% annual rate.

And from the Robotics Portfolio, I exited SPLK for a $175.42 credit, up $18.56 from the entry price, producing an 11.8% return over 20 days for a +216% annual rate.

Three positions were moved to the Bench: DAL from the SP500 Portfolio, and GIII and RUSHA, both from Value.

I entered no new stock positions.

By Tim Bovee, Portland, Oregon, February 19, 2020

Read More »

Live: Tuesday, February 18, 2020

9:50 a.m. New York time

This is expiration week for my remaining short iron condor positions in the FEB options series. TLT, XLE and XLK all remain well in the money on one leg. I’ll give them another day, for time decay to work (decay being in my favor for short positions), and exit the losing legs on Wednesday, allowing the remaining spreads to expire valueless (also in my favor).

In stocks, the focus portfolios today are Momentum and Robotics. Given AAPL’s sharp decline in response to the impact of the COVID19 virus on its manufacturing operations in China, I jumped in and expanded my holdings in the company, which appears on the Robotics Portfolio. It gives me slightly outsized exposure in AAPL, but I’m comfortable with that. AAPL’s entry debit was $318.00 per share.

Two positions dropped off of their portfolios — IBP in Growth and CYH in Momentum — and I’ve transferred them to the Bench.

By Tim Bovee, Portland, Oregon, February 18, 2020

Read More »