3:30 p.m. New York time
Half an hour before the closing bell. The S&P 500 futures peaked early in the session at 6748 and reversed, retracing back to 6615. At present it risen back in the 6660s
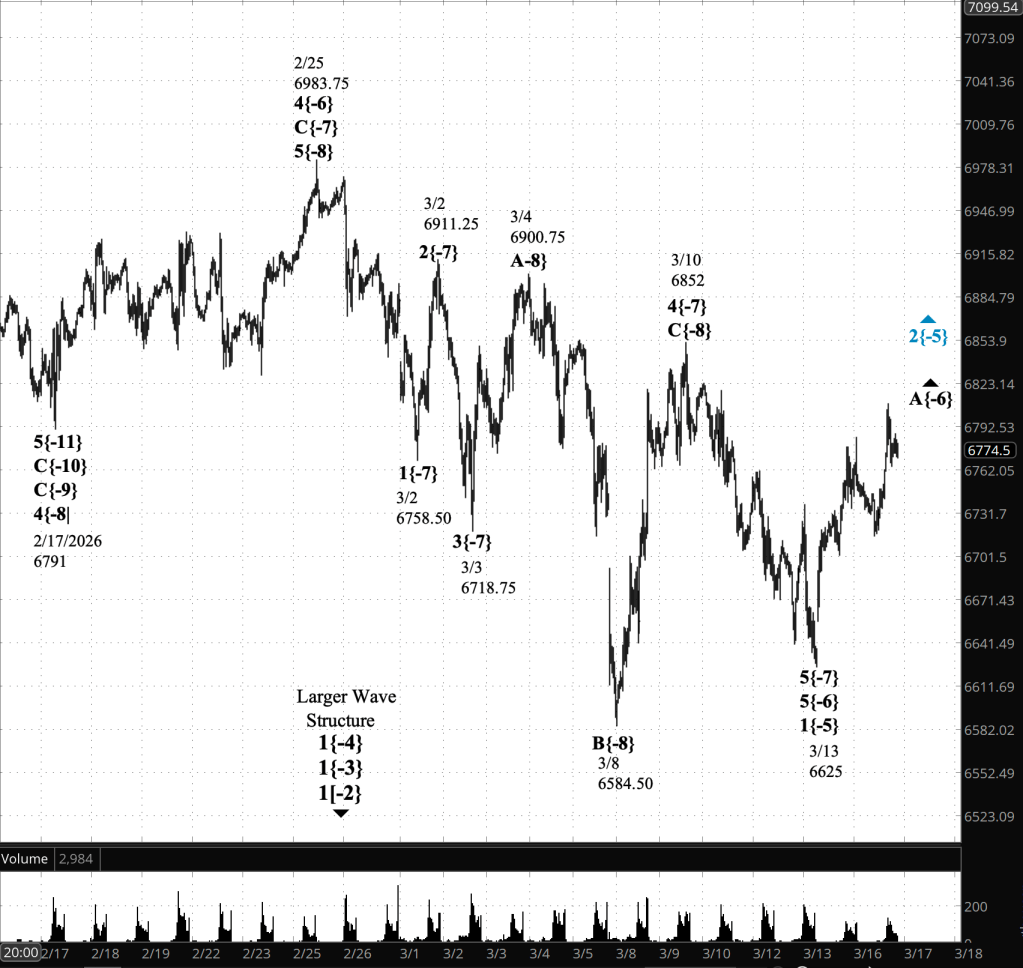
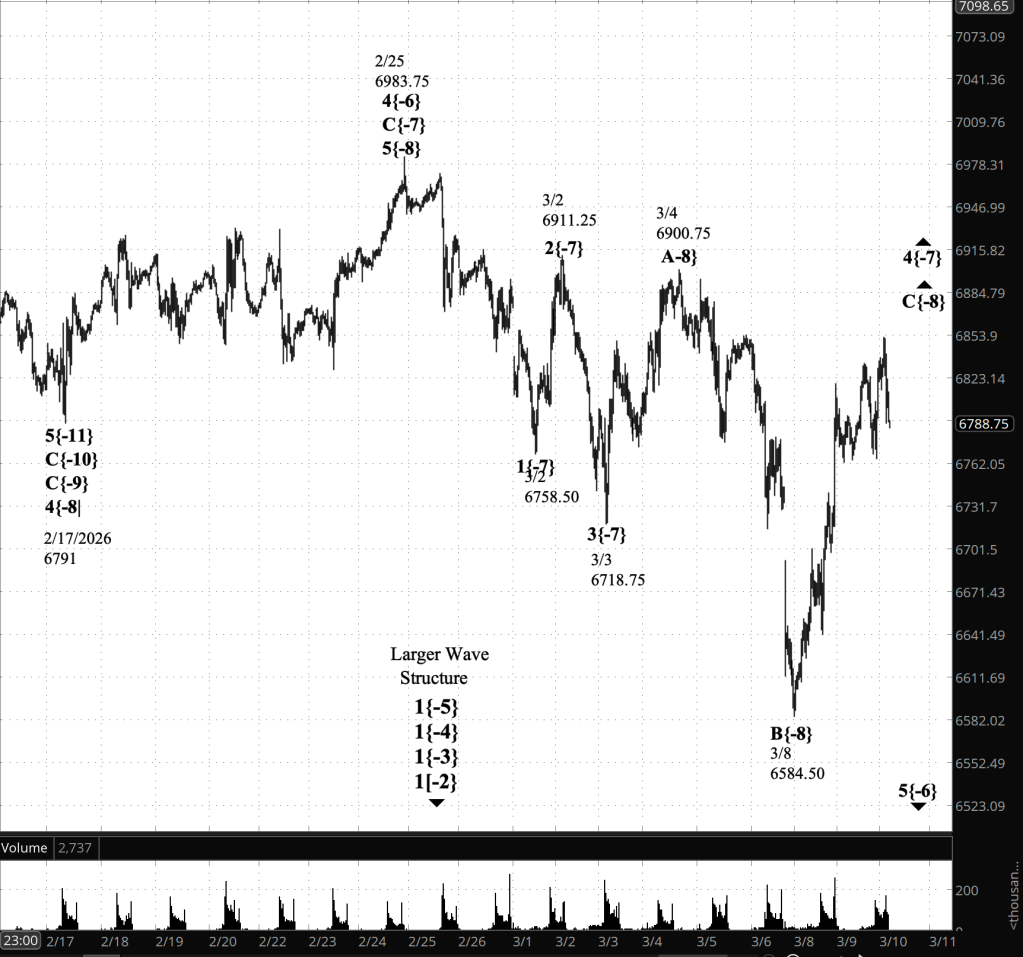
Elliott Wave Theory: The early rally appears to have completed subwave A{-7} of rising wave B{-6}. The subsequent pullback is likely subwave B{-7} within that same corrective rise. If this interpretation is correct, another upward push in subwave C{-7} would be expected before wave B{-6} itself reaches completion.Elliott Wave Theory: The movement would appear the declining B{-7} subwave within rising wave B{-6}.
9:35 a.m. New York time
What’s happening now? The S&P 500 E-mini futures reversed overnight, rising from 6483.50 into the 6740s.
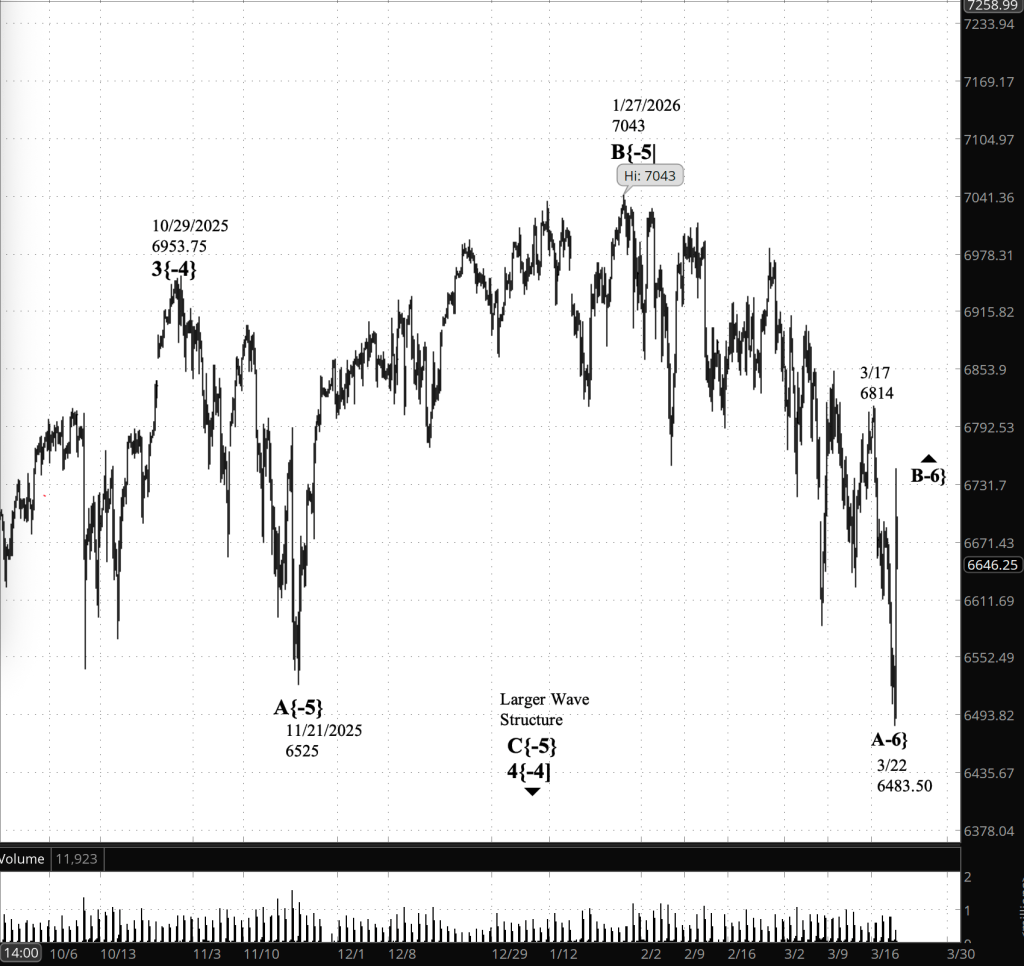
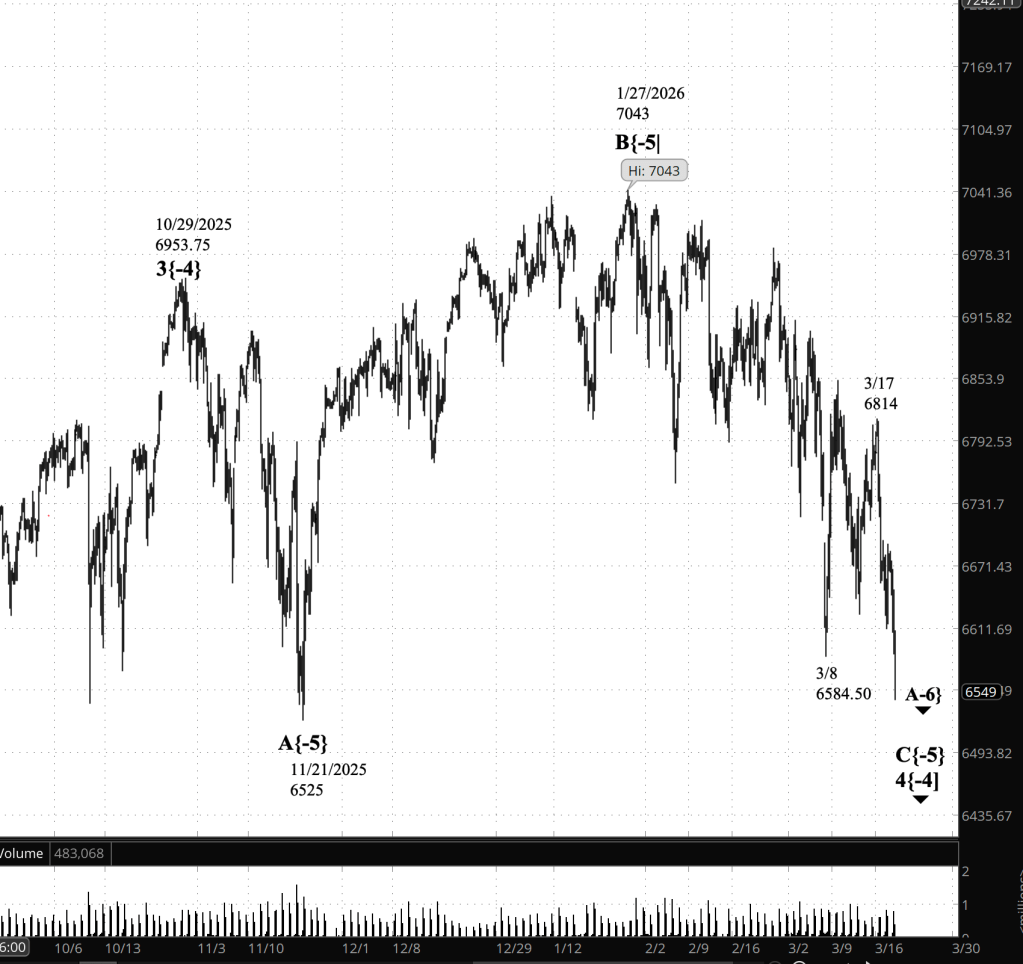
What does it mean? The Elliott Wave Theory layout is as follows: Falling wave A{-6}, which began on January 27, 2026, from 7043, ended overnight, and rising wave B{-6} began. Both are subwaves of declining wave C{-5}, which in turn is a subwave of wave 4{-4}, a downward correction.
Wave 4{-4} has taken the form of an expanding triangle, which, when complete, will have five subwaves.
In Elliott Wave terms, the expanding triangle now under discussion is the structure at degree {-5}, meaning its five legs are labeled A{-5}, B{-5}, C{-5}, D{-5} and E{-5}. Each of those legs is itself a corrective wave, and corrective waves usually break down into smaller internal subwaves at the next lower degree, here {-6}. That is why the current decline can be labeled A{-6} and the rebound B{-6} within the larger wave C{-5}: the {-5} degree defines the triangle itself, while the {-6} degree describes the internal structure of each triangle leg. In practical terms, the market is not yet in the final leg of the triangle. It is still moving through the internal subdivisions of wave C{-5}.
A caveat: Wave B{-6} appears to be underway, but a rapid reversal and a decline to a new low would mean that wave A{-6} has not yet ended and that wave B{-6} still lies ahead.
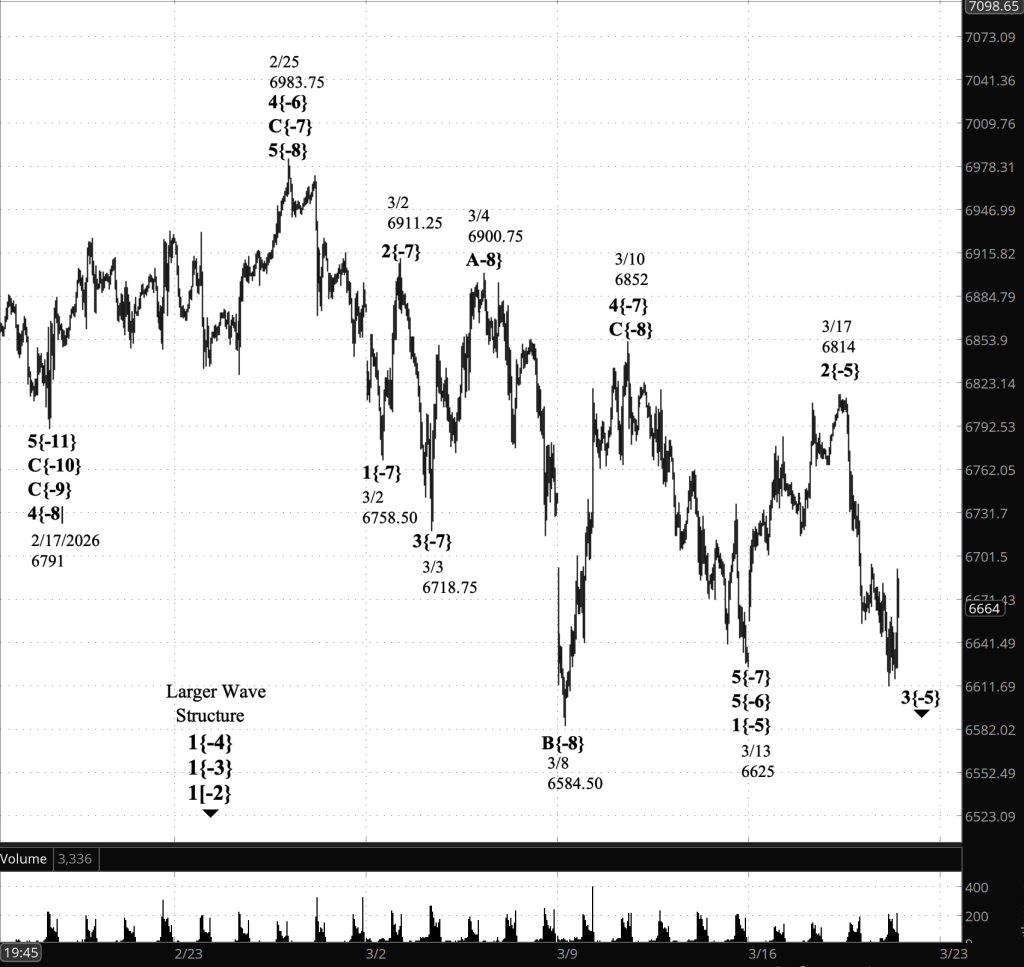
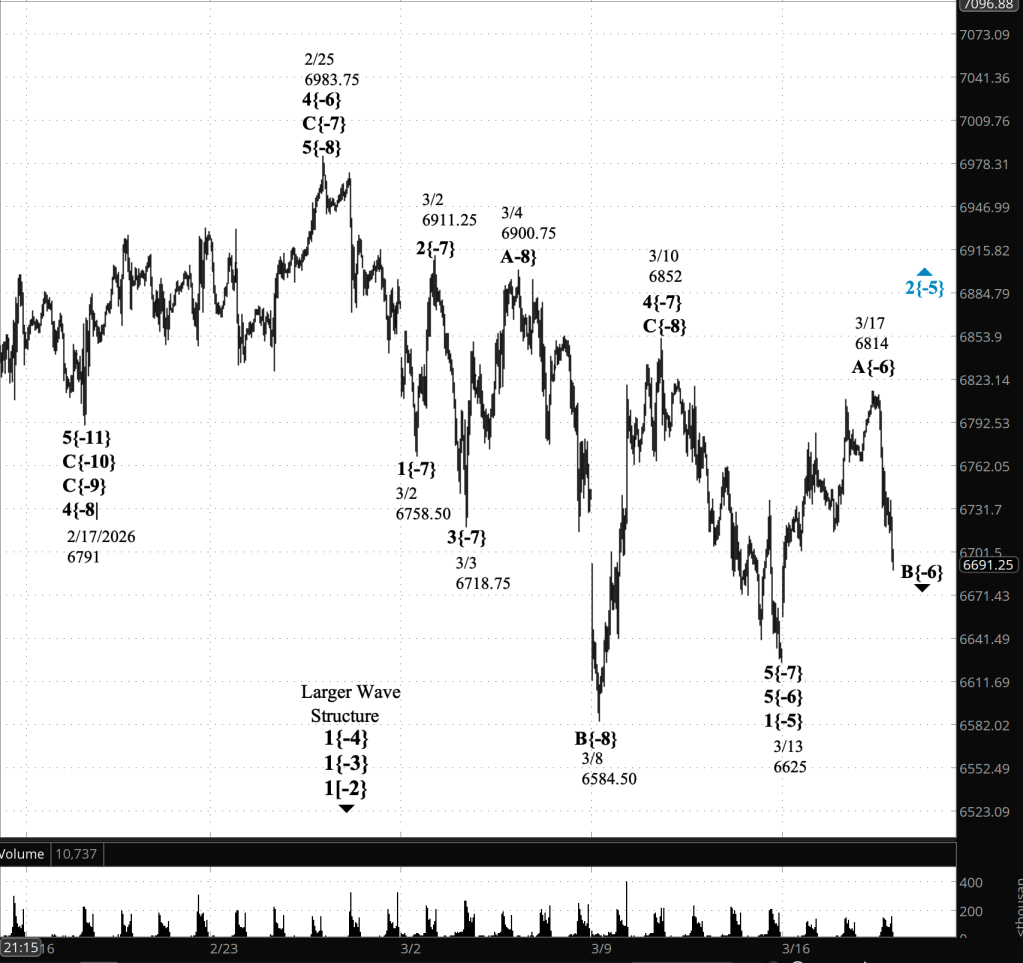
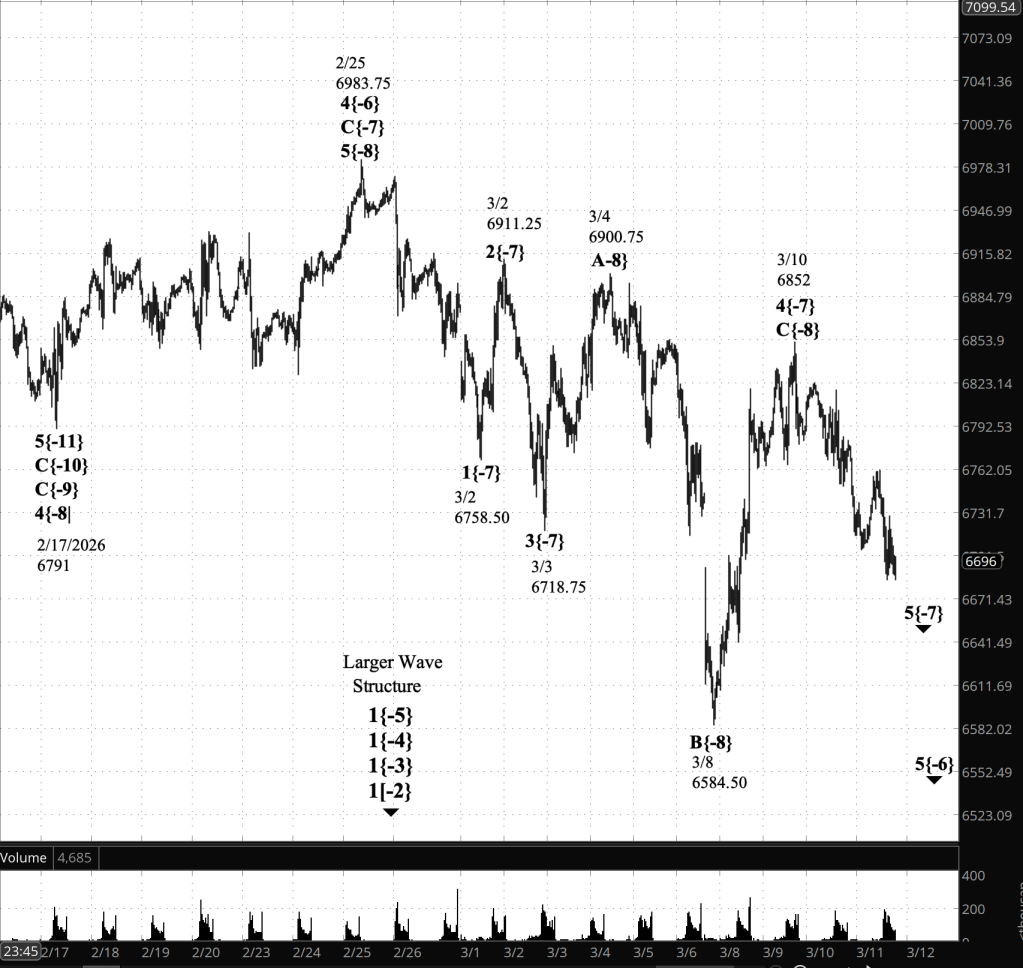
[S&P 500 E-mini futures at 9:35 a.m., 4-hour bars with volume]
Waves Now Underway
These are the waves currently in progress under my principal analysis. Each line on the list shows the wave number, with the subscript in curly brackets, the traditional degree name, the starting date, the starting price of the S&P 500 E-mini futures, and the direction of the wave.
- S&P 500 Index:
- 5{+3} Supercycle, 7/8/1932, 4.40 (up)
- 5{+2} Cycle, 12/9/1974, 60.96 (up)
- 5{+1} Primary, 3/6/2009, 666.79 (up)
- 5{0} Intermediate, 2/11/2016, 1810.10 (up)
- 3{-1} Minor, 3/23/2020, 2191.36 (up)
- 1{-2} Minute, 7/31/2025, 6468.50 (down)
- S&P 500 E-mini futures
- 5{-3} Minuette 8/1/2025, 6239.50 (up}
- 4{-4} Subminutte 10/29/2025, 6953.75 (down}
- C{-5} Micro, 1/27/2026, 7043 (down}
- B{-6} (none), 3/22/2026, 6481.50 (down}
Reading the chart. Price movements — waves – – in Elliott Wave Theory analysis are labeled with numbers within trending waves and letters with corrective waves. The subscripts — numbers in curly brackets — designate the wave’s degree, which, in Elliott Wave analysis, means the relative position of a wave within the larger and smaller structures that make up the chart. R.N. Elliott, who in the 1930s developed the form of analysis that bears his name, viewed the chart as a complex structure of smaller waves nested within larger waves, which in turn are nested within still larger waves. In mathematics it’s called a fractal structure, where at every scale the pattern is similar to the others.
Learning and other resources. Elliott Wave analysis provides context, not prophecy. As the 20th century semanticist Alfred Korzybski put it in his book Science and Sanity (1933), “The map is not the territory … The only usefulness of a map depends on similarity of structure between the empirical world and the map.” And I would add, in the ever-changing markets, we can judge that similarity of structure only after the fact.
See the menu page Analytical Methods for a rundown on where to go for information on Elliott Wave analysis.
By Tim Bovee, Portland, Oregon, March 23, 2026
Disclaimer
Tim Bovee, Private Trader tracks the analysis and trades of a private trader for his own accounts. Nothing in this blog constitutes a recommendation to buy or sell stocks, options or any other financial instrument. The only purpose of this blog is to provide education and entertainment.
No trader is ever 100 percent successful in his or her trades. Trading in the stock and option markets is risky and uncertain. Each trader must make trading decisions for his or her own account, and take responsibility for the consequences.
All content on Tim Bovee, Private Trader by Timothy K. Bovee is licensed under a Creative Commons Attribution-ShareAlike 4.0 International License.
Based on work at www.timbovee.com


You must be logged in to post a comment.