3:30 p.m. New York time
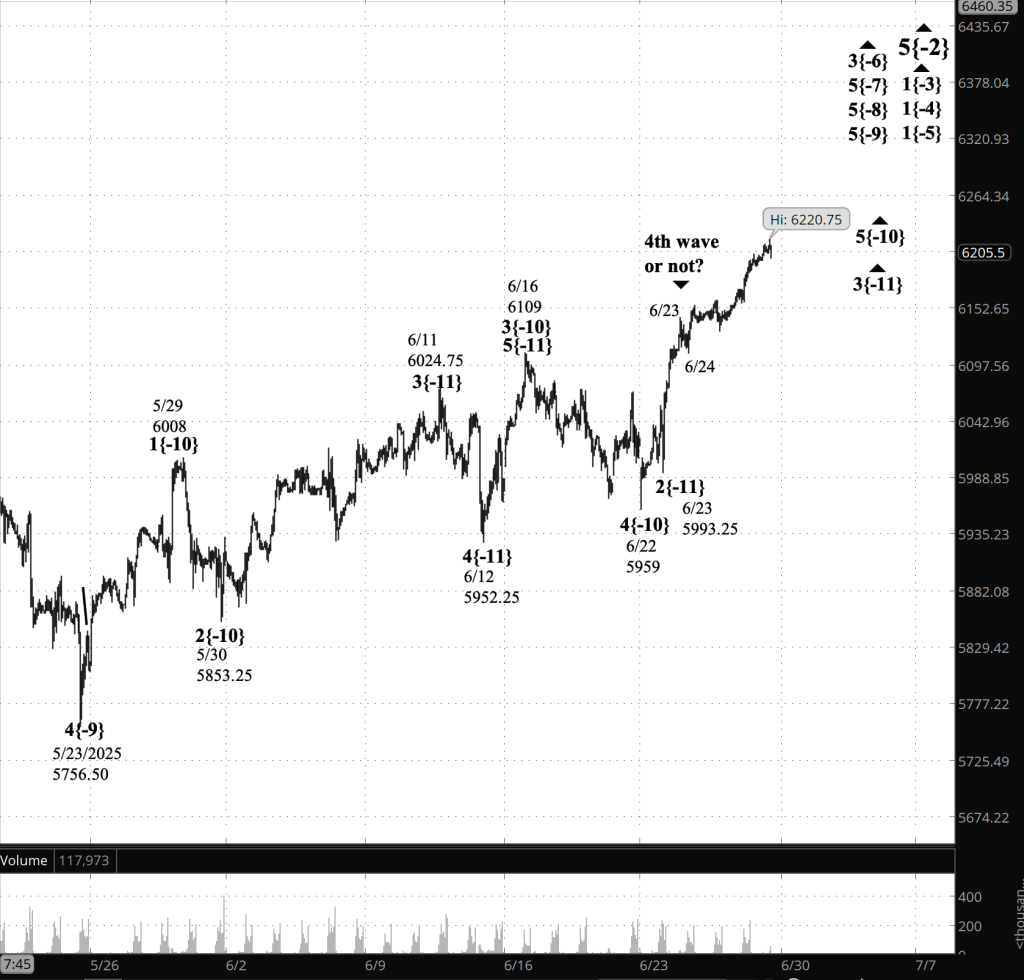
Half an hour before the closing bell. The S&P 500 futures, after hitting a low for the day of 6227.25 a few minutes before the opening bell, rose during the session, reaching a high of 6261.50 and then falling sharply.
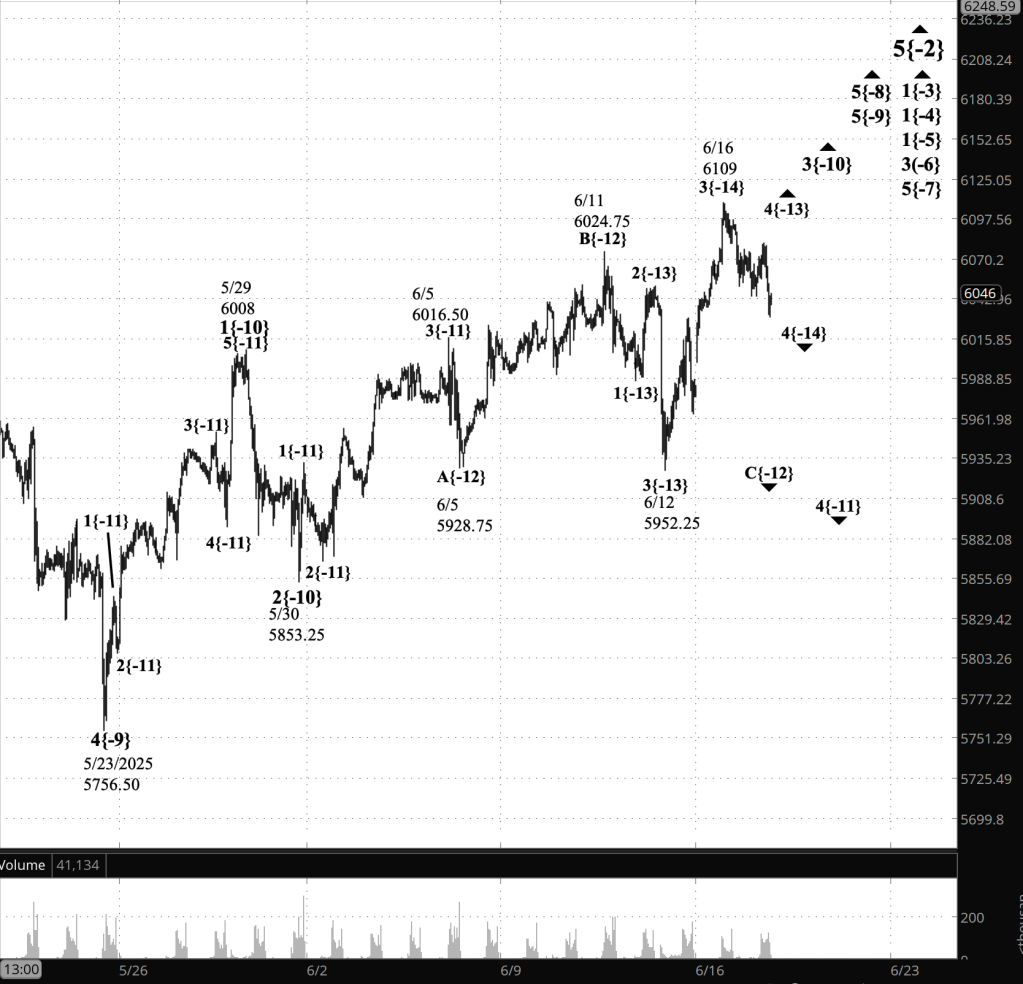
Elliott Wave Theory: The downward correction of the past day is within a 5th-wave uptrend that began on June 27.
9:35 a.m. New York time.
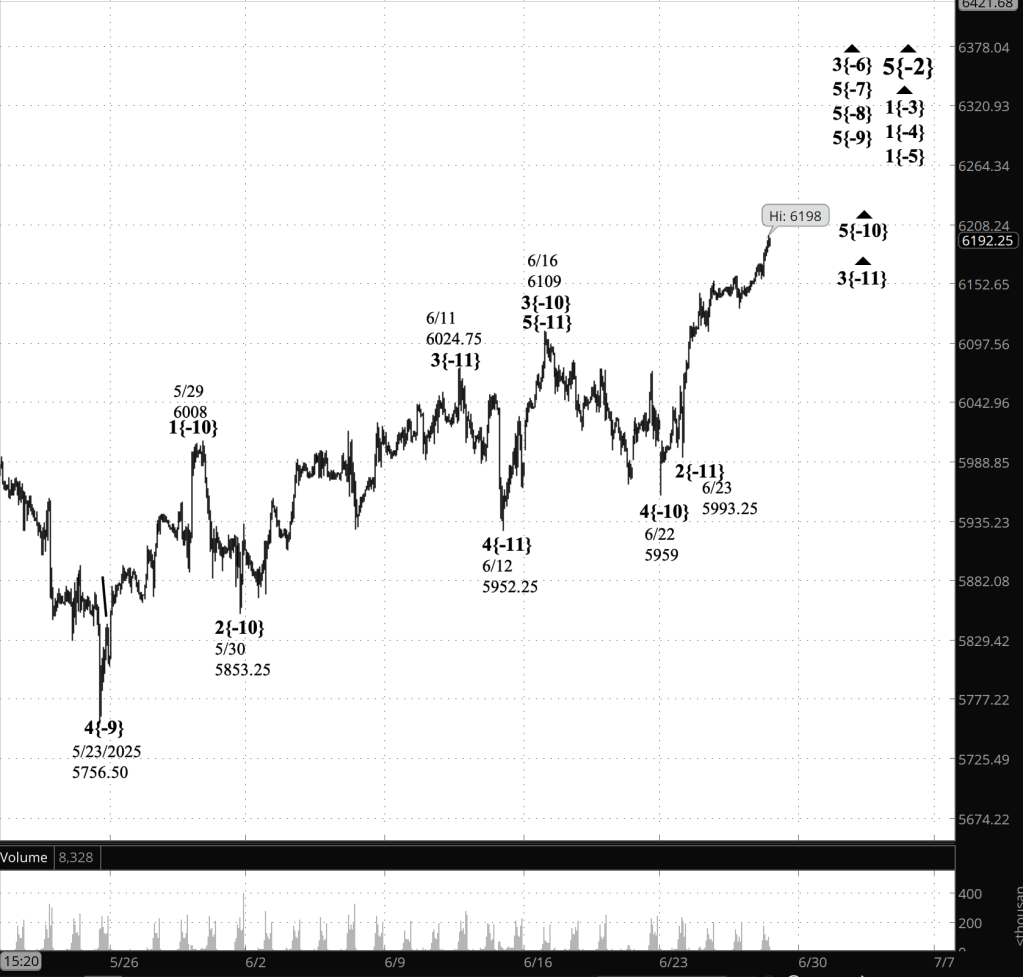
What’s happening now. The S&P 500 E-mini futures declined overnight from yesterday’s high, 6265.50, so far reaching a low of 6227.25.
What does it mean? Elliott Wave Theory analysis is ambiguous. My principal analysis says the decline as a downward corrective wave within a rising 5th-wave that began on June 27. That wave is labelled 5{-11} on the chart an is stil underway.
In the wave references below, I refer to the chart labels in this format: Wave number, and wave degree as a subscript in curly brackets, with the degree being given relative to Intermediate degree.
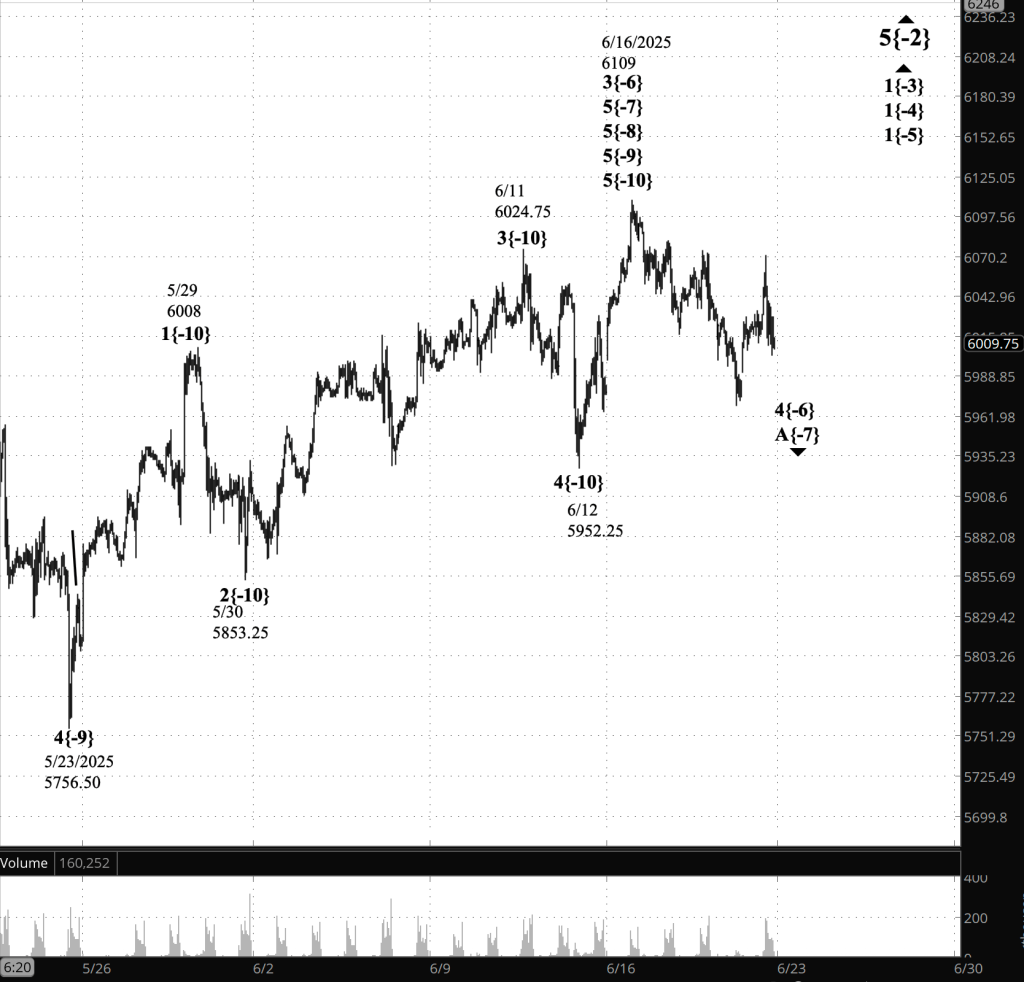
My alternative analysis says the yesterday’s peak was the end of wave 5{-11} and its parent wave, 5{-10, and a series of three larger 5th waves — 5{-9}, 5{-8} and 5{-7}. One degree higher, it is also the end of wave 3{-6} and the beginning of wave A{-7} within wave 4{-6}.
Which is most likely to be correct? I can’t say for sure. Perhaps today’s session will clarify the analysis.

[S&P 500 E-mini futures at 3:30 p.m., 65-minute bars, with volume]
Waves Now Underway
These are the waves currently in progress under my principal analysis. Each line on the list shows the wave number, with the subscript in curly brackets, the traditional degree name, the starting date, the starting price of the S&P 500 E-mini futures, and the direction of the wave.
- S&P 500 Index:
- 5{+3} Supercycle, 7/8/1932, 4.40 (up)
- 5{+2} Cycle, 12/9/1974, 60.96 (up)
- 5{+1} Primary, 3/6/2009, 666.79 (up)
- 5{0} Intermediate, 2/11/2016, 1810.10 (up)
- 3{-1} Minor, 3/23/2020, 2191.36 (up)
- 5{-2} Minute, 4/7/2025, 4832 (up)
- S&P 500 Futures
- 1{-3} Minuette, 4/7/2025, 4832 (up)
- 1{-4} Subminuette, 4/7/2025, 4832 (up)
- 1{-5} Micro, 4/7/2025, 4832 (up)
- 3{-6} Submicro, 4/24/2025, 5260 (up)
- 5{-7} Minuscule, 4/25/2025, 5550 (up)
- 5{-8} (unnamed), 5/7/2025, 5596 (up)
- 5{-9} (unnamed), 5/23/2025, 5756.50 (up)
- 5{-10} (unnamed), 6/22/2025, 5959 (up)
- 5{-11} (unnamed), 6/27/2025, 6183.25 {up}
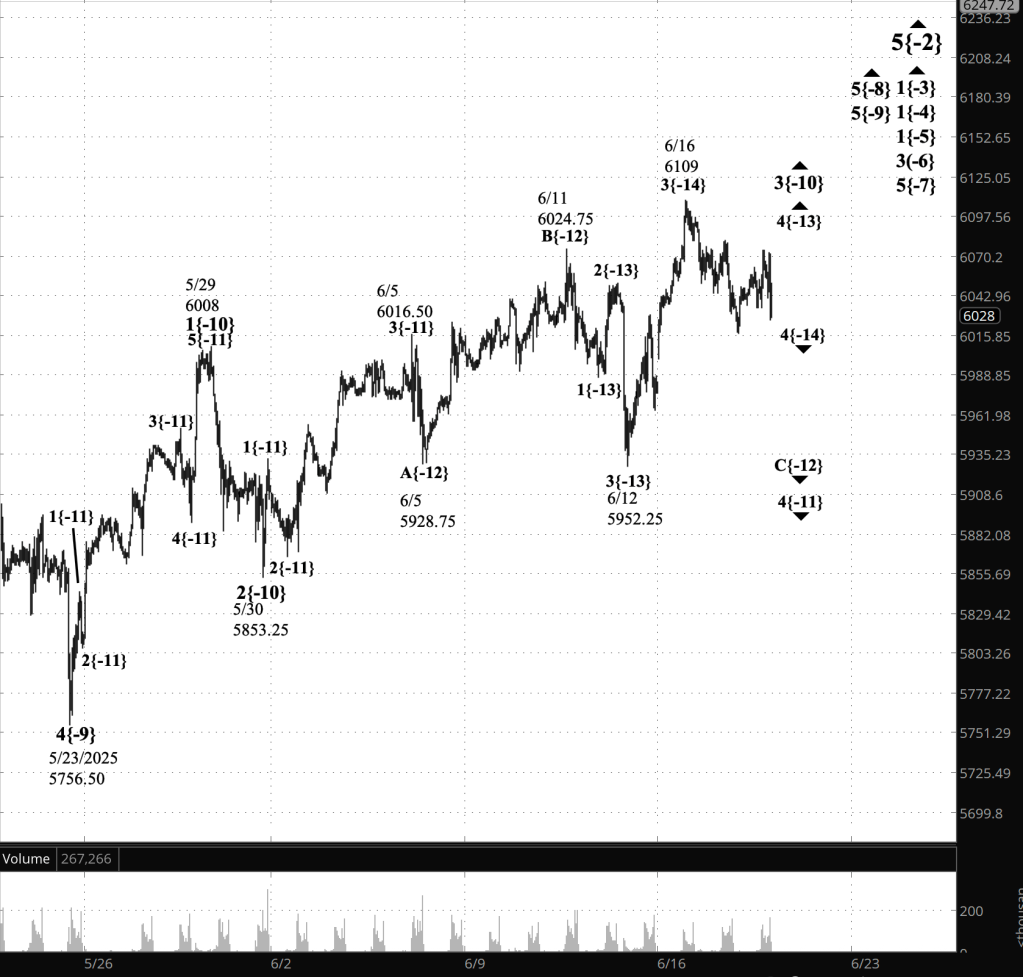
Reading the chart. Price movements — waves – – in Elliott Wave Theory analysis are labeled with numbers within trending waves and letters with corrective waves. The subscripts — numbers in curly brackets — designate the wave’s degree, which, in Elliott Wave analysis, means the relative position of a wave within the larger and smaller structures that make up the chart. R.N. Elliott, who in the 1930s developed the form of analysis that bears his name, viewed the chart as a complex structure of smaller waves nested within larger waves, which in turn are nested within still larger waves. In mathematics it’s called a fractal structure, where at every scale the pattern is similar to the others.
Learning and other resources. Elliott Wave analysis provides context, not prophecy. As the 20th century semanticist Alfred Korzybski put it in his book Science and Sanity (1933), “The map is not the territory … The only usefulness of a map depends on similarity of structure between the empirical world and the map.” And I would add, in the ever-changing markets, we can judge that similarity of structure only after the fact.
See the menu page Analytical Methods for a rundown on where to go for information on Elliott Wave analysis.
By Tim Bovee, Portland, Oregon, July 1, 2025
Disclaimer
Tim Bovee, Private Trader tracks the analysis and trades of a private trader for his own accounts. Nothing in this blog constitutes a recommendation to buy or sell stocks, options or any other financial instrument. The only purpose of this blog is to provide education and entertainment.
No trader is ever 100 percent successful in his or her trades. Trading in the stock and option markets is risky and uncertain. Each trader must make trading decisions for his or her own account, and take responsibility for the consequences.
All content on Tim Bovee, Private Trader by Timothy K. Bovee is licensed under a Creative Commons Attribution-ShareAlike 4.0 International License.
Based on a work at www.timbovee.com.


You must be logged in to post a comment.