3:30 p.m. New York time.
Half an hour before the closing bell. The S&P 500 futures rose during the session as Elliott Wave A peaked at 5286.50, just below the 50% Fibonacci retracement level. The price rapidly began to fall and so far, as wave B, has retreated to the 5050s, just above the 23.6% retracement level. All of this is happening within a 4th-wave upward correction.
What comes next? Wave C, which will rise almost certainly beyond the end of wave A.
In terms of the chart labels, rising wave A{-9} peaked, declining wave B{-9) is underway and rising wave C{-9} will follow, all within wave 4{-8}, an upward correction.
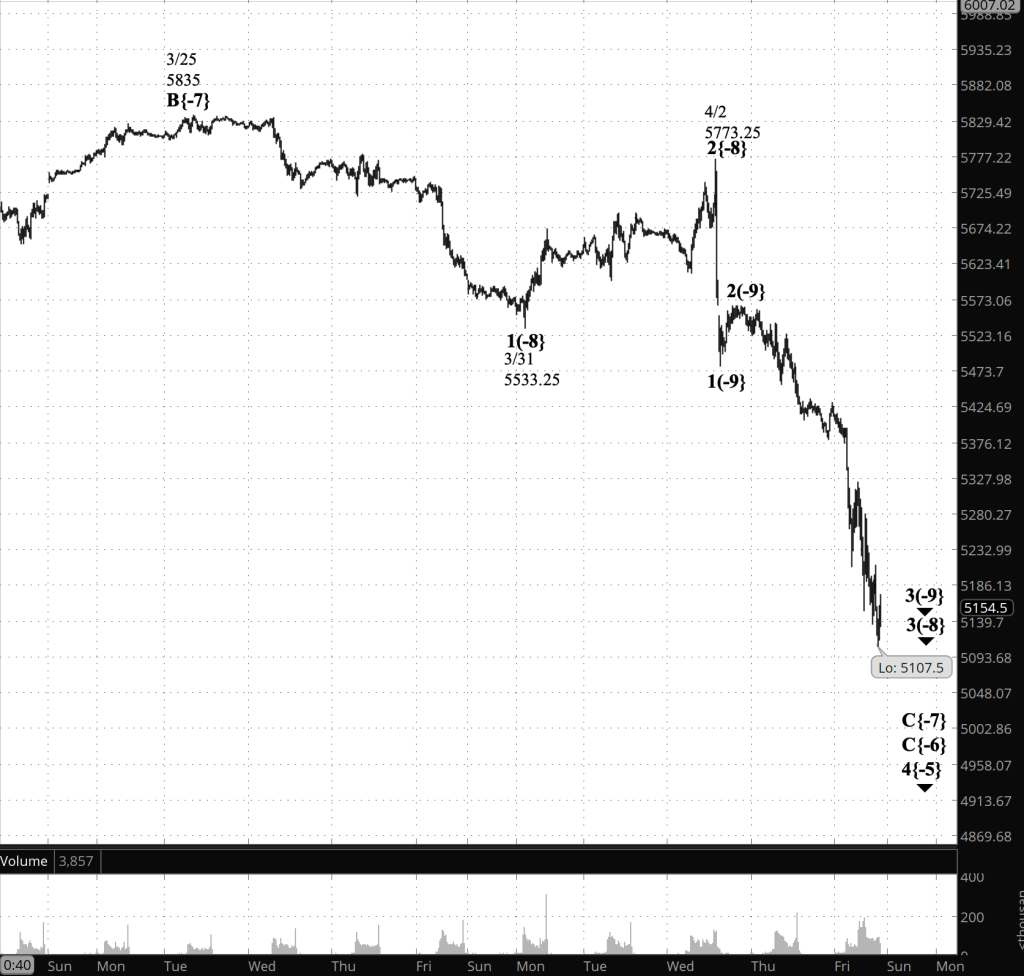
9:35 a.m. New York time
What’s happening now. The S&P 500 E-mini futures opened low at 4832 and immediately began to rise, so far reaching a high in the 5040s. That peak marked the end of wave A within the 4th-wave upward correction that began on
What does it mean? Elliott Wave Theory sees the low as the of the downtrending 3rd wave that began on April 2. The rise after trading resumed, with three subwaves, is a classic corrective pattern, an uptrending 4th wave that began from the April 6 low.
How could the analysis go wrong? The corrective pattern is small but perhaps too small to be proportional within the 3rd wave that encompasses it. The three-wave corrective pattern could be subwaves of wave A, itself a subwave of the 4th-wave correction.
I expect the ambiguity to be resolved fairly quickly. If the rising three-wave pattern is pattern is followed by two more waves — one down, one still higher — then the pattern is wave A of wave 4, which is taking a Zigzag pattern. If the three waves are followed by a three wave declining pattern — down, up, down — then wave B of wave 4 is underway, and the 4th wave is taking the form of a Flat.
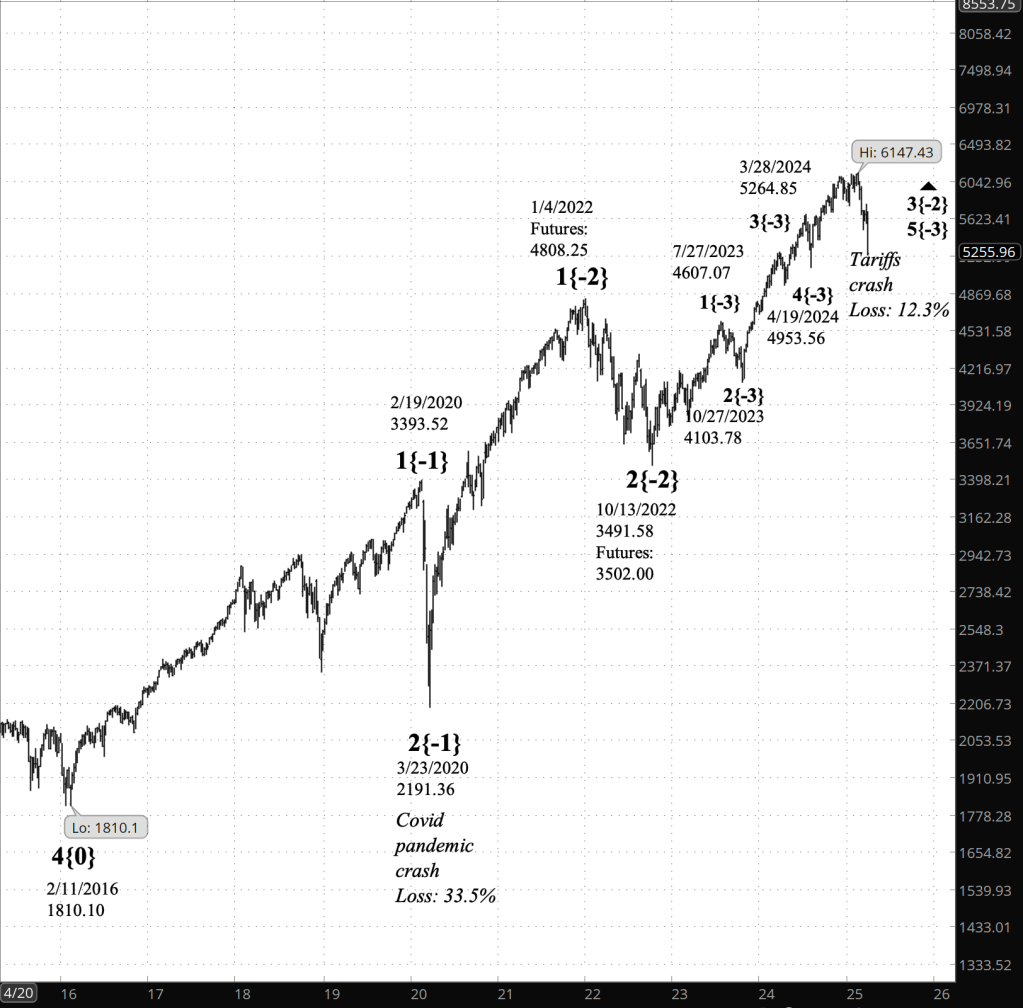
But afterward… The 4th-wave correction is but a pause in the downtrend that began on March 25 from 5835. The declining wave is wave C of a larger C wave, and above that, a 4th wave. The C waves, in their 5th subwaves, will carry the price lower, perhaps significantly so.
It is all likely to happen fairly quickly. The 3rd wave that covers period after President Trump announced a wide series of large tariffs began on April 2 and has lasted four trading days.
When complete, that larger 5th wave will mark the end of both larger wave Cs and its parent 4th wave, which began on December 16, 2024, from 6163.75
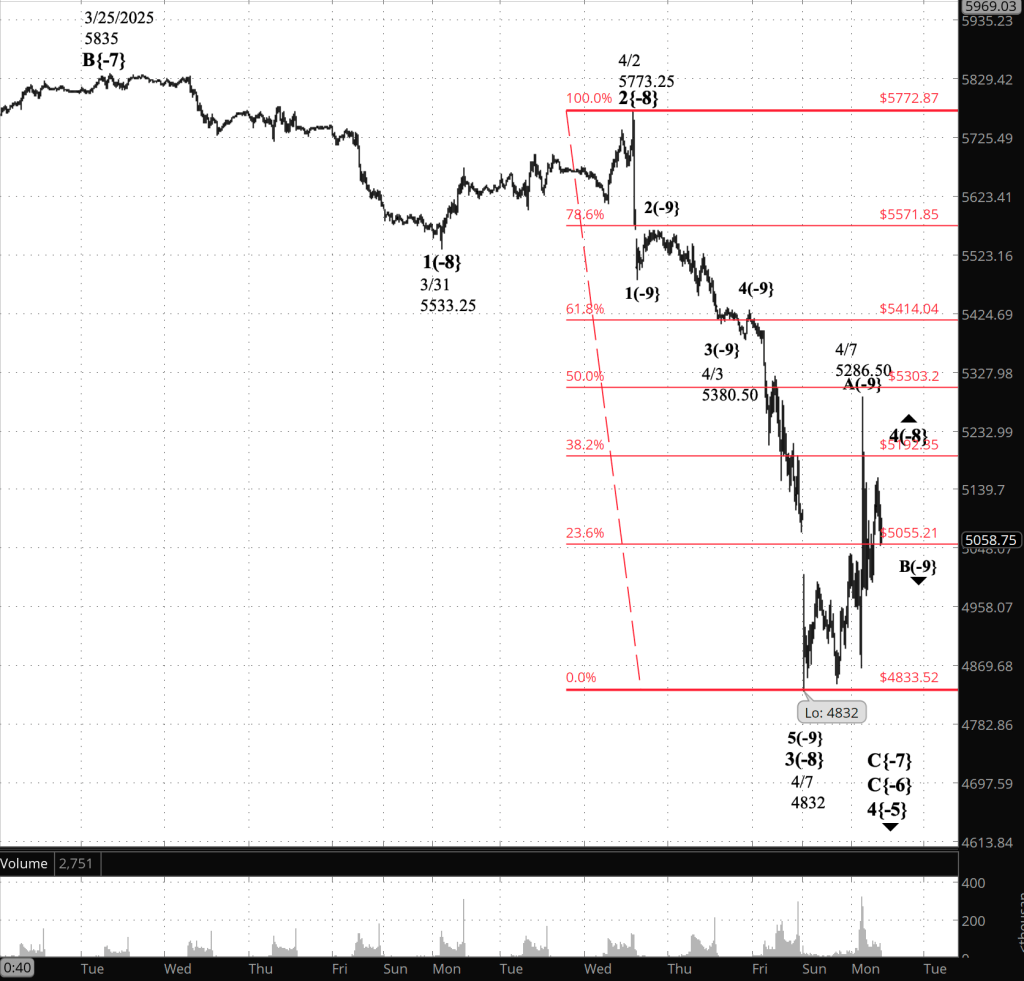
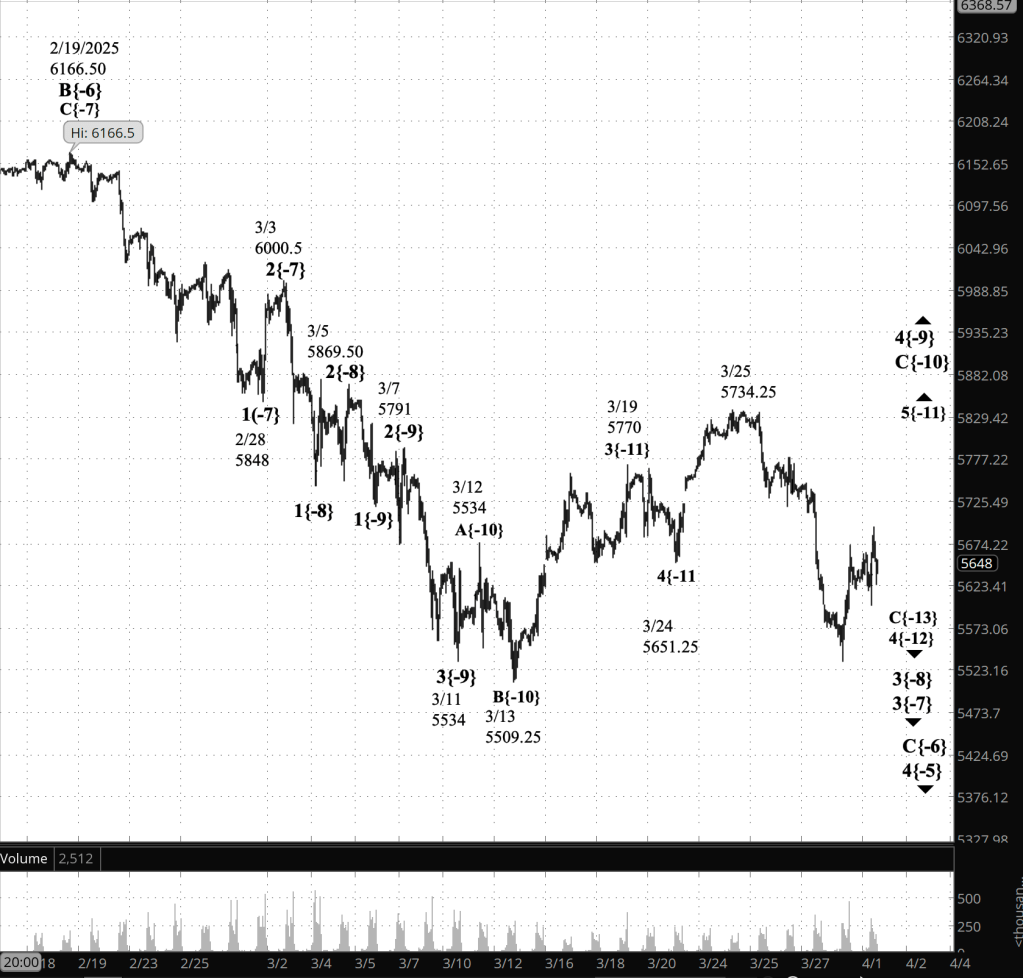
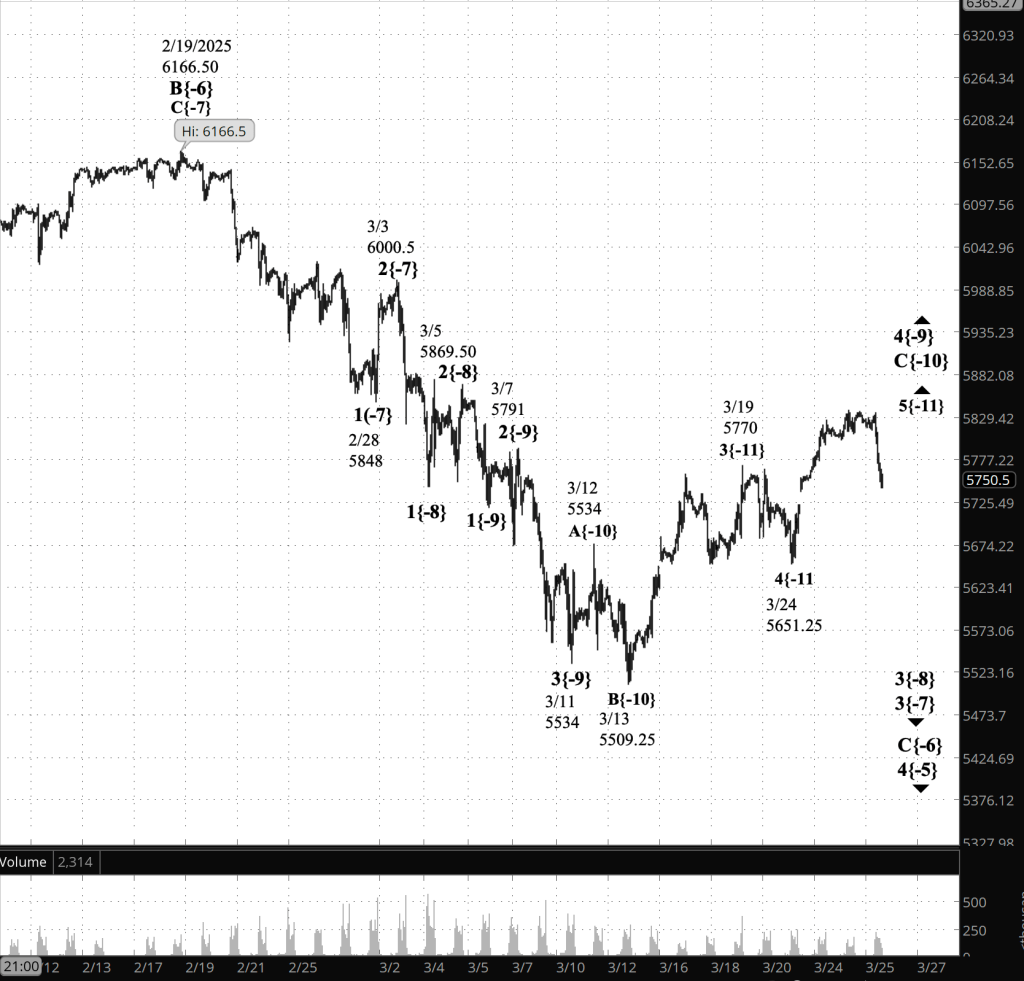
[S&P 500 E-mini futures at 3:30 p.m, 20-minute bars, with volume]
Elliott Wave Theory wave labels. Each wave listed on the charts has two components: A wave number, and a subscript in curly brackets that place the wave’s position in the fractal strucutre in relationship to Intermediate degree. The present Intermediate degree, wave 5{0}, began its rise on February 11, 2016 from 1810.10 and is still underway.
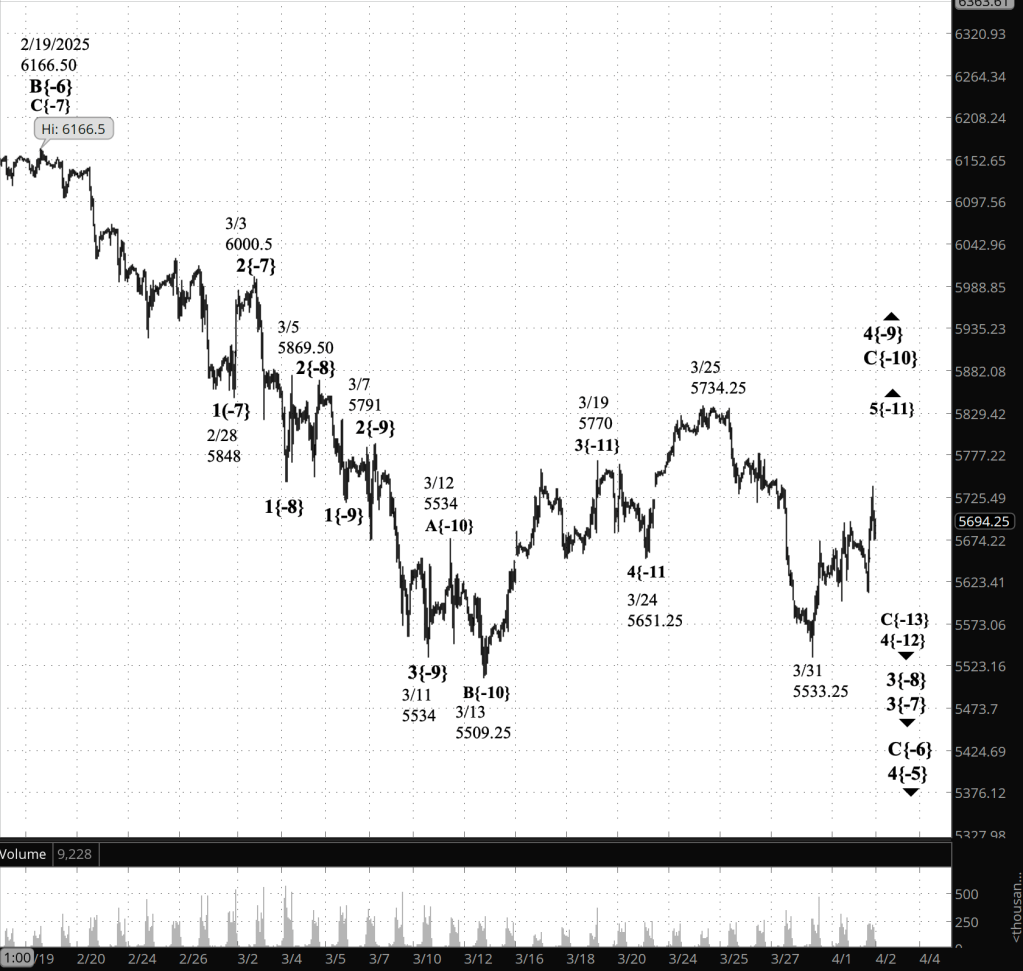
The waves referred to above are as follows. Rising wave 4{-8} is underway, a subwave of wave C{-7}, also declining, which in turn is a subwave of declining wave C{-6}, with both C waves encompassed by declining wave 4{-5}, which began on December 16, 2024.
Long-term Waves
These are the waves currently in progress under my principal analysis. Each line on the list shows the wave number, with the subscript in curly brackets, the traditional degree name, the starting date, the starting price of the S&P 500 E-mini futures, and the direction of the wave. [Updated to match the 7:08 p.m. analysis.)
- S&P 500 Index:
- 5{+3} Supercycle, 7/8/1932, 4.40 (up)
- 5{+2} Cycle, 12/9/1974, 60.96 (up)
- 5{+1} Primary, 3/6/2009, 666.79 (up)
- 5{0} Intermediate, 2/11/2016, 1810.10 (up)
- 3{-1} Minor, 3/23/2020, 2191.36 (up)
- 3{-2} Minute, 10/13/2022, 3491.58 (up)
- S&P 500 Futures
- 5{-3} Minuette, 4/18/2024, 4963.50 (up)
- 3{-4} Subminuette, 8/7/2024, 5182 (up)
- 4{-5} Micro, 12/16/2024, 6163.75 (down)
- C{-6} Submicro, 2/19/2025, 6166.50 (down)
- C{-7} Minuscule, 3/25/2025, 5835 (down)
Reading the chart. Price movements — waves – – in Elliott Wave Theory analysis are labeled with numbers within trending waves and letters with corrective waves. The subscripts — numbers in curly brackets — designate the wave’s degree, which, in Elliott Wave analysis, means the relative position of a wave within the larger and smaller structures that make up the chart. R.N. Elliott, who in the 1930s developed the form of analysis that bears his name, viewed the chart as a complex structure of smaller waves nested within larger waves, which in turn are nested within still larger waves. In mathematics it’s called a fractal structure, where at every scale the pattern is similar to the others.
Learning and other resources. Elliott Wave analysis provides context, not prophecy. As the 20th century semanticist Alfred Korzybski put it in his book Science and Sanity (1933), “The map is not the territory … The only usefulness of a map depends on similarity of structure between the empirical world and the map.” And I would add, in the ever-changing markets, we can judge that similarity of structure only after the fact.
See the menu page Analytical Methods for a rundown on where to go for information on Elliott Wave analysis.
By Tim Bovee, Portland, Oregon, April 7, 2025
Disclaimer
Tim Bovee, Private Trader tracks the analysis and trades of a private trader for his own accounts. Nothing in this blog constitutes a recommendation to buy or sell stocks, options or any other financial instrument. The only purpose of this blog is to provide education and entertainment.
No trader is ever 100 percent successful in his or her trades. Trading in the stock and option markets is risky and uncertain. Each trader must make trading decisions for his or her own account, and take responsibility for the consequences.
All content on Tim Bovee, Private Trader by Timothy K. Bovee is licensed under a Creative Commons Attribution-ShareAlike 4.0 International License.
Based on a work at www.timbovee.com


You must be logged in to post a comment.