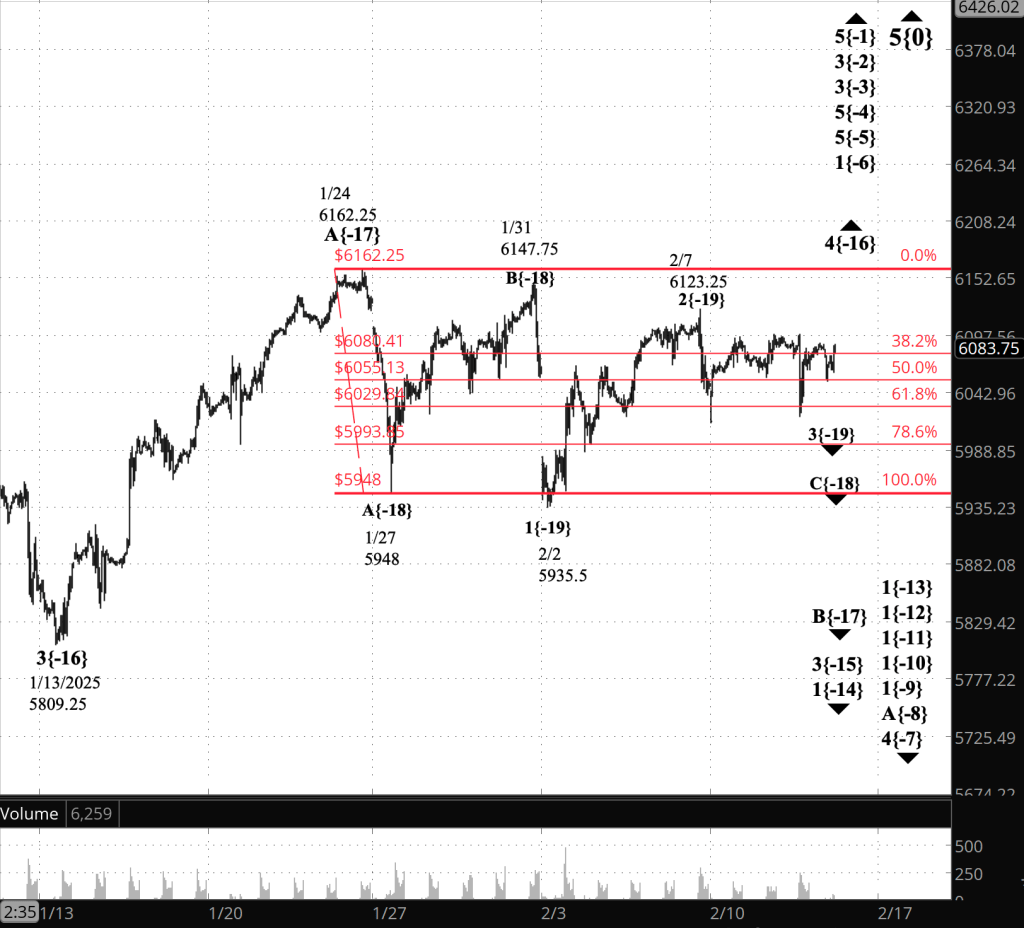
3:30 p.m. New York time
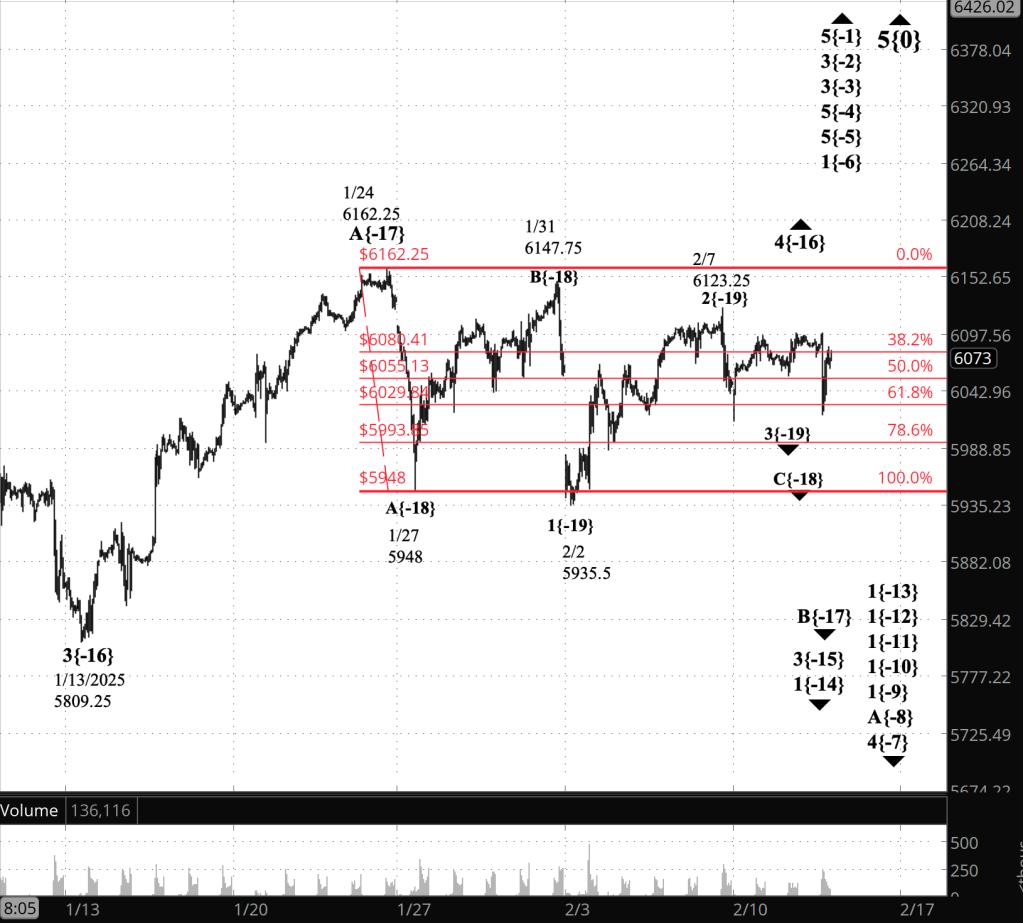
Half an hour before the closing bell. The S&P 500 futures fell during the session, reaching into the 5920s.
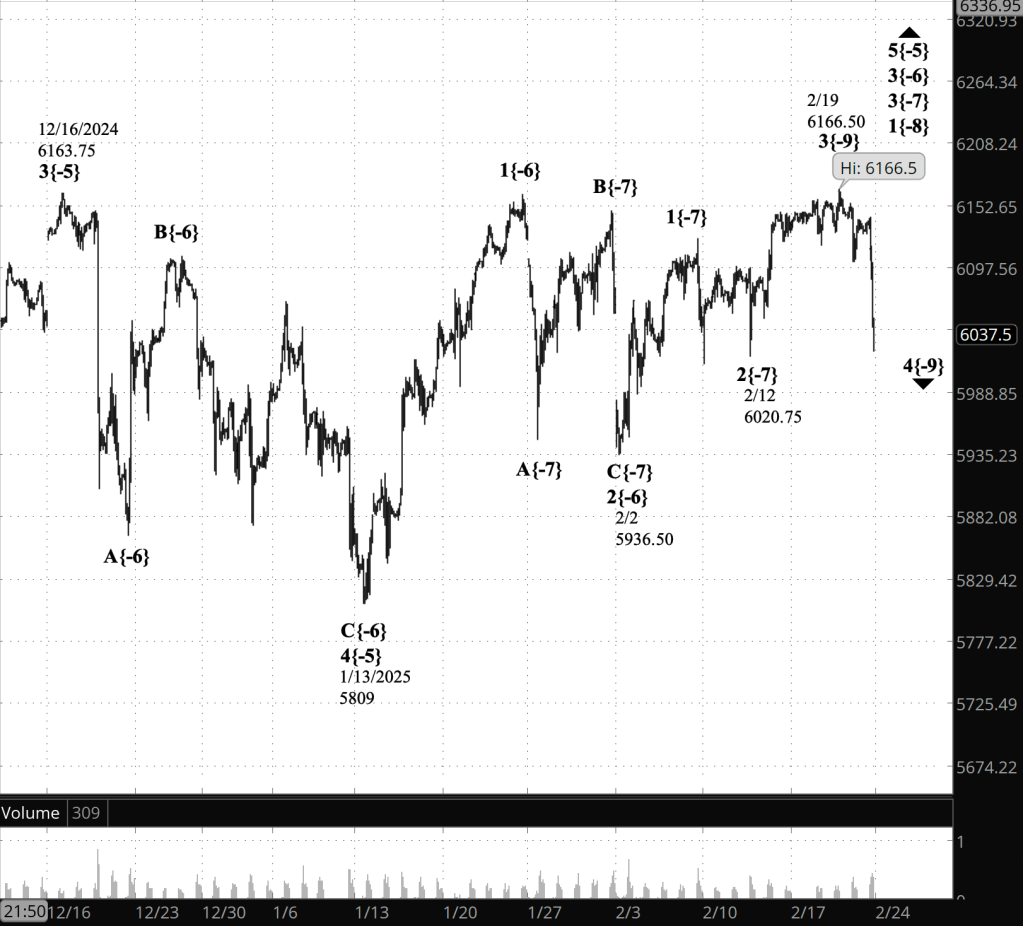
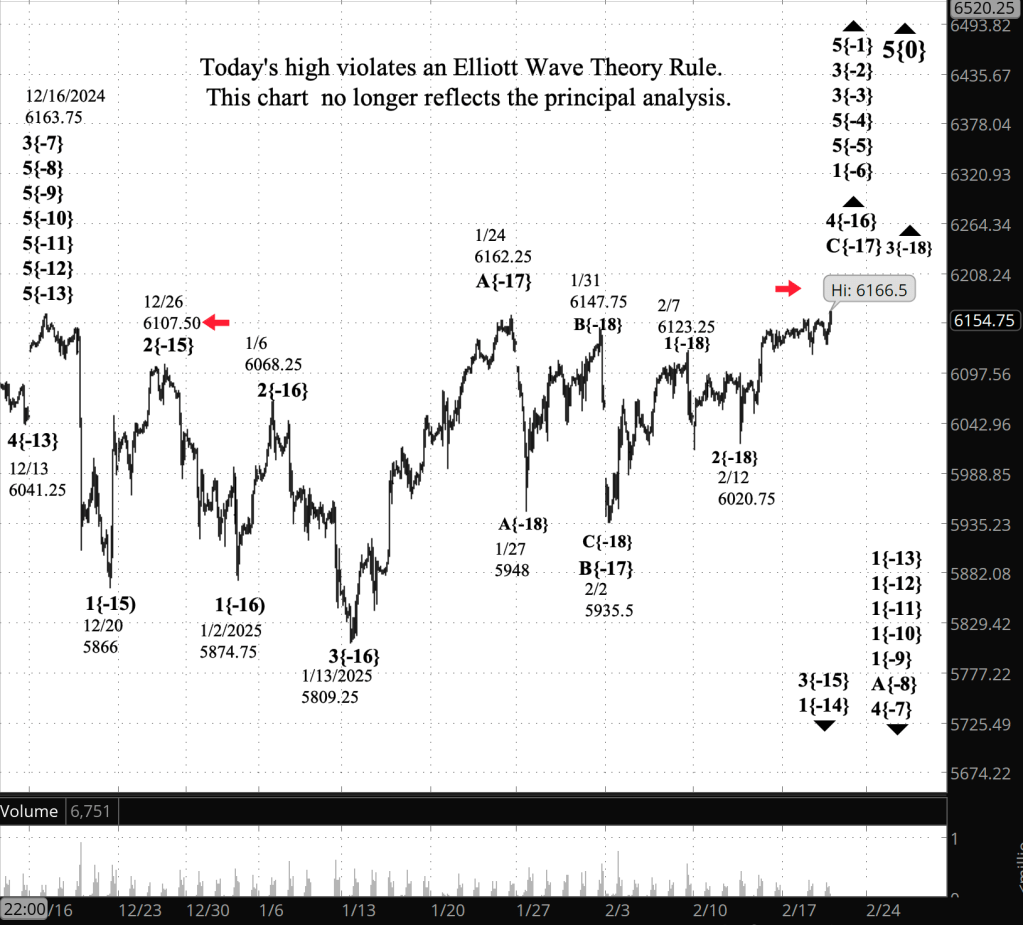
Elliott Wave Theory: The final subwave, wave C, within a 4th-wave downward correction that began on December 16, 2024, continues.
9:35 a.m. New York time
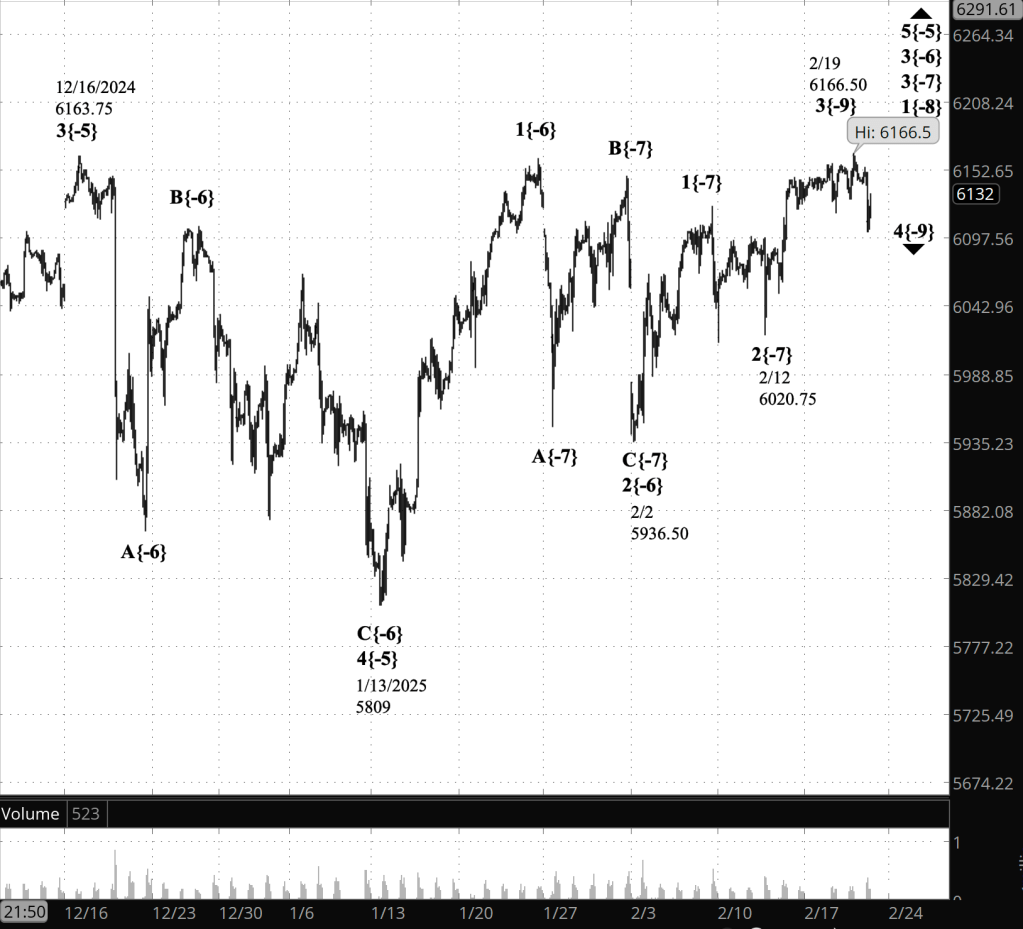
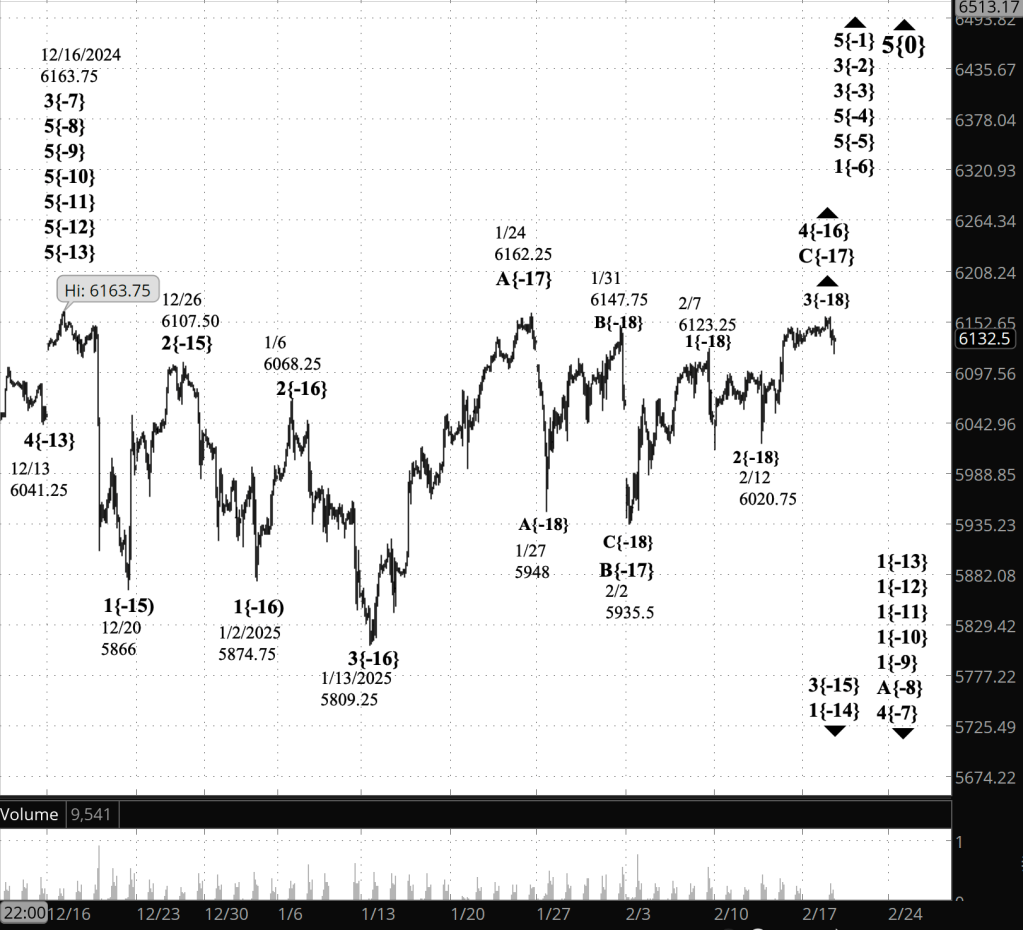
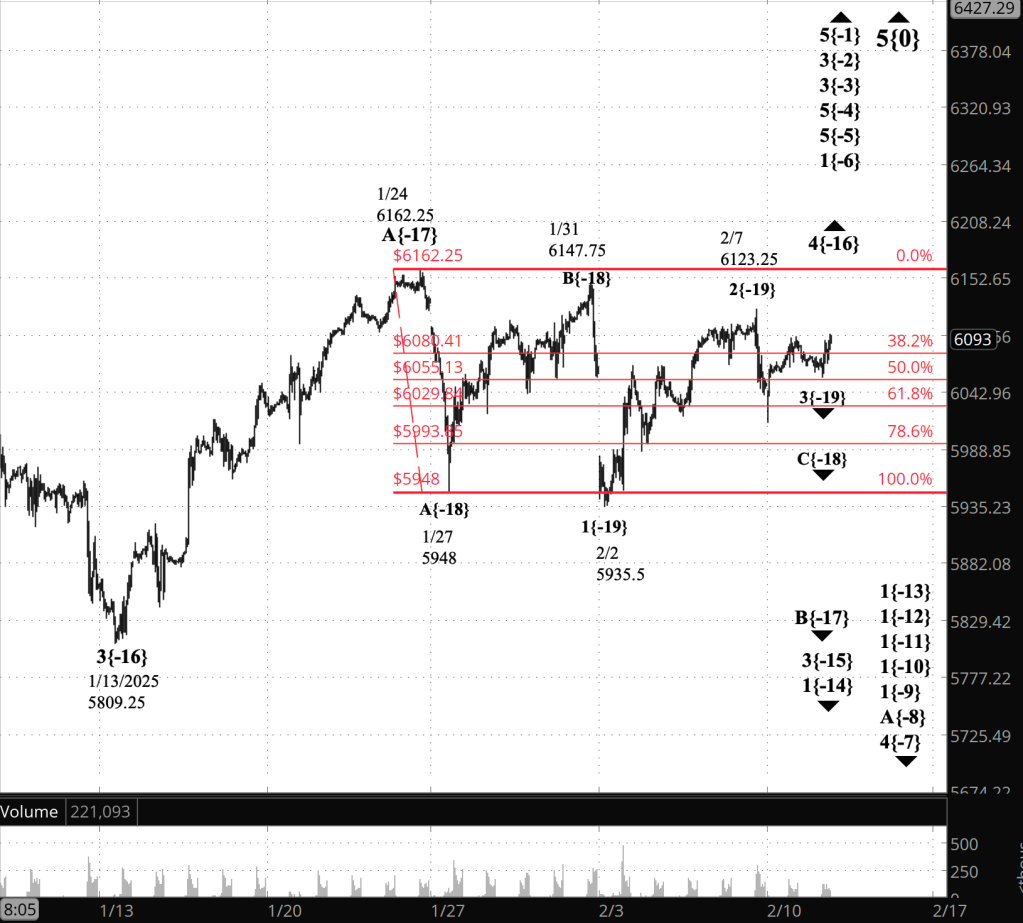
What’s happening now? The S&P 500 E-mini futures traded within a narrow range overnight, from the 6010s down to the 5970s.
What does it mean? Elliott Wave Theory interprets this movement as a pause in a downtrending final subwave, wave C, within a 4th-wave downward correction that began on December 16, 2024, from 6163.75.

[S&P 500 E-mini futures at 3:30 p.m., 110-minute bars, with volume]
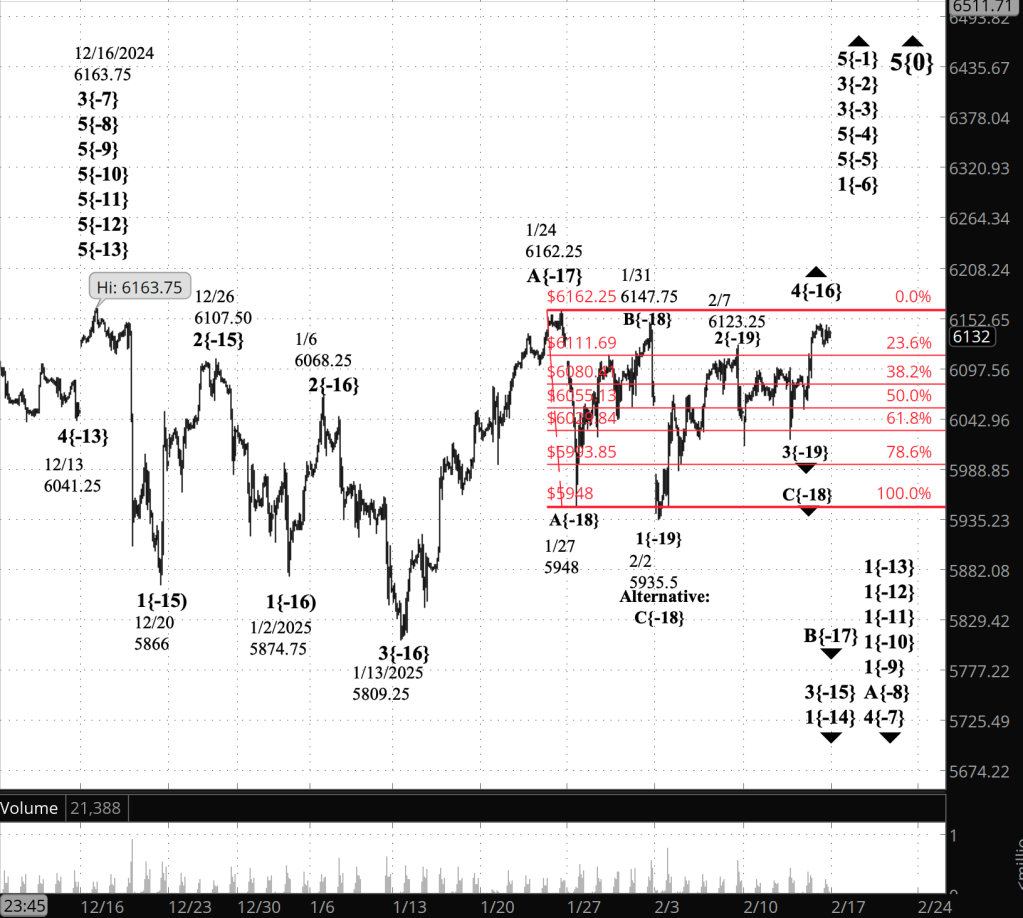
What is the alternative? It’s possible that what I’ve labeled as a simple correction is in fact a compound correction. A simple correction — a Flat or a Zigzag — has a single three-wave corrective pattern within it. A compound correction has two or three corrective patterns, each separated from the next by an X-wave, a connector that sets the stage for the next corrective pattern.
What does Elliott Wave Theory say? Here are the waves that underlie the morning’s analyses as they appeared on the chart.
Principal Analysis:
- Wave C{-6} within wave 4{-5} is underway.
Alternative Analysis:
- The same as the Principal analysis, except wave C{-6} is the final subwave of the second corrective pattern in a compound correction.
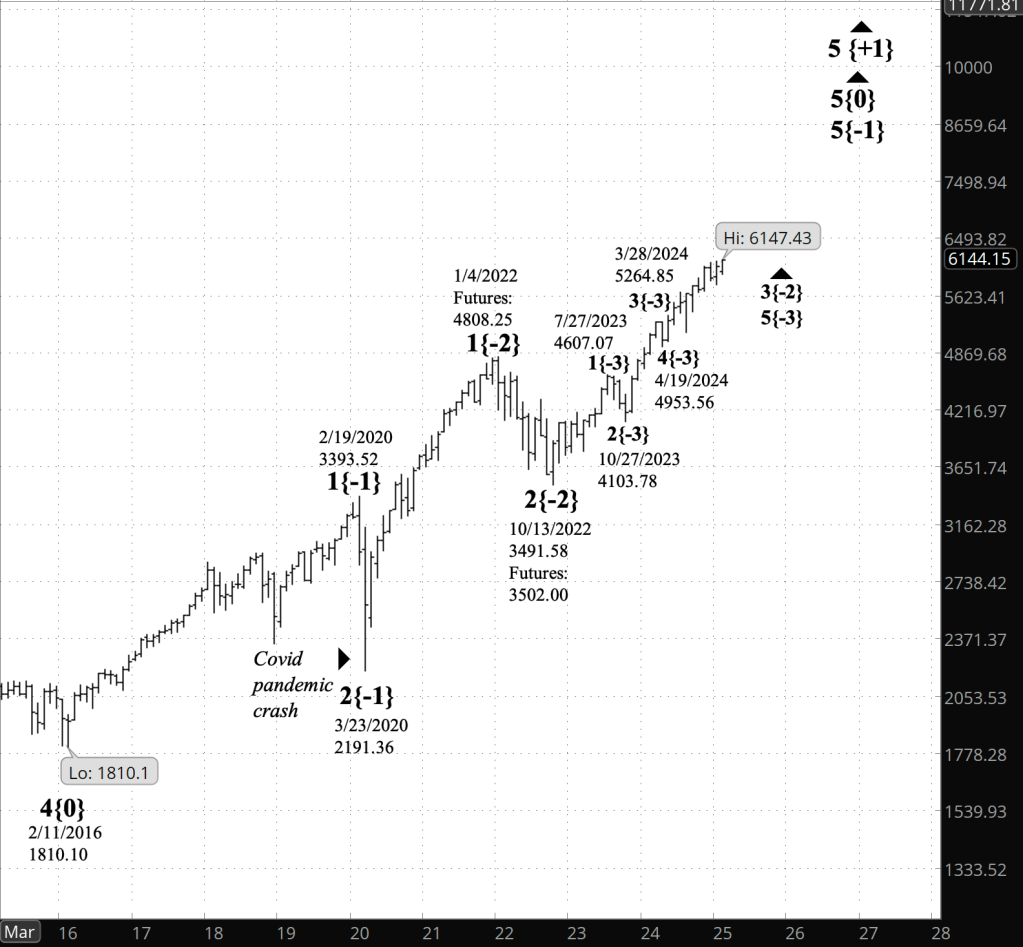
Long-term Waves.
These are the waves currently in progress under my principal analysis. Each line on the list shows the wave number, with the subscript in curly brackets, the traditional degree name, the starting date, the starting price of the S&P 500 E-mini futures, and the direction of the wave. This list has been revised to reflect the revised Principal Analysis.
- S&P 500 Index:
- 5{+3} Supercycle, 7/8/1932, 4.40 (up)
- 5{+2} Cycle, 12/9/1974, 60.96 (up)
- 5{+1} Primary, 3/6/2009, 666.79 (up)
- 5{0} Intermediate, 2/11/2016, 1810.10 (up)
- 3{-1} Minor, 3/23/2020, 2191.36 (up)
- 3{-2} Minute, 10/13/2022, 3491.58 (up)
- S&P 500 Futures
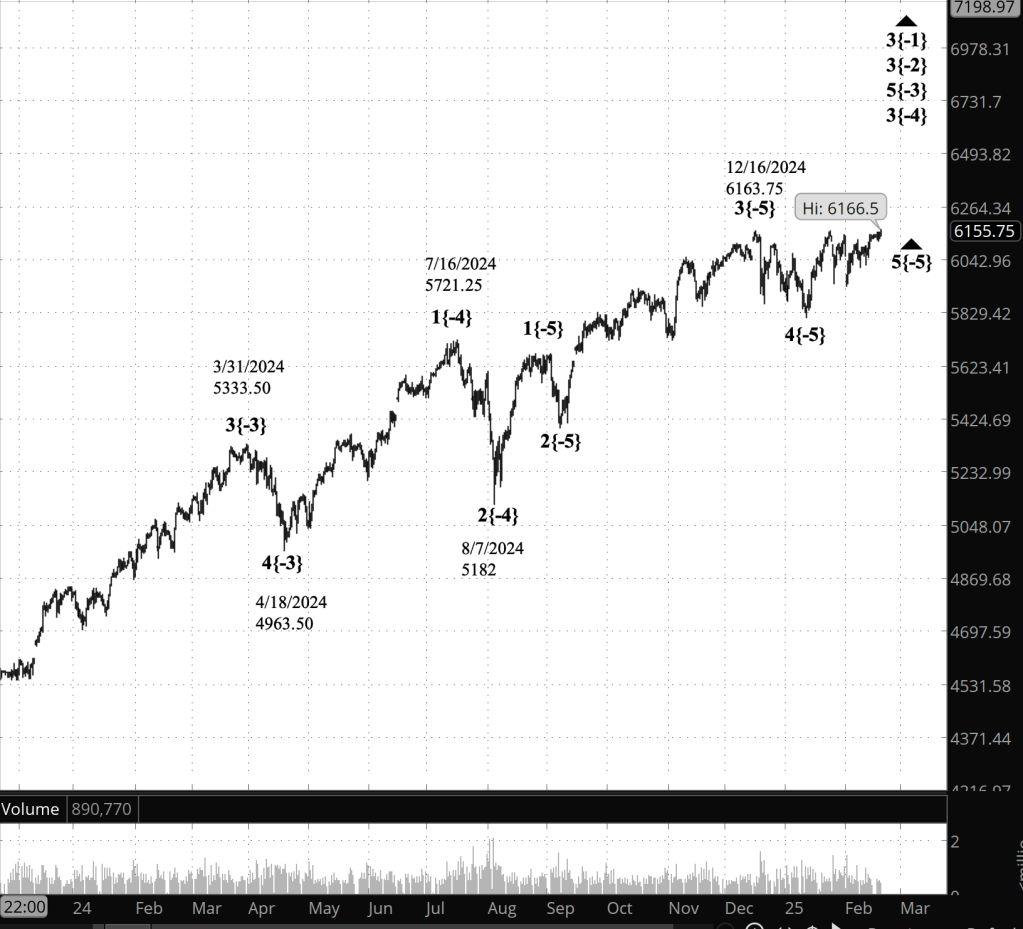
- 5{-3} Minuette, 4/18/2024, 4963.50 (up)
- 3{-4} Subminuette, 8/7/2024, 5182 (up)
- 5{-5} Micro, 1/13/2025, 5809 (up)
- C{-6} Submicro, 2/19/2025, 6166.60 (down)
Reading the chart. Price movements — waves – – in Elliott Wave Theory analysis are labeled with numbers within trending waves and letters with corrective waves. The subscripts — numbers in curly brackets — designate the wave’s degree, which, in Elliott Wave analysis, means the relative position of a wave within the larger and smaller structures that make up the chart. R.N. Elliott, who in the 1930s developed the form of analysis that bears his name, viewed the chart as a complex structure of smaller waves nested within larger waves, which in turn are nested within still larger waves. In mathematics it’s called a fractal structure, where at every scale the pattern is similar to the others.
Learning and other resources. Elliott Wave analysis provides context, not prophecy. As the 20th century semanticist Alfred Korzybski put it in his book Science and Sanity (1933), “The map is not the territory … The only usefulness of a map depends on similarity of structure between the empirical world and the map.” And I would add, in the ever-changing markets, we can judge that similarity of structure only after the fact.
See the menu page Analytical Methods for a rundown on where to go for information on Elliott Wave analysis.
By Tim Bovee, Portland, Oregon, February 25, 2025
Disclaimer
Tim Bovee, Private Trader tracks the analysis and trades of a private trader for his own accounts. Nothing in this blog constitutes a recommendation to buy or sell stocks, options or any other financial instrument. The only purpose of this blog is to provide education and entertainment.
No trader is ever 100 percent successful in his or her trades. Trading in the stock and option markets is risky and uncertain. Each trader must make trading decisions for his or her own account, and take responsibility for the consequences.
All content on Tim Bovee, Private Trader by Timothy K. Bovee is licensed under a Creative Commons Attribution-ShareAlike 4.0 International License.
Based on a work at www.timbovee.com


You must be logged in to post a comment.