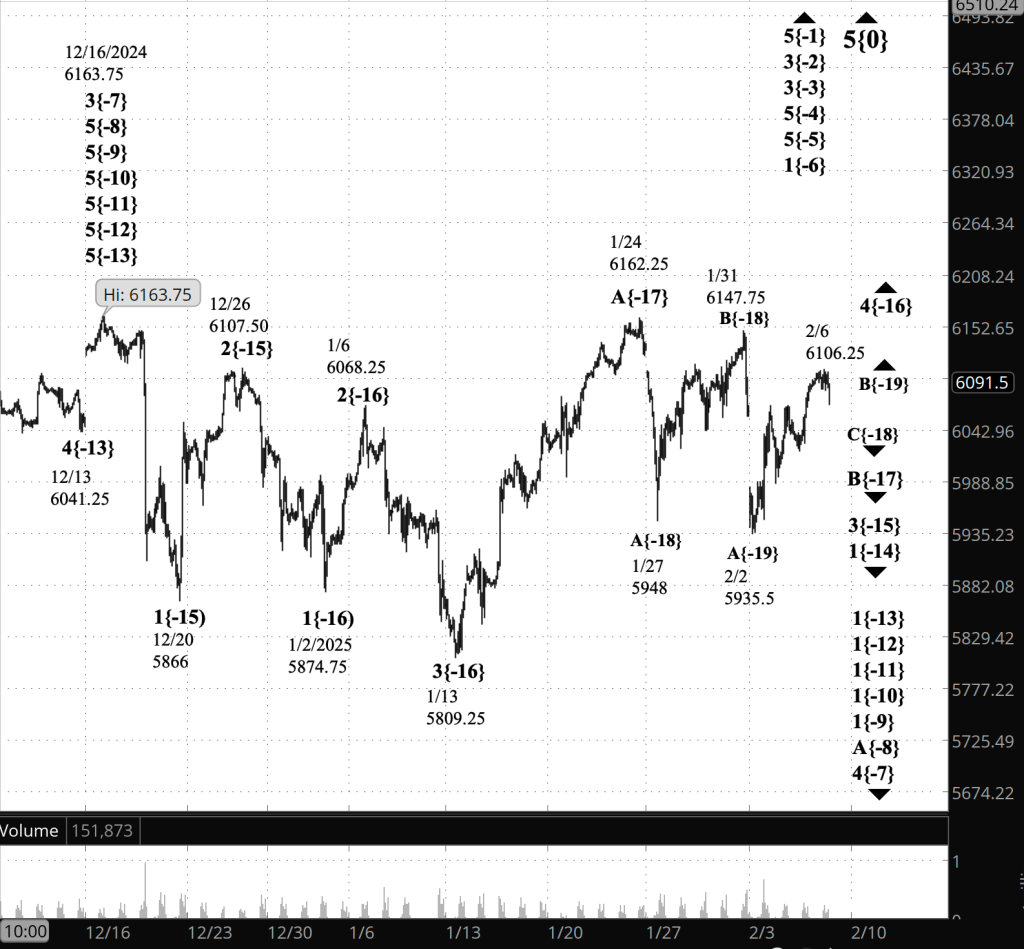
3:30 p.m. New York time
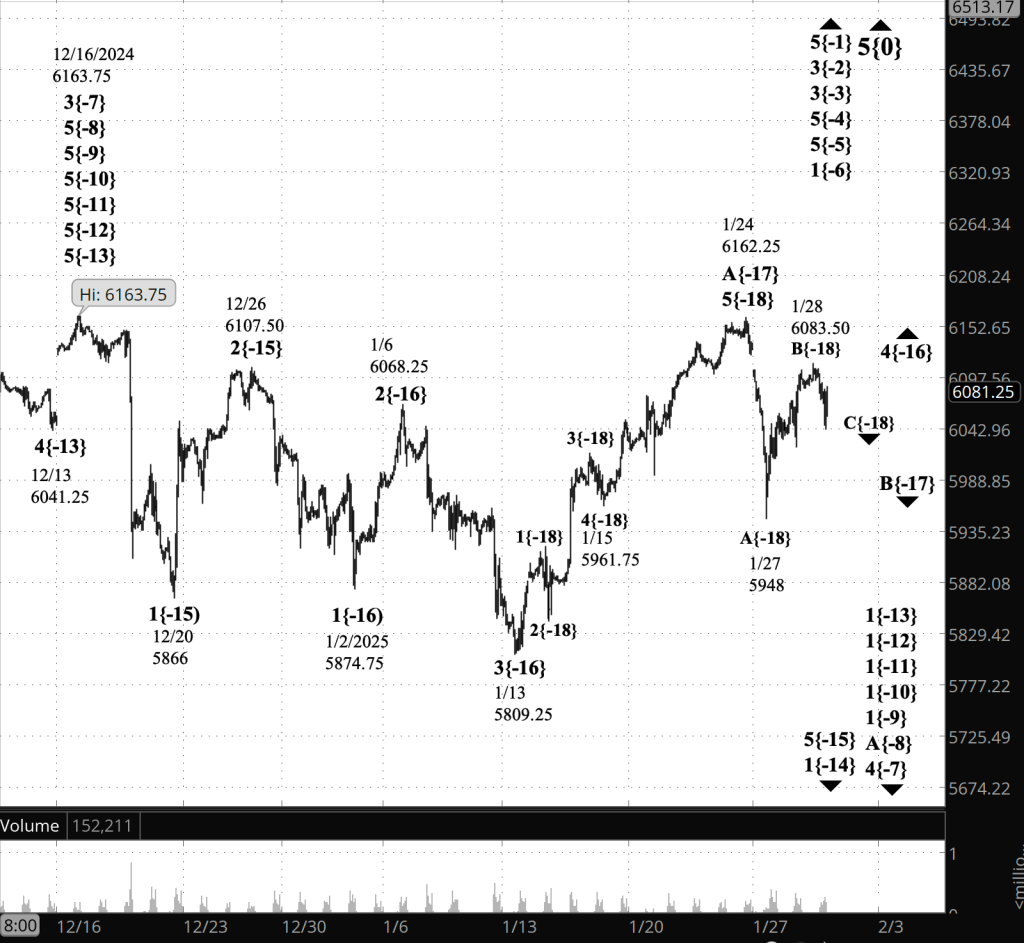
Half an hour before the opening bell. The S&P 500 worked its way higher during the session, into the 6090s. Elliott Wave Theory: The final subwave, declining wave C, within the middle subwave, declining wave B, within a 4th-wave upward correction that began on January 13 continues.
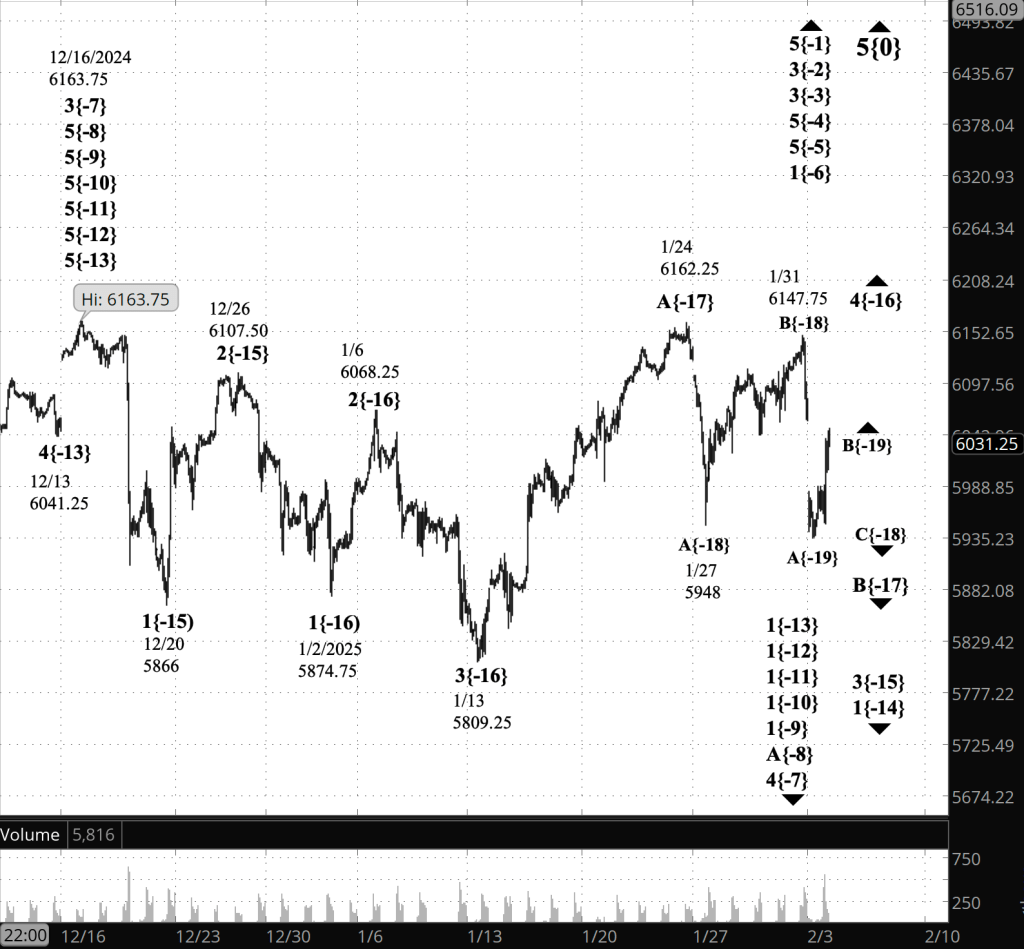
9:35 a.m. New York time
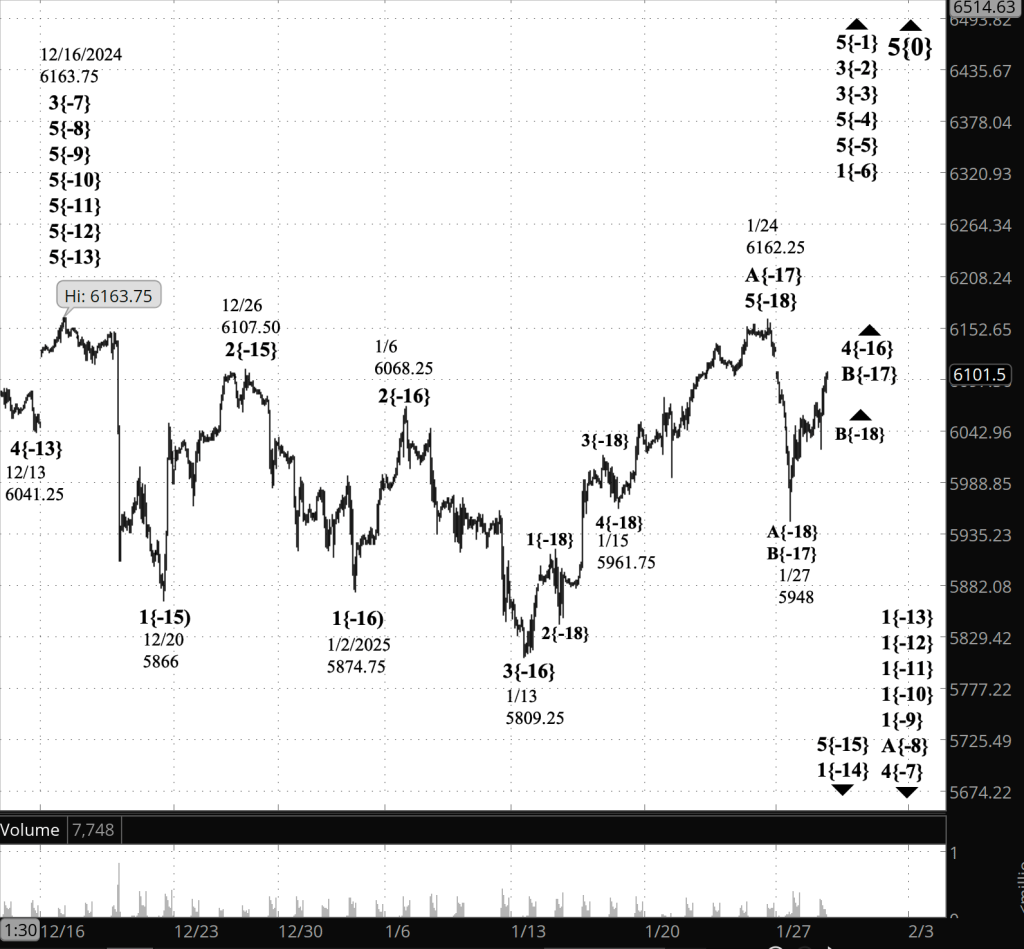
What’s happening now? The S&P 500 E-mini futures resumed trading overnight slightly above 6,000, rose immediately into the 6070s, and traded in a narrow range thereafter, occasionally rising into the 6080s.
What does it mean? I’ve adjusted the chart to encompass the 4th-wave upward correction that began on January 13, according to Elliott Wave Theory as applied to this chart. I’ve also added a Fibonacci retracement ladder, in red, to better understand the path of the C wave that began on January 31, the final subwave of the correction.
C waves have five subwaves. This wave C is presently in its middle subwave, wave C, which began on February 7.
The B wave rose to within 30 of the starting point of the preceding A wave, and then reversed, beginning wave C. So far the declining C wave has reached the 61.8% Fibonacci retracement level of wave A. A waves are generally at least the same length as wave A, and with certain patterns, can be 65% longer.
Regular readers will notice that I have changed the labeling of the wave C subwaves from letters to numbers. I erred in using letters. C waves, internally, have numbered C waves, as is natural for a five-wave structure.
At this point, for clarity, I’m switching the wave labelling to that used on the chart, where each wave number or letter is followed by a subscript in curly brackets showing how many degrees below Intermediate degree the wave stands. It’s a way of placing the wave within the elaborate fractal structure formed by the price patterns of trades. The current Intermediate wave is wave 5{0}, which began in December 2018.
We are dealing with an ongoing corrections, wave 4{-16}, which began on January 13. It working through its middle subwave, wave B{-17}. which in turn is in its final wave, wave C{-18}. And wave C{-18} is in its middle subwave, wave 3{-19}.
When the future wave 5{-19} is complete, it will also be the end of wave C{-18}, which is the final wave within wave B{-17}. Uptrending wave C{-17} will then carry the price higher.

[S&P 500 E-mini futures at 3:30 p.m., 45-minute bars, with volume]
What are the alternatives? No ambiguities as of yet. They will almost certainly show up, as they always do.
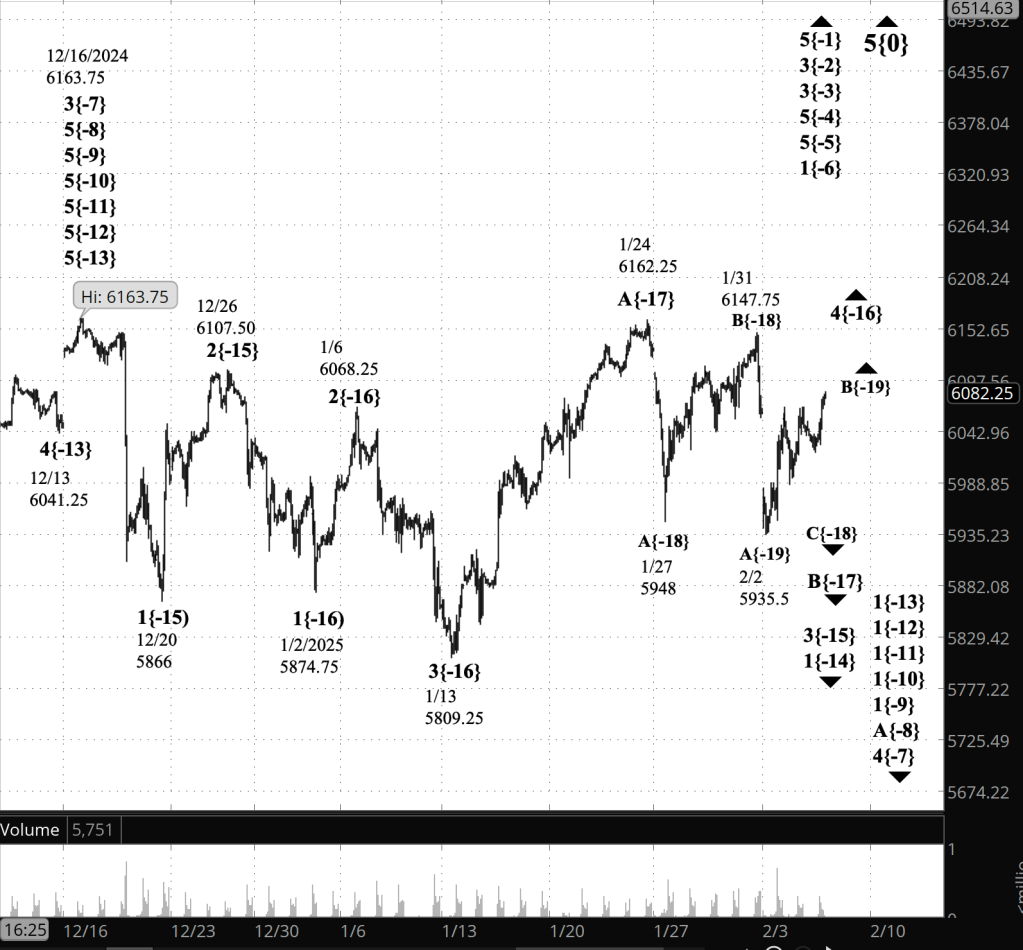
What does Elliott wave theory say? Here are the waves that underlie the analyses.
Principal Analysis:
- Rising wave 5{0} is underway. It is a wave of Intermediate degree that began in December 2018.
- It is in its final subwave, wave 5{-1}.
- Within wave 5{-1}, rising waves 5{-2}, 5{-3} and 5{-4} are underway, as is wave 5{-5}.
- Wave 5{-5} is in its initial subwave, wave 1{-6}, which in turn is in its middle subwave, wave 3{-7}.
- Wave 4{-7} is in its initial subwave, which is uptrending wave A{-8}, if wave 4{-7} is a Flat structure, with three subwaves, or wave 1{-8} if it is a Zigzag structure, with five subwaves. (I’ll assume Flat as the list continues, since that’s more common within 4th waves)
- Wave A{-8} is in its initial subwave, wave 1{-9}, as are waves 1{-10}, 1{-11}, 1{-12}, and 1{-13}.
- Wave 1{-14}, an upward correction and is in its first subwave, wave 3{-15}.
- Wave 3{-15} is in its second subwave, rising wave 4{-16}, an upward correction
- Wave 4{-16} is in its middle subwave, descending wave B{-17}, which is in its middle subwave, rising wave B{-18}
- Declining wave C{-19}, the final subwave of wave B{-18}, has begun.
Long-term Waves.
These are the waves currently in progress under my principal analysis. Each line on the list shows the wave number, with the subscript in curly brackets, the traditional degree name, the starting date, the starting price of the S&P 500 E-mini futures, and the direction of the wave. (Updated with today’s reanalysis.)
- S&P 500 Index:
- 5{+3} Supercycle, 7/8/1932, 4.40 (up)
- 5{+2} Cycle, 12/9/1974, 60.96 (up)
- 5{+1} Primary, 3/6/2009, 666.79 (up)
- 5{0} Intermediate, 12/26/2018, 2346.58 (up)
- S&P 500 Futures
- 5{-1} Minor, 10/27/2023, 4127.25 (up)
- 3{-2} Minute, 10/27/23, 4127.75 (up)
- 3{-3} Minuette, 10/27/23, 4127.75 (up)
- 5{-4} Subminuette, 4/18/2024, 4963.50 (up)
- 5{-5} Micro, 8/5/2024, 5120 (up)
- 1{-6} Submicro, 8/5/2024, 5120 (up)
- 4{-7} Minuscule, 12/16/2024, 6163.75 (down)
- A{-8} (unnamed), 12/16/2024, 6163.75 (down)
- 1{-9} (unnamed), 12/16/2024, 6163.75 (down)
- 1{-10} (unnamed), 12/16/2024, 6163.75 (down)
- 1{-11} (unnamed), 12/16/2024, 6163.75 (down)
- 1{-12} (unnamed), 12/16/2024, 6163.75 (down)
- 1{-13} (unnamed), 12/16/2024, 6163.75 (down)
- 1{-14} (unnamed), 1/13/2025, 5809.25 (down)
- 3{-15} (unnamed), 1/13/2025, 5809.25 (down)
- 4{-16} (unnamed), 1/13/2025, 5809.25 (up)
- B{-17} (unnamed), 1/24/2025, 6162.25 (down)
- C{-18} (unnamed), 1/31/2025, 6147.75 (down)
- B{-18} (unnamed), 1/27/2025, 5948 (up)
- C{-19} (unnamed), 2/7/2025, 5935.5 (down)
Reading the chart. Price movements — waves – – in Elliott wave analysis are labeled with numbers within trending waves and letters with corrective waves. The subscripts — numbers in curly brackets — designate the wave’s degree, which, in Elliott wave analysis, means the relative position of a wave within the larger and smaller structures that make up the chart. R.N. Elliott, who in the 1930s developed the form of analysis that bears his name, viewed the chart as a complex structure of smaller waves nested within larger waves, which in turn are nested within still larger waves. In mathematics it’s called a fractal structure, where at every scale the pattern is similar to the others.
Learning and other resources. Elliott wave analysis provides context, not prophecy. As the 20th century semanticist Alfred Korzybski put it in his book Science and Sanity (1933), “The map is not the territory … The only usefulness of a map depends on similarity of structure between the empirical world and the map.” And I would add, in the ever-changing markets, we can judge that similarity of structure only after the fact.
See the menu page Analytical Methods for a rundown on where to go for information on Elliott wave analysis.
By Tim Bovee, Portland, Oregon, February 10, 2025
Disclaimer
Tim Bovee, Private Trader tracks the analysis and trades of a private trader for his own accounts. Nothing in this blog constitutes a recommendation to buy or sell stocks, options or any other financial instrument. The only purpose of this blog is to provide education and entertainment.
No trader is ever 100 percent successful in his or her trades. Trading in the stock and option markets is risky and uncertain. Each trader must make trading decisions for his or her own account, and take responsibility for the consequences.
All content on Tim Bovee, Private Trader by Timothy K. Bovee is licensed under a Creative Commons Attribution-ShareAlike 4.0 International License.
Based on a work at www.timbovee.com.


You must be logged in to post a comment.