3:30 p.m. New York time
Half an hour before the closing bell. The S&P 500 futures traded rangebound, having fallen to 6117 and then rising, remaining below the overnight peak.
The 2nd-wave downward correction that began overnight continues, part of the 5th-wave uptrend that began on December 13.
9:35 a.m. New York time
What’s happening now? The S&P 500 E-mini futures peaked overnight at 6152.75 and declined.
What does it mean? In Elliott Wave Theory, this peak marks the end of the initial subwave, rising wave 1, within the 5th-wave uptrend that began on December 13, and the beginning of the next subwave, declining wave 2.
The Case of the Missing 3rd Wave. The opening gap when trading resumed after the weekend presents an interesting problem. Wave 1 covered a distance proportional to other 1st waves of the same degree. The five subwaves within wave 1 are visible, despite being minuscule. The 3rd subwave for the most part is in the gap. The 3rd subwave, under the theory’s rules, must have five subwaves. Not this one.
The analysis assumes that the missing 3rd wave is there, a ghost wave of sorts, because that’s a way under Elliott Wave Theory’s rules for the chart to make sense. We see over time whether or not it really does make sense.
What’s next? The 5th wave will work through its five subwaves. The fun will start when it ends.
On the chart, I label each wave with a number followed by a number in bracket’s showing the wave’s position in the fractal structure of the price patterns as fractal degrees’ distance from Intermediate degree. The present Intermediate degree wave is wave 5{0}, which began in December 2018.
The present 5th wave is ave 5{-13}. It’s parent wave, wave 5{-12}, is also a 5th wave, as are the encompassing waves, each one degree larger than the one before, all the way up to wave 5{-8}, whose parent wave is wave 3{-7}.
The end of wave 5{-13} will instantly cascade up the fractal structure, and all of the 5th waves up to wave 5{-8}. Wave 3{-7} will also end, and a 4th-wave downward correction will begin.
Wave 3{-7} began on August 7 and has been in progress for four months and 10 days, giving some indication of the magnitude of the 4th wave that will follow.

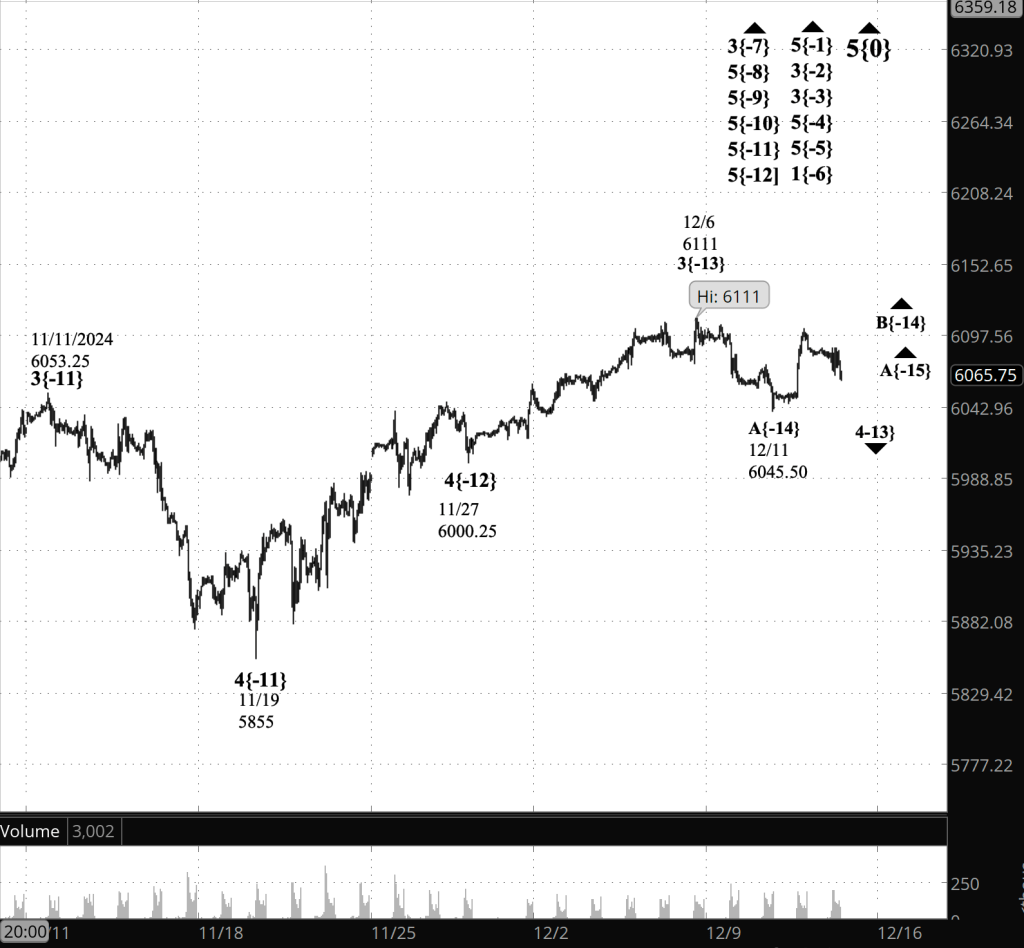
[S&P 500 E-mini futures at 3:30 p.m., hourly bars, with volume]
What are the alternatives? Discussed above in the missing 3rd wave section.
What does Elliott wave theory say? Here are the waves that underly the analyses.
Principal Analysis:
- .Rising wave 5{0} is underway. It is a wave of Intermediate degree that began in December 2018.
- It is in its final subwave, wave 5{-1}.
- Within wave 5{-1}, rising waves 5{-2}, 5{-3} and 5{-4} are underway, as is wave 5{-5}.
- Wave 5{-5} is in its initial subwave, wave 1{-6}, which in turn is in its middle subwave, wave 3{-7}.
- Wave 3{-7} is in its final; subwave, uptrending wave 5{-8}.
- Wave 5{-8} is in its final subwave, wave 5{-9}, which is in its final subwave, uptrending wave 5{-10}.
- Wave 5{-10} is in its final subwave, wave 5{-11}, which appears to have completed its middle subwave, wave 3{-12}.
- Rising Wave 5{-13} is now underway and is in its second subwave, wave 2{-14}.
Long-term Waves.
These are the waves currently in progress under my principal analysis. Each line on the list shows the wave number, with the subscript in curly brackets, the traditional degree name, the starting date, the starting price of the S&P 500 E-mini futures, and the direction of the wave.
- S&P 500 Index:
- 5{+3} Supercycle, 7/8/1932, 4.40 (up)
- 5{+2} Cycle, 12/9/1974, 60.96 (up)
- 5{+1} Primary, 3/6/2009, 666.79 (up)
- 5{0} Intermediate, 12/26/2018, 2346.58 (up)
- S&P 500 Futures
- 5{-1} Minor, 10/27/2023, 4127.25 (up)
- 3{-2} Minute, 10/27/23, 4127.75 (up)
- 3{-3} Minuette, 10/27/23, 4127.75 (up)
- 5{-4} Subminuette, 4/18/2024, 4963.50 (up)
- 5{-5} Micro, 8/5/2024, 5120 (up)
- 1{-6} Submicro, 8/5/2024, 5120 (up)
- 3{-7} Minuscule, 8/7/2024, 5182 (up)
- 5{-8} (unnamed), 9/6/2024, 5394 (up)
- 5{-9} (unnamed), 10/2/2024, 5724 (up)
- 5{-10} (unnamed), 11/4/2024, 5824.25 (up)
- 5{-11} (unnamed), 11/19/2024, 5933 (up)
- 5{-12} (unnamed), 11/27/2024, 6000.25 (up)
- 5{-13} (unnamed), 12/13/2024, 6041.25 (up)
Reading the chart. Price movements — waves – – in Elliott wave analysis are labeled with numbers within trending waves and letters with corrective waves. The subscripts — numbers in curly brackets — designate the wave’s degree, which, in Elliott wave analysis, means the relative position of a wave within the larger and smaller structures that make up the chart. R.N. Elliott, who in the 1930s developed the form of analysis that bears his name, viewed the chart as a complex structure of smaller waves nested within larger waves, which in turn are nested within still larger waves. In mathematics it’s called a fractal structure, where at every scale the pattern is similar to the others.
Learning and other resources. Elliott wave analysis provides context, not prophecy. As the 20th century semanticist Alfred Korzybski put it in his book Science and Sanity (1933), “The map is not the territory … The only usefulness of a map depends on similarity of structure between the empirical world and the map.” And I would add, in the ever-changing markets, we can judge that similarity of structure only after the fact.
See the menu page Analytical Methods for a rundown on where to go for information on Elliott wave analysis.
By Tim Bovee, Portland, Oregon, December 17, 2024
Disclaimer
Tim Bovee, Private Trader tracks the analysis and trades of a private trader for his own accounts. Nothing in this blog constitutes a recommendation to buy or sell stocks, options or any other financial instrument. The only purpose of this blog is to provide education and entertainment.
No trader is ever 100 percent successful in his or her trades. Trading in the stock and option markets is risky and uncertain. Each trader must make trading decisions for his or her own account, and take responsibility for the consequences.
License
All content on Tim Bovee, Private Trader by Timothy K. Bovee is licensed under a Creative Commons Attribution-ShareAlike 4.0 International License.
Based on a work at www.timbovee.com.


You must be logged in to post a comment.