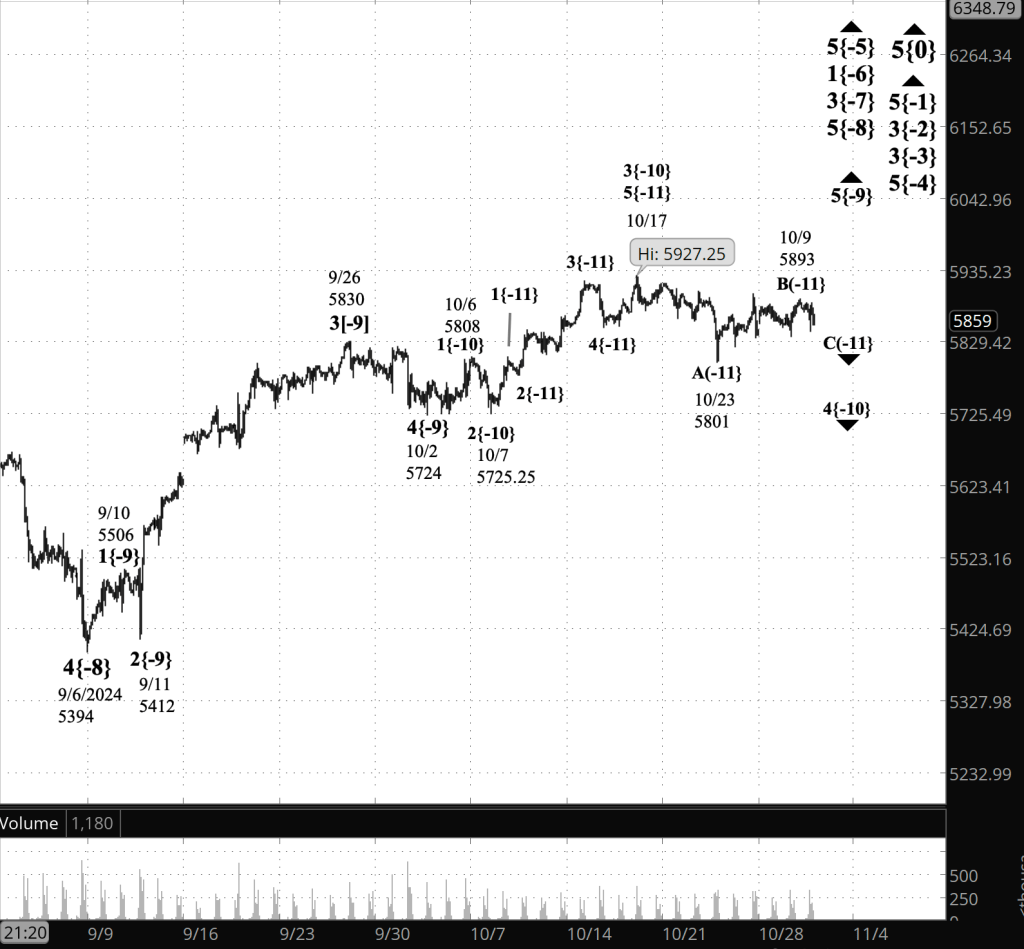
3:30 p.m. New York time
Half an hour before the closing bell. The S&P 500 futures continued to fall during the session, so far reaching into the 5740s.
Elliott Wave Theory: The middle subwave, wave 3, within the final subwave, wave C, within the 4th-wave downward correction that began on October 17 continues.
Typically, a C wave will be about as long as the preceding A wave. With the 4th-wave correction, wave A was 126 points long, Wave C began at 5893. Therefore, the likely endpoint for wave C is 5767.
The price reached into the 5750s late it in the session. If this C wave is typical, I expect to end soon.
At that point, things interesting,
If the 4th-wave is typical, then the end of the C wave will be the end of 4th wave’s three-subwave corrective pattern and the beginning of an uptrending 5th-wave.
Sometimes, corrective waves take a complex form, containing two or three corrective patterns. If this is the case, then wave C will be followed by a rising connector — an X-wave — and then a declining A wave, the initial wave of the second corrective pattern.
Wave 5 will eventually begin, but a complex correction would delay its debut.,
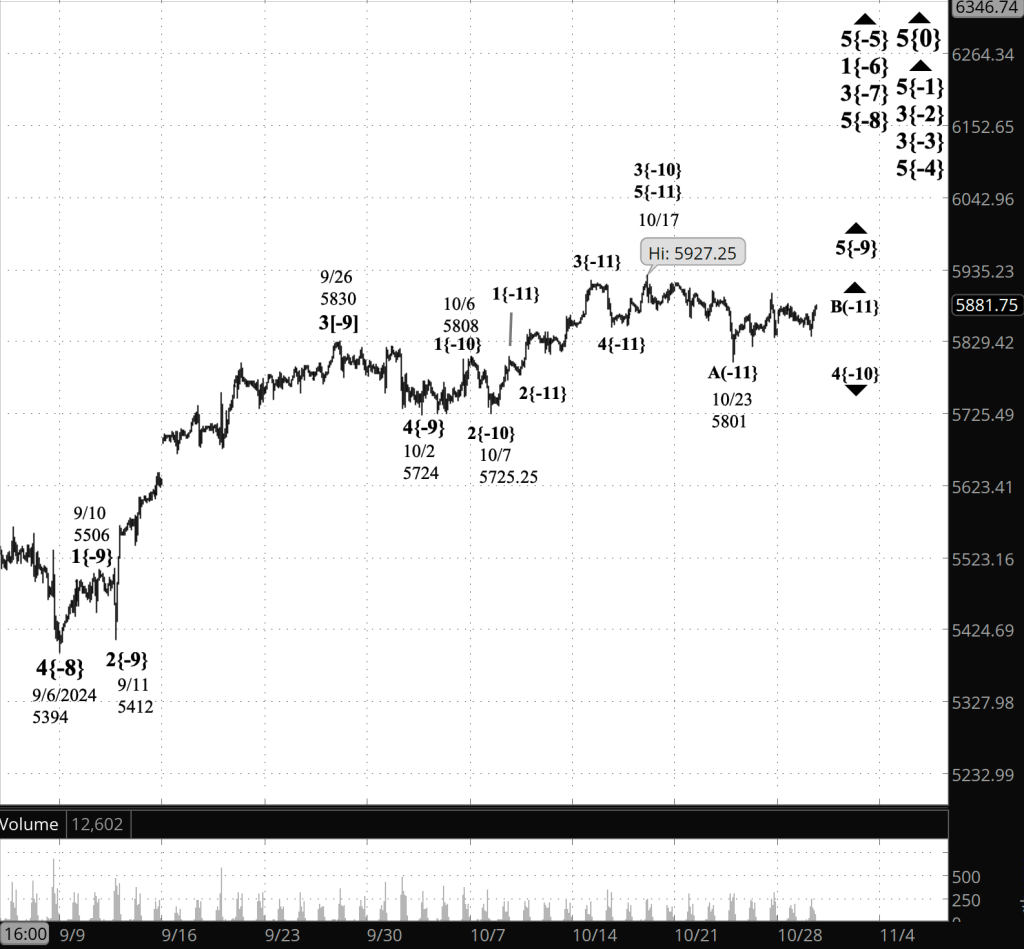
9:35 a.m. New York time
What’s happening now? The S&P 500 E-mini futures fell overnight, dropping into the 5790s as the opening bell sounded.
What does it mean? Elliott Wave Theory sees the overnight decline as the final subwave, wave C, of a 4th-wave downward correction that began on October 17. The overnight low, 5801, is identical to the end point of a initial subwave wave A.
The downward reach confirms yesterday’s principal analysis, which concluded that wave C was underway.
The C wave will have five subwaves altogether. The decline that began during the October 30 session is the middle subwave, wave 3.

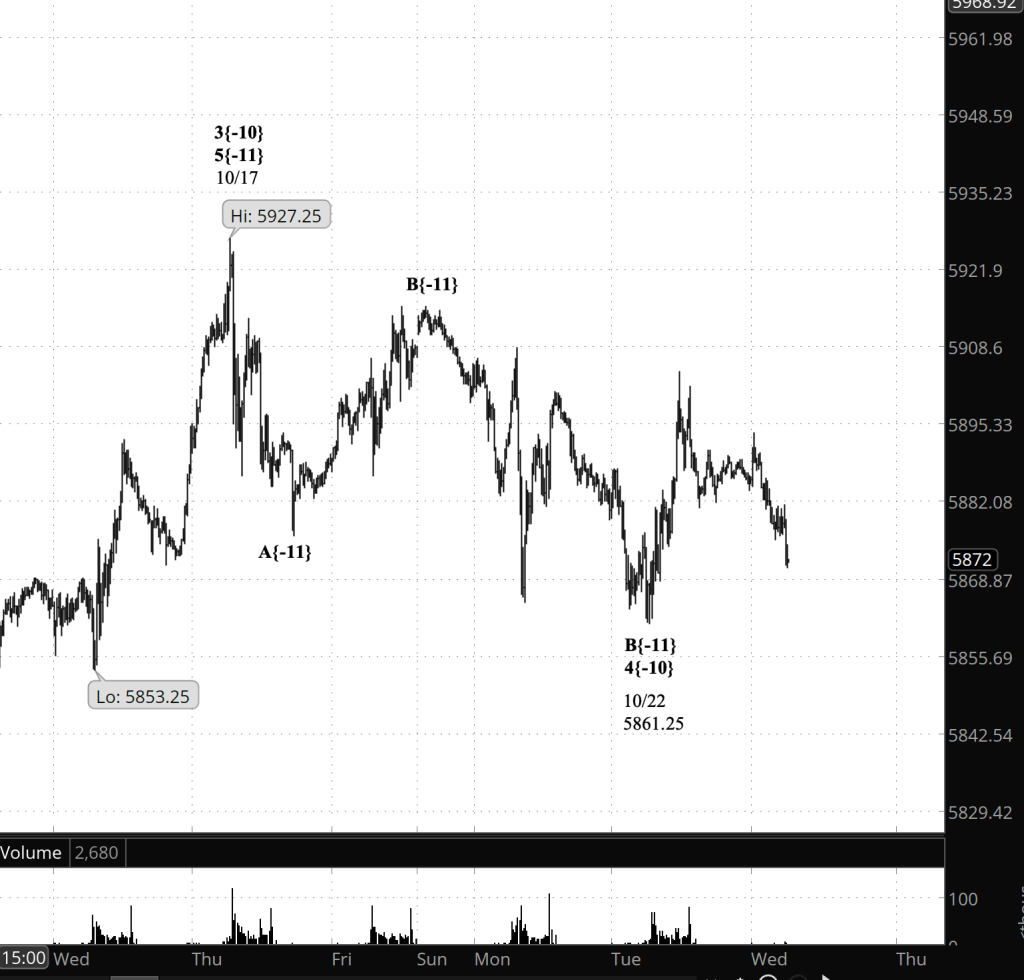
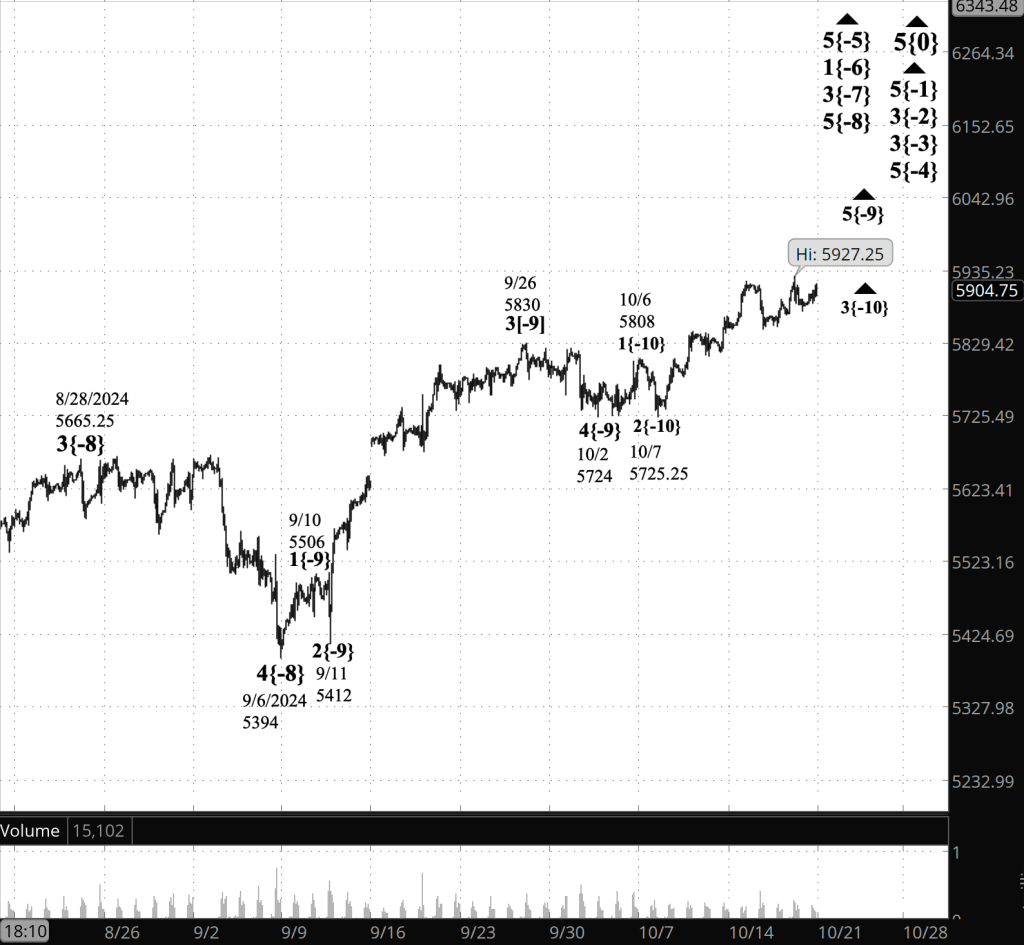
[S&P 500 E-mini futures at 3:30 p.m., 60-minute bars, with volume]
What are the alternatives? None at present. As always, they will develop.
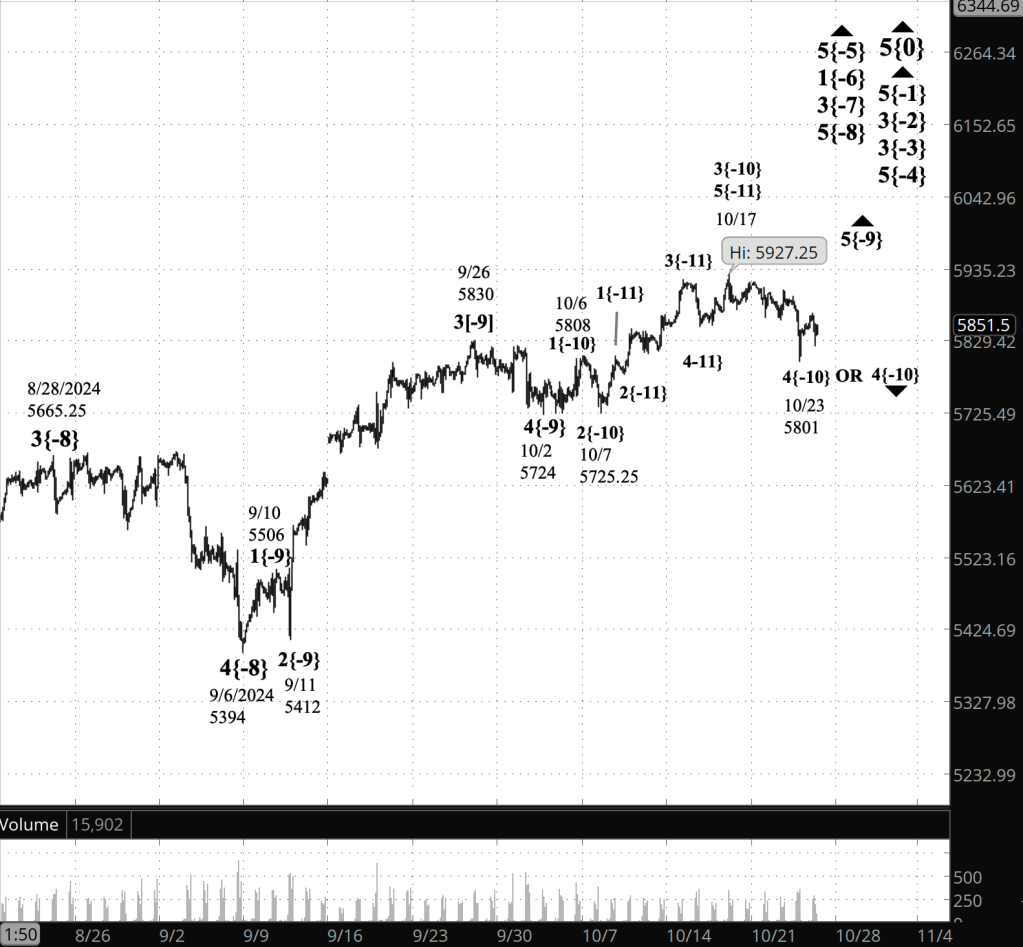
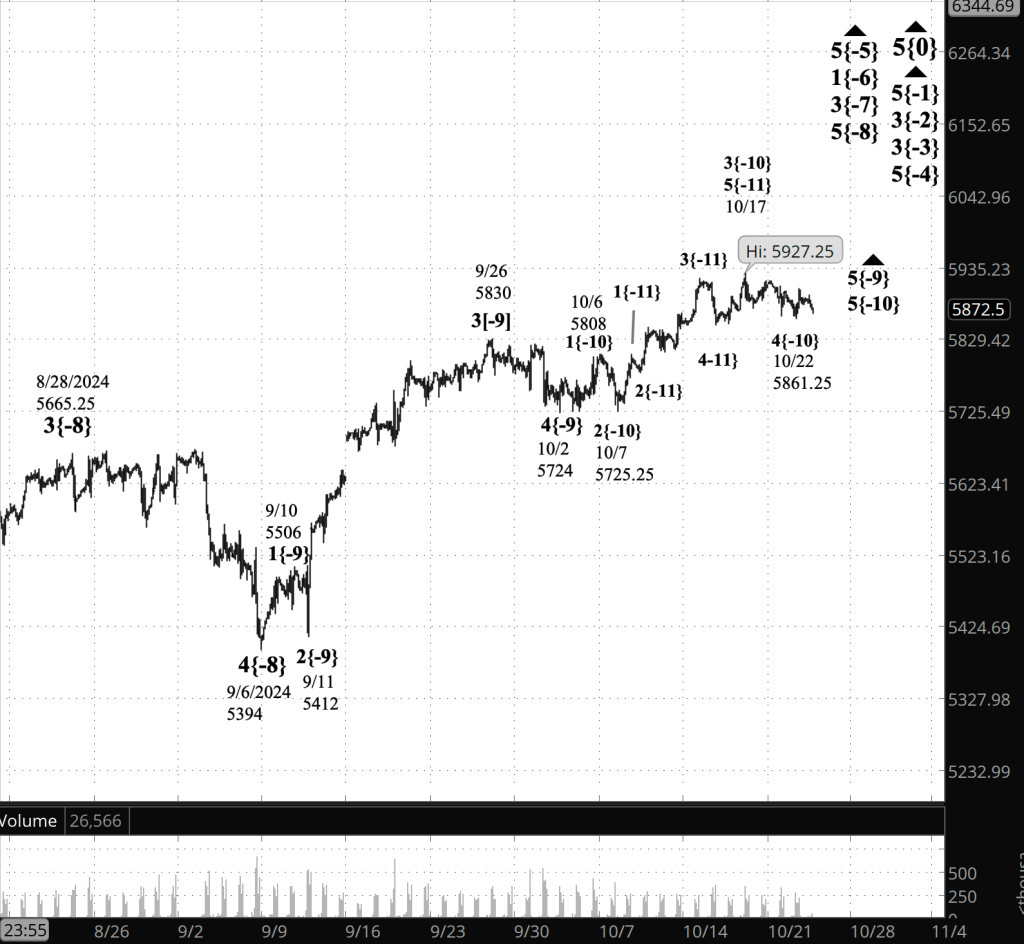
What does Elliott wave theory say? Here are the waves that underly the analyses.
Principal Analysis:
- Rising wave 5{0} is underway. It is a wave of Intermediate degree that began in December 2018.
- It is in its final subwave, wave 5{-1}.
- Within wave 5{-1}, rising waves 5{-2}, 5{-3} and 5{-4} are underway, as is wave 5{-5}.
- Wave 5{-5} is in its initial subwave, wave 1{-6}, which in turn is in its middle subwave, wave 3{-7}.
- Wave 3{-7} is in its final; subwave, uptrending wave 5{-8}.
- Wave 5{-8} is in its final subwave, wave 5{-9}, which is in its next-to-the-last subwave, corrective wave 4{-10}, which is in its final subwave, wave C{-11}.
- Wave C{-11} is in its middle subwave, wave 3{-12}.
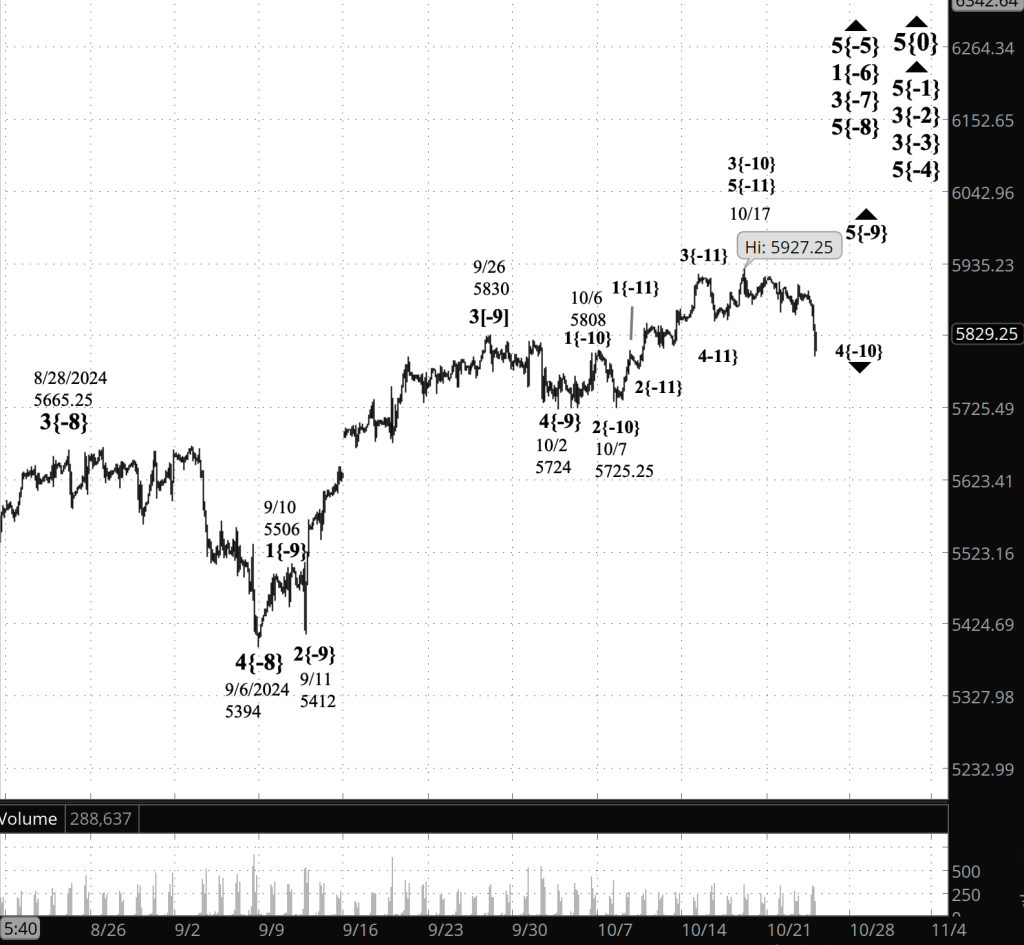
Reading the chart. Price movements — waves – – in Elliott wave analysis are labeled with numbers within trending waves and letters with corrective waves. The subscripts — numbers in curly brackets — designate the wave’s degree, which, in Elliott wave analysis, means the relative position of a wave within the larger and smaller structures that make up the chart. R.N. Elliott, who in the 1930s developed the form of analysis that bears his name, viewed the chart as a complex structure of smaller waves nested within larger waves, which in turn are nested within still larger waves. In mathematics it’s called a fractal structure, where at every scale the pattern is similar to the others.
Learning and other resources. Elliott wave analysis provides context, not prophecy. As the 20th century semanticist Alfred Korzybski put it in his book Science and Sanity (1933), “The map is not the territory … The only usefulness of a map depends on similarity of structure between the empirical world and the map.” And I would add, in the ever-changing markets, we can judge that similarity of structure only after the fact.
See the menu page Analytical Methods for a rundown on where to go for information on Elliott wave analysis.
By Tim Bovee, Portland, Oregon, October 31, 2024
Disclaimer
Tim Bovee, Private Trader tracks the analysis and trades of a private trader for his own accounts. Nothing in this blog constitutes a recommendation to buy or sell stocks, options or any other financial instrument. The only purpose of this blog is to provide education and entertainment.
No trader is ever 100 percent successful in his or her trades. Trading in the stock and option markets is risky and uncertain. Each trader must make trading decisions for his or her own account, and take responsibility for the consequences.
License
All content on Tim Bovee, Private Trader by Timothy K. Bovee is licensed under a Creative Commons Attribution-ShareAlike 4.0 International License.
Based on a work at www.timbovee.com.


You must be logged in to post a comment.