Trader’s Notebook

3:30 p.m. New York time

Half an hour before the closing bell. The S&P 500 futures fell during the session, reaching into the 5410s.

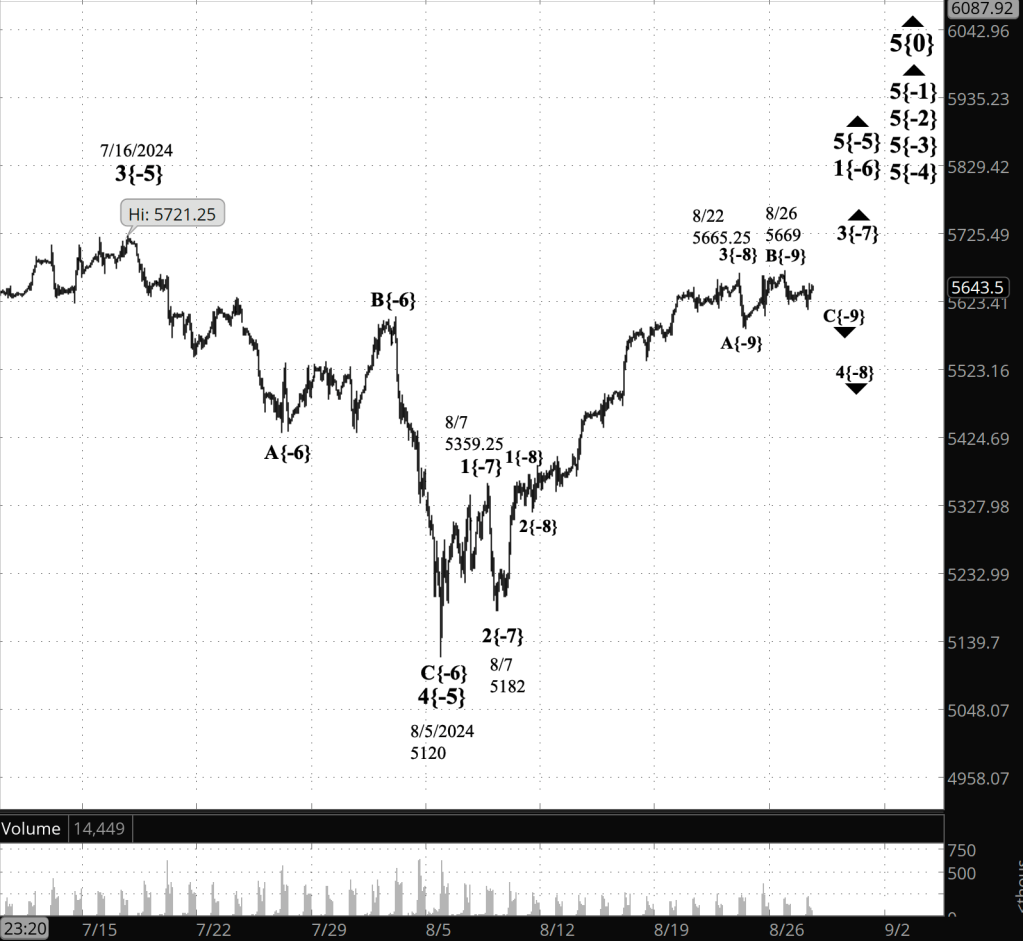
Elliott Wave Theory: I’ve updated the chart below to show a close-up the 4th-degree downward correction that began on August 28. The closer view clarifies that the final subwave of the correction, wave C, is in its downtrending 3rd-wave, which in turn is in its final subwave. I had previously counted wave C as being in its final subwave, wave 5.

Waves on the chart are marked with a wave number followed by a subscript in curly brackets showing the wave’s distance within the fractal structure of the chart from Intermediate degree. The present Intermediate degree is wave 5{0}, which began in December 2018. The 4th wave downward correction is wave 4{-8}, meaning it is eight degrees below Intermediate degree. Internally, wave 4{-8} is in wave C{-9}, which in turn is in wave 3{-10}. That 3rd wave is in wave 5{-11}, its final subwave.

9:35 a.m. New York time

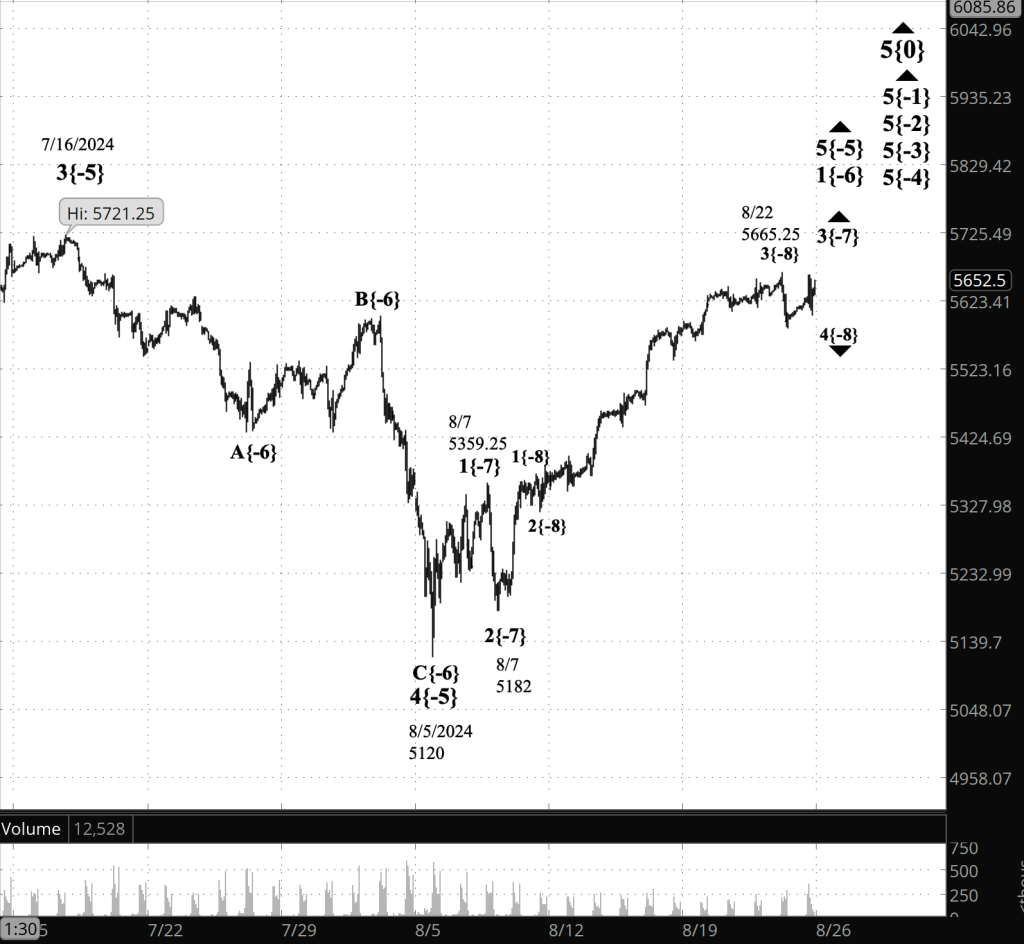
What’s happening now? The S&P 500 E-mini futures fell to 5466.50 overnight until an hour before the opening bell, when the Employment Situation Report was published and the price rose into the 5510s within the span of a minute, and kept rising, remaining below the prior day’s high.

The report showed that the unemployment rate had decline from 4.3 to 4.2, and as a result the Sahm Rule, the most sensitive measure of whether a recession is underway, showed that yes, the U.S. is still in a recession, for the second month in a row,

What does it mean? I’ll leave it to economists to parse the importance of the recession indicator. The S&P 500 futures, Elliott Wave Theory shows, is still in the 4th-wave downward correction that began on August 28. That correction is in wave C, it’s final subwave if wave 4 is typical. (See the alternatives section below for a discussion of the atypical.)

The overnight decline suggests to me that the final subwave, wave 5, within wave C has begun, although the chart, as is often the case for low-degree movements, is not entirely clear, and it’s possible that the next-to-the-last subwave is still underway.

When the 4th-wave correction that began in late August is complete, it will be followed by an uptrending 5th wave that will likely carry the price back into the 5660s and perhaps signficantly higher.

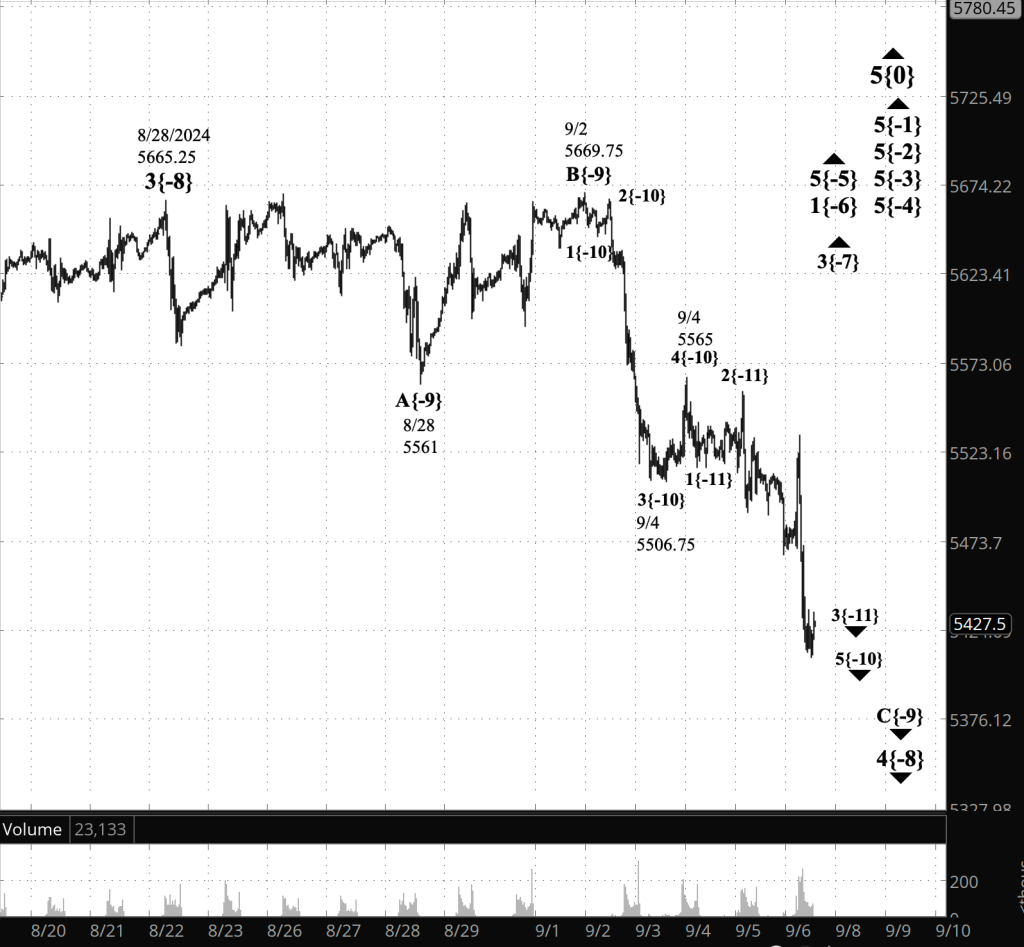
[S&P 500 E-mini futures at 3:30 p.m., 30-minute bars, with volume]

What are the alternatives? There are two, the same as yesterday. The description of each alternative is unchanged from the day before.

Alternative #1:

This alternative is a future possibility, after wave C is complete. Typically, a 4th-wave correction will have three subwaves — A, B and C — and then will be complete. Occasionally a subwave will take a compound form, containing two or three corrective patterns, each composed of three subwaves and connected to the prior pattern by a wave called an X wave. This would delay the start of the following 5th wave uptrend.

Alternative #2:

This alternative has to do with how best to interpret the chart’s position within wave C. It plays off of the fact that the 2nd subwave within C under the Principal Analysis is quite small. It is possible that the decline we’ve seen since September 2 is a degree smaller within the fractal structure of the chart than the principal analysis would have. Under this scenario, wave 1 within wave C is underway. This would delay the end of the 4th-wave downward correction and the start of the ensuing 5th wave uptrend.

What does Elliott wave theory say? Here are the waves that underly the analyses.

Principal Analysis:

  • Rising wave 5{0} is underway. It is a wave of Intermediate degree that began in December 2018.
  • It is in its final subwave, wave 5{-1}.
  • Within wave 5{-1}, rising waves 5{-2}, 5{-3} and 5{-4} are underway, as is wave 5{-5}.
  • Wave 5{-5} is in its initial subwave, wave 1{-6}, which in turn is in its middle subwave, wave 3{-7}.
  • Wave 3{-7} is in its next-to-the-last subwave, wave 4{-8}, a downward correction.
  • Wave 4{-8} is in its final subwave, wave C{-9}, which is within wave 3{-10}.
  • Wave 3{-10} is in its final subwave, wave 4{-11}.

Alternative Analysis #1, compound correction scenario:

  • Wave 4{-8} is in its final subwave, wave C{-9}, which is in its middle subwave, wave 3{-10}.
  • Wave 5{-10}, still in the future, will be the end of wave C{-9} but not of the wave 4{-8} downward correction, which under this scenario will take a compound form containing two or three corrective patterns.
  • The present wave C{-9} will be followed by a rising connector wave X{-9} and then a declining wave A{-9}, the first wave of the second corrective pattern.

Alternative Analysis #2, wave 1 scenario:

  • Wave 4{-8} is in its final subwave, wave C{-9}, which is in its initial subwave wave 1{-10}, which in turn is in its final subwave, wave 3{-11}. And wave 3{-11} is in its final subwave, wave 5{-12}.

Reading the chart. Price movements — waves – – in Elliott wave analysis are labeled with numbers within trending waves and letters with corrective waves. The subscripts — numbers in curly brackets — designate the wave’s degree, which, in Elliott wave analysis, means the relative position of a wave within the larger and smaller structures that make up the chart. R.N. Elliott, who in the 1930s developed the form of analysis that bears his name, viewed the chart as a complex structure of smaller waves nested within larger waves, which in turn are nested within still larger waves. In mathematics it’s called a fractal structure, where at every scale the pattern is similar to the others.

Learning and other resources. Elliott wave analysis provides context, not prophecy. As the 20th century semanticist Alfred Korzybski put it in his book Science and Sanity (1933), “The map is not the territory … The only usefulness of a map depends on similarity of structure between the empirical world and the map.” And I would add, in the ever-changing markets, we can judge that similarity of structure only after the fact.

See the menu page Analytical Methods for a rundown on where to go for information on Elliott wave analysis.

By Tim Bovee, Portland, Oregon, September 6, 2024

Disclaimer

Tim Bovee, Private Trader tracks the analysis and trades of a private trader for his own accounts. Nothing in this blog constitutes a recommendation to buy or sell stocks, options or any other financial instrument. The only purpose of this blog is to provide education and entertainment.

No trader is ever 100 percent successful in his or her trades. Trading in the stock and option markets is risky and uncertain. Each trader must make trading decisions for his or her own account, and take responsibility for the consequences.

License
Creative Commons License

All content on Tim Bovee, Private Trader by Timothy K. Bovee is licensed under a Creative Commons Attribution-ShareAlike 4.0 International License.

Based on a work at www.timbovee.com.

Trader’s Notebook

3:30 p.m. New York time

Half an hour before the closing bell. The S&P 500 futures swung slightly higher into the 5550s and then slightly lower into 5490s during the session, retracing some of the decline as the closing bell approached.

This morning’s principal analysis remains unchanged. The 4th wave downward correction that began on August 28 remains unchanged and has been in its final subwave, wave C, since September 2. Wave Cis in its next-to-the-last subwave, a smaller 4th-wave upward correction, which began on September 3.

9:35 a.m. New York time

What’s happening now? The S&P 500 E-mini futures fluctuated between the 5540s and the 5510s overnight.

What does it mean? Elliott Wave Theory sees the pause that began on September 3 as the next-to-the-last subwave — wave 4 — within the final subwave — wave C — within the larger 4th-wave downward correction that began on August 28.

If the larger 4th-wave correction is typical, the the correction is working through its endgame and will soon be over. It will be followed by a 5th-wave uptrend that is likely to carry the price back into the 5660s at a minimum, and perhaps much higher.

Since there is no guarantee that the larger 4th wave will be typical, there are alternatives. None of the alternatives question the basic pattern that lies ahead –end of the downward correction and beginning of an uptrend — but only the timing of the decline’s end and the beginning of the following rise.

[S&P 500 E-mini futures at 3:30 p.m., 90-minute bars, with volume]

What are the alternatives? There are two.

Alternative #1:

This alternative is a future possibility, after wave C is complete. Typically, a 4th-wave correction will have three subwaves — A, B and C — and then will be complete. Occasionally a subwave will take a compound form, containing two or three corrective patterns, each composed of three subwaves and connected to the prior pattern by a wave called an X wave. This would delay the start of the following 5th wave uptrend.

Alternative #2:

This alternative has to do with how best to interpret the chart’s position within wave C. It plays off of the fact that the 2nd subwave within C under the Principal Analysis is quite small. It is possible that the decline we’ve seen since September 2 is a degree smaller within the fractal structure of the chart than the principal analysis would have. Under this scenario, wave 1 within wave C is underway. This would delay the end of the 4th-wave downward correction and the start of the ensuing 5th wave uptrend.

What does Elliott wave theory say? Here are the waves that underly the analyses.

Principal Analysis:

  • Rising wave 5{0} is underway. It is a wave of Intermediate degree that began in December 2018.
  • It is in its final subwave, wave 5{-1}.
  • Within wave 5{-1}, rising waves 5{-2}, 5{-3} and 5{-4} are underway, as is wave 5{-5}.
  • Wave 5{-5} is in its initial subwave, wave 1{-6}, which in turn is in its middle subwave, wave 3{-7}.
  • Wave 3{-7} is in its next-to-the-last subwave, wave 4{-8}, a downward correction.
  • Wave 4{-8} is in its final subwave, wave C{-9}, which is within wave 4{-10}.
  • Wave 5{-8} will follow the end of the present wave C{-9}.

Alternative Analysis #1, compound correction scenario:

  • Wave 4{-8} is in its final subwave, wave C{-9}, which is in its next-to-the-last subwave, wave 4{-10}.
  • Wave 5{-10 will be the end of wave C{-9} but not of the wave 4{-8} downward correction, which under this senario will take a compound form containing two or three corrective patterns.
  • The present wave C{-9} will be followed by a rising connector wave X{-9} and then a declining wave A{-9}, the first wave of the second corrective pattern.

Alternative Analysis #1, wave 1 scenario:

  • Wave 4{-8} is in its final subwave, wave C{-9}, which is in its initial subwave wave 1{-10}, which in turn is in its next-to-the-last subwave, wave 4{-11}.

Reading the chart. Price movements — waves – – in Elliott wave analysis are labeled with numbers within trending waves and letters with corrective waves. The subscripts — numbers in curly brackets — designate the wave’s degree, which, in Elliott wave analysis, means the relative position of a wave within the larger and smaller structures that make up the chart. R.N. Elliott, who in the 1930s developed the form of analysis that bears his name, viewed the chart as a complex structure of smaller waves nested within larger waves, which in turn are nested within still larger waves. In mathematics it’s called a fractal structure, where at every scale the pattern is similar to the others.

Learning and other resources. Elliott wave analysis provides context, not prophecy. As the 20th century semanticist Alfred Korzybski put it in his book Science and Sanity (1933), “The map is not the territory … The only usefulness of a map depends on similarity of structure between the empirical world and the map.” And I would add, in the ever-changing markets, we can judge that similarity of structure only after the fact.

See the menu page Analytical Methods for a rundown on where to go for information on Elliott wave analysis.

By Tim Bovee, Portland, Oregon, September 5, 2024

Disclaimer

Tim Bovee, Private Trader tracks the analysis and trades of a private trader for his own accounts. Nothing in this blog constitutes a recommendation to buy or sell stocks, options or any other financial instrument. The only purpose of this blog is to provide education and entertainment.

No trader is ever 100 percent successful in his or her trades. Trading in the stock and option markets is risky and uncertain. Each trader must make trading decisions for his or her own account, and take responsibility for the consequences.

License
Creative Commons License

All content on Tim Bovee, Private Trader by Timothy K. Bovee is licensed under a Creative Commons Attribution-ShareAlike 4.0 International License.

Based on a work at www.timbovee.com.

Trader’s Notebook

3:30 p.m. New York time

Half an hour before the closing bell. The S&P 500 futures rose into the 5560s during the session and then fell back, so far reaching into the 5510s.

Elliott Wave Theory: The last leg — wave C — within the 4th-wave downward correction that began on August 28 continues, working its way through the 4th of five subwaves.

9:35 a.m. New York time

What’s happening now? The S&P 500 E-mini futures fell slightly overnight, coming close to 5500, and then rose slightly.

What does it mean? The pattern, analyzed using Elliott Wave Theory, appears to be an upward 4th wave correction within wave C, the final subwave of the larger 4th-wave downward correction that began on August 28.

The correction within wave C will be followed by a downtrending 5th-wave that will finish wave C and most likely will also be the end of the parent wave, the larger 4th-wave downward correction.

An uptrending 5th wave will follow, the final subwave within an uptrending 3rd wave that began on August 7.

[S&P 500 E-mini futures at 3:30 p.m., 90-minute bars, with volume]

What are the alternatives? An alternative remains as a future possibility, after wave C is complete. Typically, a 4th-wave correction will have three subwaves — A, B and C — and then will be complete. Occasionally a subwave will take a compound form, containing two or three corrective patterns, each composed of three subwaves and connected to the prior pattern by a wave called an X wave.

What does Elliott wave theory say? Here are the waves that underly the analyses.

Principal Analysis:

  • Rising wave 5{0} is underway. It is a wave of Intermediate degree that began in December 2018.
  • It is in its final subwave, wave 5{-1}.
  • Within wave 5{-1}, rising waves 5{-2}, 5{-3} and 5{-4} are underway, as is wave 5{-5}.
  • Wave 5{-5} is in its initial subwave, wave 1{-6}, which in turn is in its middle subwave, wave 3{-7}.
  • Wave 3{-7} is in its next-to-the-last subwave, wave 4{-8}, a downward correction.
  • Wave 4{-8} is in its final subwave, wave C{-9}.

Reading the chart. Price movements — waves – – in Elliott wave analysis are labeled with numbers within trending waves and letters with corrective waves. The subscripts — numbers in curly brackets — designate the wave’s degree, which, in Elliott wave analysis, means the relative position of a wave within the larger and smaller structures that make up the chart. R.N. Elliott, who in the 1930s developed the form of analysis that bears his name, viewed the chart as a complex structure of smaller waves nested within larger waves, which in turn are nested within still larger waves. In mathematics it’s called a fractal structure, where at every scale the pattern is similar to the others.

Learning and other resources. Elliott wave analysis provides context, not prophecy. As the 20th century semanticist Alfred Korzybski put it in his book Science and Sanity (1933), “The map is not the territory … The only usefulness of a map depends on similarity of structure between the empirical world and the map.” And I would add, in the ever-changing markets, we can judge that similarity of structure only after the fact.

See the menu page Analytical Methods for a rundown on where to go for information on Elliott wave analysis.

By Tim Bovee, Portland, Oregon, September 4, 2024

Disclaimer

Tim Bovee, Private Trader tracks the analysis and trades of a private trader for his own accounts. Nothing in this blog constitutes a recommendation to buy or sell stocks, options or any other financial instrument. The only purpose of this blog is to provide education and entertainment.

No trader is ever 100 percent successful in his or her trades. Trading in the stock and option markets is risky and uncertain. Each trader must make trading decisions for his or her own account, and take responsibility for the consequences.

License
Creative Commons License

All content on Tim Bovee, Private Trader by Timothy K. Bovee is licensed under a Creative Commons Attribution-ShareAlike 4.0 International License.

Based on a work at www.timbovee.com.

Trader’s Notebook

3:30 p.m. New York time

Half an hour before the closing bell. The S&P 500 futures fell sharply during the session, from the 5660s, so far reaching the 5540s. Elliott Wave Theory: The decline confirms this mornings principal analysis: The 4th-wave downward correction that began on August 28 has entered its end game. It is in its final subwave, wave C.

Wave C will have five subwaves and may be in its 3rd subwave, although the power of the fall makes the pattern somewhat unclear.

When wave C is complete, the parent wave 4 will also be complete, and a 5th-wave uptrend will begin.

9:35 a.m. New York time

What’s happening now? The S&P 500 E-mini futures began at a high, 5669.75, when trading resumed overnight and then fell into the 5620s.

What does it mean? The higher high brought clarity to the Elliott Wave Theory analysis of the internal structure of the 4th-wave downward correction that began on August 22.

Under the new analysis, the August 28 low that had been labeled as the end of the B wave within the correction is now labeled the end of wave A, the higher high is the end of wave B, and the decline now underway is the final subwave, wave C, if the correction is typical.

[S&P 500 E-mini futures at 3:30 p.m., 90-minute bars, with volume]

What are the alternatives?

Alternative Analysis #1:

If the price reverses and reaches a still higher high, then wave B is still underway and wave C has not yet begun.

Alternative Analysis #2:

The alternative lies in the future, after wave C is complete. Typically, a 4th-wave correction will have three subwaves — A, B and C — and then will be complete. Occasionally a subwave will take a compound form, containing two or three corrective patterns, each composed of three subwaves and connected to the prior pattern by a wave called an X wave.

What does Elliott wave theory say? Here are the waves that underly the analyses.

Principal Analysis:

  • Rising wave 5{0} is underway. It is a wave of Intermediate degree that began in December 2018.
  • It is in its final subwave, wave 5{-1}.
  • Within wave 5{-1}, rising waves 5{-2}, 5{-3} and 5{-4} are underway, as is wave 5{-5}.
  • Wave 5{-5} is in its initial subwave, wave 1{-6}, which in turn is in its middle subwave, wave 3{-7}.
  • Wave 3{-7} is in its next-to-the-last subwave, wave 4{-8}, a downward correction.
  • Wave 4{-8} is in its final subwave, wave C{-9}.

Alternative Analysis #1:

  • Wave 4{-8} is in its middle subwave, wave B{-9}.

Alternative Analysis #2:

  • Wave C{-9} is part of a the first corrective pattern within a compound correction and will be followed by wave X{-9}.

Reading the chart. Price movements — waves – – in Elliott wave analysis are labeled with numbers within trending waves and letters with corrective waves. The subscripts — numbers in curly brackets — designate the wave’s degree, which, in Elliott wave analysis, means the relative position of a wave within the larger and smaller structures that make up the chart. R.N. Elliott, who in the 1930s developed the form of analysis that bears his name, viewed the chart as a complex structure of smaller waves nested within larger waves, which in turn are nested within still larger waves. In mathematics it’s called a fractal structure, where at every scale the pattern is similar to the others.

Learning and other resources. Elliott wave analysis provides context, not prophecy. As the 20th century semanticist Alfred Korzybski put it in his book Science and Sanity (1933), “The map is not the territory … The only usefulness of a map depends on similarity of structure between the empirical world and the map.” And I would add, in the ever-changing markets, we can judge that similarity of structure only after the fact.

See the menu page Analytical Methods for a rundown on where to go for information on Elliott wave analysis.

By Tim Bovee, Portland, Oregon, September 3, 2024

Disclaimer

Tim Bovee, Private Trader tracks the analysis and trades of a private trader for his own accounts. Nothing in this blog constitutes a recommendation to buy or sell stocks, options or any other financial instrument. The only purpose of this blog is to provide education and entertainment.

No trader is ever 100 percent successful in his or her trades. Trading in the stock and option markets is risky and uncertain. Each trader must make trading decisions for his or her own account, and take responsibility for the consequences.

License
Creative Commons License

All content on Tim Bovee, Private Trader by Timothy K. Bovee is licensed under a Creative Commons Attribution-ShareAlike 4.0 International License.

Based on a work at www.timbovee.com.

Trader’s Notebook

Market holiday. U.S. markets will be closed on Monday for the Labor Day holiday, the traditional end of the summer vacation season. The S&P 500 futures will resume trading overnight and Tuesday’s markets will follow their normal schedules.

3:30 p.m. New York time

Half an hour before the closing bell. The S&P 500 futures traded net-sideways during the session, remaining between the 5640s and the 5590s. Elliott Wave Theory: The 4th-wave downward correction continues to work through what is most likely its endgame, assuming a typical pattern rather than one of the less common varieties.

Several economic eports that sometimes move markets will be released after trading resumes next week: Job openings, Factory Orders and the Federal Reserve’s Beige Book on Wednesday. On Thursday, the ADP sneak peak at the government’s jobs report. And the big one on Friday, the Employment Situation report, with the government’s employment and unemployment figures, key to the Federal Open Market Committee’s rate-setting next month, and also the Sahm Rule, an early-warning system that signaled the start of recession last month, prompting much skepticism among economists.

9:35 a.m. New York time

What’s happening now? The S&P 500 E-mini futures rose overnight, from slightly below 5610 into the 5630s.

What does it mean? Elliott Wave Theory sees the rise as a counter-trend move within the final subwave — falling wave 5 — within the larger final subwave — falling wave C — within the low-degree 4th wave downward corrective pattern that began on August 22.

When wave 5 is complete, it will also be the end of the larger wave C and, if the correction is typical, the still larger wave 4. See the “What happens next?” section  Tuesday, August 27 Trader’s Notebook for a description of ways the correction could extend in a compound form containing multiple corrective patterns.

The 4th-wave downward correction will be followed by a 5th-wave uptrend that will, if typical, carry the price into the 5670s and beyond.

[S&P 500 E-mini futures at 3:30 p.m., 80-minute bars, with volume]

What are the alternatives? None at present. Without a doubt, new alternatives will develop.

What does Elliott wave theory say? Here are the waves that underly the analyses.

Principal Analysis:

  • Rising wave 5{0} is underway. It is a wave of Intermediate degree that began in December 2018.
  • It is in its final subwave, wave 5{-1}.
  • Within wave 5{-1}, rising waves 5{-2}, 5{-3} and 5{-4} are underway, as is wave 5{-5}.
  • Wave 5{-5} is in its initial subwave, wave 1{-6}, which in turn is in its middle subwave, wave 3{-7}.
  • Wave 3{-7} is in its next-to-the-last subwave, wave 4{-8}, a downward correction.
  • Wave 4{-8} is in its final subwave, wave C{-9}.

Reading the chart. Price movements — waves – – in Elliott wave analysis are labeled with numbers within trending waves and letters with corrective waves. The subscripts — numbers in curly brackets — designate the wave’s degree, which, in Elliott wave analysis, means the relative position of a wave within the larger and smaller structures that make up the chart. R.N. Elliott, who in the 1930s developed the form of analysis that bears his name, viewed the chart as a complex structure of smaller waves nested within larger waves, which in turn are nested within still larger waves. In mathematics it’s called a fractal structure, where at every scale the pattern is similar to the others.

Learning and other resources. Elliott wave analysis provides context, not prophecy. As the 20th century semanticist Alfred Korzybski put it in his book Science and Sanity (1933), “The map is not the territory … The only usefulness of a map depends on similarity of structure between the empirical world and the map.” And I would add, in the ever-changing markets, we can judge that similarity of structure only after the fact.

See the menu page Analytical Methods for a rundown on where to go for information on Elliott wave analysis.

By Tim Bovee, Portland, Oregon, August 30, 2024

Disclaimer

Tim Bovee, Private Trader tracks the analysis and trades of a private trader for his own accounts. Nothing in this blog constitutes a recommendation to buy or sell stocks, options or any other financial instrument. The only purpose of this blog is to provide education and entertainment.

No trader is ever 100 percent successful in his or her trades. Trading in the stock and option markets is risky and uncertain. Each trader must make trading decisions for his or her own account, and take responsibility for the consequences.

License
Creative Commons License

All content on Tim Bovee, Private Trader by Timothy K. Bovee is licensed under a Creative Commons Attribution-ShareAlike 4.0 International License.

Based on a work at www.timbovee.com.

Trader’s Notebook

3:30 p.m. New York time

Half an hour before the closng bell. The S&P 500 futures rose to 5663.75 during the session, and then fell sharply back into the 5990s.

Applying Elliott Wave Theory, the pattern matches the principal analysis laid out this morning: The prior rise was the 4th subwave within wave C, which in turn is the final subwave of the 4th-wave downward correction that began on August 22.

The session high fell short by a few points of the start of wave C, from 5669. Under the principal analysis, the subsequent decline is the 5th and final subwave within wave C.

What happens next? 

This section is lifted verbatim from Tuesday, August 27 Trader’s Notebook.

There are two possibilities after wave C is complete, and possibilities within each possibility.

The 5th-wave uptrend will follow the end of the compound 4th-wave correction.

Most of the time, wave C is the end of the correction. In this case, the correction — wave 4 — will be followed by an uptrending 5th waves that, if typical, will move into the 5660s, beyond the beginning of wave 4, and possibly higher.

Some 5th waves are truncated and fail to reach the starting point of the preceding 4th wave.

Some 5th waves are extended and move much further beyond the beginning of the 4th wave, traveling a greater distance than proportionality suggested by the context of the wave.

Some corrective waves, especially 4th waves, form a compound structure, containing two or three A-B-C wave patterns. If that were to occur, then the present declining C wave within wave 4 would be followed by a rising X wave and then by another declining A wave, which will be followed by waves B and C. If the compound structure takes a triple form, there will be a second X wave, followed by a third A-B-C pattern.

And there’s an alternative. It’s possible to fit the session’s rise and decline pattern into this morning’s alternative analysis, which sees yesterday’s low, 5661.25, as being the end of wave C. If that’s the case, then wave 5, one degree larger, has begun. The rise that ended during the session is the 1st subwave within wave 5, and the decline now underway is the 2nd subwave.

This scenario will be disproven if the present decline falls below 5561.25, the start of the initial subwave — wave 1 — since it is a firm rule of Elliott Wave Theory that wave 2 never moves beyond the start of wave 1.

Charts. I’ve udpated the the lower, broader-view chart. The upper, close-up chart is unchanged.

9:35 a.m. New York time

What’s happening now? The S&P 500 E-mini futures rose overnight, so far reaching into the 5630s as it retraces a portion of yesterday’s session decline.

What does it mean? Elliott Wave Theory sees the decline as the end of the middle subwave — wave 3 — within wave C, which is in turn the final subwave of the low-degree 4th-wave downward correction that began on August 22.

Close-up view. Here’s a close-up view of the downward correction, taken 35 minutes before the opening bell, showing the subwave count to wave C. In three-wave corrections — the pattern most often seen — the C-wave has five subwaves.

The next-to-the-last subwave within wave C — rising wave 4 — is now underway.

[S&P 500 E-mini futures at 8:55 a.m., 15-minute bars, with volume]

A broader view. The 4th-wave correction is the next-to-the-last subwave within a 3rd-wave uptrend that began on August 7. Encompassing that uptrend is a larger uptrend, the 1st wave within a larger 5th-wave uptrend that began on August 5.

[S&P 500 E-mini futures at 3:30 p.m., 80-minute bars, with volume]

What are the alternatives? If I squint my eyes at the chart, I can see yesterday’s session low, 5561.25, as being the end of the 5th and final wave within wave C. Should the price rise above the 5669, the end of the middle subwave, wave B, within the 4th-wave downward correction, then this scenario becomes more likely.

What does Elliott wave theory say? Here are the waves that underly the analyses.

Principal Analysis:

  • Rising wave 5{0} is underway. It is a wave of Intermediate degree that began in December 2018.
  • It is in its final subwave, wave 5{-1}.
  • Within wave 5{-1}, rising waves 5{-2}, 5{-3} and 5{-4} are underway, as is wave 5{-5}.
  • Wave 5{-5} is in its initial subwave, wave 1{-6}, which in turn is in its middle subwave, wave 3{-7}.
  • Wave 3{-7} is in its next-to-the-last subwave, wave 4{-8}, a downward correction.
  • Wave 4{-8} is in its final subwave, wave C{-9}.

Reading the chart. Price movements — waves – – in Elliott wave analysis are labeled with numbers within trending waves and letters with corrective waves. The subscripts — numbers in curly brackets — designate the wave’s degree, which, in Elliott wave analysis, means the relative position of a wave within the larger and smaller structures that make up the chart. R.N. Elliott, who in the 1930s developed the form of analysis that bears his name, viewed the chart as a complex structure of smaller waves nested within larger waves, which in turn are nested within still larger waves. In mathematics it’s called a fractal structure, where at every scale the pattern is similar to the others.

Learning and other resources. Elliott wave analysis provides context, not prophecy. As the 20th century semanticist Alfred Korzybski put it in his book Science and Sanity (1933), “The map is not the territory … The only usefulness of a map depends on similarity of structure between the empirical world and the map.” And I would add, in the ever-changing markets, we can judge that similarity of structure only after the fact.

See the menu page Analytical Methods for a rundown on where to go for information on Elliott wave analysis.

By Tim Bovee, Portland, Oregon, August 29, 2024

Disclaimer

Tim Bovee, Private Trader tracks the analysis and trades of a private trader for his own accounts. Nothing in this blog constitutes a recommendation to buy or sell stocks, options or any other financial instrument. The only purpose of this blog is to provide education and entertainment.

No trader is ever 100 percent successful in his or her trades. Trading in the stock and option markets is risky and uncertain. Each trader must make trading decisions for his or her own account, and take responsibility for the consequences.

License
Creative Commons License

All content on Tim Bovee, Private Trader by Timothy K. Bovee is licensed under a Creative Commons Attribution-ShareAlike 4.0 International License.

Based on a work at www.timbovee.com.

Trader’s Notebook

3:30 p.m. New York time

Half an hour before the closing bell. The S&P 500 futures fell into the 5370s during the session and then rose sharply, back into the 5610s so far.

Elliott Wave Theory: The movement is taking place within a C wave, the final subwave within the late-August 4th-wave downward correction. C waves have five subwaves, and although the details are a bit ambiguous, it looks to me as though the decline is the 3rd subwave within wave C.

A very low degree rising 4th subwave will follow, and then a decline, the 5th and final subwave within wave C.

9:35 a.m. New York time

What’s happening now? The S&P 500 E-mini futures rose from the 5630s to the 5650s overnight, pulling back slightly as the opening bell approached.

What does it mean? The overnight fluctuations, in terms of Elliott Wave Theory, were part of the final subwave — wave C — within the 4th-wave downward correction that began on August 22. In yesterday’s Trader’s Notebook, I ran through the possible permutations wave C and its parent, wave 4, might take, and what comes after wave 4 reaches its end, and I refer the reader to that discussion. So far today, nothing in the analysis has changed.

[S&P 500 E-mini futures at 3:30 p.m., 80-minute bars, with volume]

What are the alternatives? None at present, beyond those in yesterday’s discussion of the possibilities. Without a doubt, new ambiguities will develop

What does Elliott wave theory say? Here are the waves that underly the analyses.

Principal Analysis:

  • Rising wave 5{0} is underway. It is a wave of Intermediate degree that began in December 2018.
  • It is in its final subwave, wave 5{-1}.
  • Within wave 5{-1}, rising waves 5{-2}, 5{-3} and 5{-4} are underway, as is wave 5{-5}.
  • Wave 5{-5} is in its initial subwave, wave 1{-6}, which in turn is in its middle subwave, wave 3{-7}.
  • Wave 3{-7} is in its next-to-the-last subwave, wave 4{-8}, a downward correction.
  • Wave 4{-8} is in its final subwave, wave C{-9}.

Reading the chart. Price movements — waves – – in Elliott wave analysis are labeled with numbers within trending waves and letters with corrective waves. The subscripts — numbers in curly brackets — designate the wave’s degree, which, in Elliott wave analysis, means the relative position of a wave within the larger and smaller structures that make up the chart. R.N. Elliott, who in the 1930s developed the form of analysis that bears his name, viewed the chart as a complex structure of smaller waves nested within larger waves, which in turn are nested within still larger waves. In mathematics it’s called a fractal structure, where at every scale the pattern is similar to the others.

Learning and other resources. Elliott wave analysis provides context, not prophecy. As the 20th century semanticist Alfred Korzybski put it in his book Science and Sanity (1933), “The map is not the territory … The only usefulness of a map depends on similarity of structure between the empirical world and the map.” And I would add, in the ever-changing markets, we can judge that similarity of structure only after the fact.

See the menu page Analytical Methods for a rundown on where to go for information on Elliott wave analysis.

By Tim Bovee, Portland, Oregon, August 28, 2024

Disclaimer

Tim Bovee, Private Trader tracks the analysis and trades of a private trader for his own accounts. Nothing in this blog constitutes a recommendation to buy or sell stocks, options or any other financial instrument. The only purpose of this blog is to provide education and entertainment.

No trader is ever 100 percent successful in his or her trades. Trading in the stock and option markets is risky and uncertain. Each trader must make trading decisions for his or her own account, and take responsibility for the consequences.

License
Creative Commons License

All content on Tim Bovee, Private Trader by Timothy K. Bovee is licensed under a Creative Commons Attribution-ShareAlike 4.0 International License.

Based on a work at www.timbovee.com.

Trader’s Notebook

3:30 p.m. New York time

Half an hour before the closing bell. The S&P 500 futures returned to the 5640s during the session. Elliott Wave Theory: The final subwave, wave C, of the 4th wave downward correction that began on August 22 continues.

This morning’s analysis is unchanged.

9:35 a.m. New York time

What’s happening now? The S&P 500 E-mini futures rose into the 5640s overnight and then fell rapidly into the 5610s.

What does it mean? The decline, according to Elliott Wave Theory, is a C wave, the final subwave in the 4th-wave downward correction that began on August 22. Wave C will have five subwaves and presently is tracing through its 3rd subwave.

What happens next? There are two possibilities after wave C is complete, and possibilities within each possibility.

  • Most of the time, wave C is the end of the correction. In this case, the correction — wave 4 — will be followed by an uptrending 5th waves that, if typical, will move into the 5660s, beyond the beginning of wave 4, and possibly higher.
    • Some 5th waves are truncated and fail to reach the starting point of the preceding 4th wave.
    • Some 5th waves are extended and move much further beyond the beginning of the 4th wave, traveling a greater distance than proportionality suggested by the context of the wave.\
  • Some corrective waves, especially 4th waves, form a compound structure, containing two or three A-B-C wave patterns. If that were to occur, then the present declining C wave within wave 4 would be followed by a rising X wave and then by another declining A wave, which will be followed by waves B and C. If the compound structure takes a triple form, there will be a second X wave, followed by a third A-B-C pattern.
    • The 5th-wave uptrend will follow the end of the compound 4th-wave correction.

[S&P 500 E-mini futures at 3:30 p.m., 80-minute bars, with volume]

What are the alternatives? None at present. Without a doubt, they will develop

What does Elliott wave theory say? Here are the waves that underly the analyses.

Principal Analysis:

  • Rising wave 5{0} is underway. It is a wave of Intermediate degree that began in December 2018.
  • It is in its final subwave, wave 5{-1}.
  • Within wave 5{-1}, rising waves 5{-2}, 5{-3} and 5{-4} are underway, as is wave 5{-5}.
  • Wave 5{-5} is in its initial subwave, wave 1{-6}, which in turn is in its middle subwave, wave 3{-7}.
  • Wave 3{-7} is in its next-to-the-last subwave, wave 4{-8}, a downward correction.
  • Wave 4{-8} is in its final subwave, wave C{-9}

Reading the chart. Price movements — waves – – in Elliott wave analysis are labeled with numbers within trending waves and letters with corrective waves. The subscripts — numbers in curly brackets — designate the wave’s degree, which, in Elliott wave analysis, means the relative position of a wave within the larger and smaller structures that make up the chart. R.N. Elliott, who in the 1930s developed the form of analysis that bears his name, viewed the chart as a complex structure of smaller waves nested within larger waves, which in turn are nested within still larger waves. In mathematics it’s called a fractal structure, where at every scale the pattern is similar to the others.

Learning and other resources. Elliott wave analysis provides context, not prophecy. As the 20th century semanticist Alfred Korzybski put it in his book Science and Sanity (1933), “The map is not the territory … The only usefulness of a map depends on similarity of structure between the empirical world and the map.” And I would add, in the ever-changing markets, we can judge that similarity of structure only after the fact.

See the menu page Analytical Methods for a rundown on where to go for information on Elliott wave analysis.

By Tim Bovee, Portland, Oregon, August 27, 2024

Disclaimer

Tim Bovee, Private Trader tracks the analysis and trades of a private trader for his own accounts. Nothing in this blog constitutes a recommendation to buy or sell stocks, options or any other financial instrument. The only purpose of this blog is to provide education and entertainment.

No trader is ever 100 percent successful in his or her trades. Trading in the stock and option markets is risky and uncertain. Each trader must make trading decisions for his or her own account, and take responsibility for the consequences.

License
Creative Commons License

All content on Tim Bovee, Private Trader by Timothy K. Bovee is licensed under a Creative Commons Attribution-ShareAlike 4.0 International License.

Based on a work at www.timbovee.com.

Trader’s Notebook

3:30 p.m. New York time

Half an hour before the closing bell. The S&P 500 futures broke a firm rule of Elliott Wave Theory, as discussed in this morning’s analysis. The 4th-wave downward correction continues.

At the start of the session, the correction was in its middle subwave, wave B.

A few days ago I had identified the 4th wave as taking the form of a Zigzag, and the rule for that form is that a B wave cannot move beyond the start of the preceding A wave. During the session the S&P 500 futures attained a high of 5669, which 3.75 points higher than the starting point of wave A. Time for a reanalysis.

Wave B breaks a rule.

In analyses last week I referred to the ambiguity of the wave A count. If it’s a Zigzag correction, the A wave will have five subwaves; if a Flat, three subwaves.

I counted five subwaves on the futures chart this morning, making the correction a Zigzag. The simplest reanalysis, and therefore the most likely, is to revisit the nature of the correction. A Flat correction has three subwaves in wave A, and the firm rule for a B wave within a Flat is that it must retrace at least 90% of the A wave, with no upper limit specified.

A closer look at the futures chart didn’t clarify the matter, but the S&P 500 index chart can be read as having three subwaves within wave A, although that chart also has some ambiguities.

Ultimately, the Index is the source of all of its derivatives, including the futures, and I give it greater weight in resolving a rule violation.

New Principal Analysis

The downward correction that began on August 22 continues and is taking the form of a Flat. Wave B within wave 4 ended during the August 26 session at 5669, and the subsequent decline is the early stages of wave C.

Chart of the New Analysis

[S&P 500 E-mini futures at 3:30 p.m., 70-minute bars, with volume]

9:35 a.m. New York time

The analysis below was discredited during the session by an Elliott Wave Theory rule violation. See the afternoon update, above, for the new analysis.

What’s happening now? The S&P 500 E-mini futures rose into the 5660s after trading resumed overnight.

What does it mean? Elliott Wave Theory sees the 4th-wave downward correction that began on August 22 being in its middle subwave, wave B.

There is, however, a looming problem for the analysis. The A wave preceding the current wave B had five subwaves. That means that the correction is taking the Zigzag form. A firm rule of Elliott Wave Theory says that the B wave in a Zigzag never moves beyond the starting point of the preceding wave A.

In this case, wave A ended at 5665.25. Wave B overnight reached a high of 5664.50. That means wave B is $1 away from from violating the rule, which would invalidate the present analysis.

In theory the rule is violated if the price reaches 5665.26, but the futures move in 25-cent increments, so rather than the price being 76 points away from moving beyond the overnight high, it would take a $1 rise.

Chart of the Discredited Analysis

[S&P 500 E-mini futures at 9:35 a.m., 70-minute bars, with volume]

What are the alternatives? None at present. Without a doubt, they will develop

What does Elliott wave theory say? Here are the waves that underly the afternoon analyses. The morning analysis was invalidated by a violation of an Elliott Wave Theory rule.

Principal Analysis:

  • Rising wave 5{0} is underway. It is a wave of Intermediate degree that began in December 2018.
  • It is in its final subwave, wave 5{-1}.
  • Within wave 5{-1}, rising waves 5{-2}, 5{-3} and 5{-4} are underway, as is wave 5{-5}.
  • Wave 5{-5} is in its initial subwave, wave 1{-6}, which in turn is in its middle subwave, wave 3{-7}.
  • Wave 3{-7} is in its next-to-the-last subwave, wave 4{-8}, a downward correction.
  • Wave 4{-8} is in its final subwave, wave C{-9}

Reading the chart. Price movements — waves – – in Elliott wave analysis are labeled with numbers within trending waves and letters with corrective waves. The subscripts — numbers in curly brackets — designate the wave’s degree, which, in Elliott wave analysis, means the relative position of a wave within the larger and smaller structures that make up the chart. R.N. Elliott, who in the 1930s developed the form of analysis that bears his name, viewed the chart as a complex structure of smaller waves nested within larger waves, which in turn are nested within still larger waves. In mathematics it’s called a fractal structure, where at every scale the pattern is similar to the others.

Learning and other resources. Elliott wave analysis provides context, not prophecy. As the 20th century semanticist Alfred Korzybski put it in his book Science and Sanity (1933), “The map is not the territory … The only usefulness of a map depends on similarity of structure between the empirical world and the map.” And I would add, in the ever-changing markets, we can judge that similarity of structure only after the fact.

See the menu page Analytical Methods for a rundown on where to go for information on Elliott wave analysis.

By Tim Bovee, Portland, Oregon, August 26, 2024

Disclaimer

Tim Bovee, Private Trader tracks the analysis and trades of a private trader for his own accounts. Nothing in this blog constitutes a recommendation to buy or sell stocks, options or any other financial instrument. The only purpose of this blog is to provide education and entertainment.

No trader is ever 100 percent successful in his or her trades. Trading in the stock and option markets is risky and uncertain. Each trader must make trading decisions for his or her own account, and take responsibility for the consequences.

License
Creative Commons License

All content on Tim Bovee, Private Trader by Timothy K. Bovee is licensed under a Creative Commons Attribution-ShareAlike 4.0 International License.

Based on a work at www.timbovee.com.

Trader’s Notebook

3:30 p.m. New York time

Half an hour before the closing bell. The S&P 500 futures whipsawed wildly after Fed Chair Jerome Powell spoke at the Federal Reserve’s Jackson Hole, Wyo. Economic Symposium, ending up in the 5630s, close to where the price stood before the speech.

Elliott Wave Analysis: The decline from the August 22 high, the end of a 3rd-wave uptrend and the beginning of the low-degree 4th-wave downward correction now underway, was wave A within that correction. The rise prior to Powell’s speech was wave B, and the decline from today’s high, after Powell began speaking, is wave C, which is now underway. The 4th wave downward correction is in its final wave, unless it takes a complex form, with a second and perhaps a third 3-wave pattern.

9:35 a.m. New York time

What’s happening now? The S&P 500 E-mini futures rose steadily overnight, from the 5590s to the 5630s.

What does it mean? The likeliest interpretation, using Elliott Wave Theory, is that the rise is the middle subwave — wave B — within a low-degree 4th-wave downward correction that began on August 22. A final, declining subwave — wave C — will follow that, when complete, will end the correction and begin an rising 5th wave, one degree higher, the final wave of an uptrend that began on August 7.

That 5th wave is a subwave of a larger uptrending 3rd wave, which in turn is a subwave of a still larger uptrending 1st wave, the initial subwave of 5th-wave uptrend that began on August 5 and that, if typical, will carry the price above the end of the preceding 3rd wave, 5721.50, and perhaps significantly above that level.

[S&P 500 E-mini futures at 3:30 p.m., 70-minute bars, with volume]

What are the alternatives? It’s possible that the overnight decline was the 4th-wave correction in its entirety and that the low-degree 5th-wave uptrend has begun.

What does Elliott wave theory say? Here are the waves that underly the analyses.

Principal Analysis:

  • Rising wave 5{0} is underway. It is a wave of Intermediate degree that began in December 2018.
  • It is in its final subwave, wave 5{-1}.
  • Within wave 5{-1}, rising waves 5{-2}, 5{-3} and 5{-4} are underway, as is wave 5{-5}.
  • Wave 5{-5} is in its initial subwave, wave 1{-6}, which in turn is in its middle subwave, wave 3{-7}.
  • Wave 3{-7} appears to be in its next-to-the-last subwave, wave 4{-8}, a downward correction.

Reading the chart. Price movements — waves – – in Elliott wave analysis are labeled with numbers within trending waves and letters with corrective waves. The subscripts — numbers in curly brackets — designate the wave’s degree, which, in Elliott wave analysis, means the relative position of a wave within the larger and smaller structures that make up the chart. R.N. Elliott, who in the 1930s developed the form of analysis that bears his name, viewed the chart as a complex structure of smaller waves nested within larger waves, which in turn are nested within still larger waves. In mathematics it’s called a fractal structure, where at every scale the pattern is similar to the others.

Learning and other resources. Elliott wave analysis provides context, not prophecy. As the 20th century semanticist Alfred Korzybski put it in his book Science and Sanity (1933), “The map is not the territory … The only usefulness of a map depends on similarity of structure between the empirical world and the map.” And I would add, in the ever-changing markets, we can judge that similarity of structure only after the fact.

See the menu page Analytical Methods for a rundown on where to go for information on Elliott wave analysis.

By Tim Bovee, Portland, Oregon, August 23, 2024

Disclaimer

Tim Bovee, Private Trader tracks the analysis and trades of a private trader for his own accounts. Nothing in this blog constitutes a recommendation to buy or sell stocks, options or any other financial instrument. The only purpose of this blog is to provide education and entertainment.

No trader is ever 100 percent successful in his or her trades. Trading in the stock and option markets is risky and uncertain. Each trader must make trading decisions for his or her own account, and take responsibility for the consequences.

License
Creative Commons License

All content on Tim Bovee, Private Trader by Timothy K. Bovee is licensed under a Creative Commons Attribution-ShareAlike 4.0 International License.

Based on a work at www.timbovee.com.