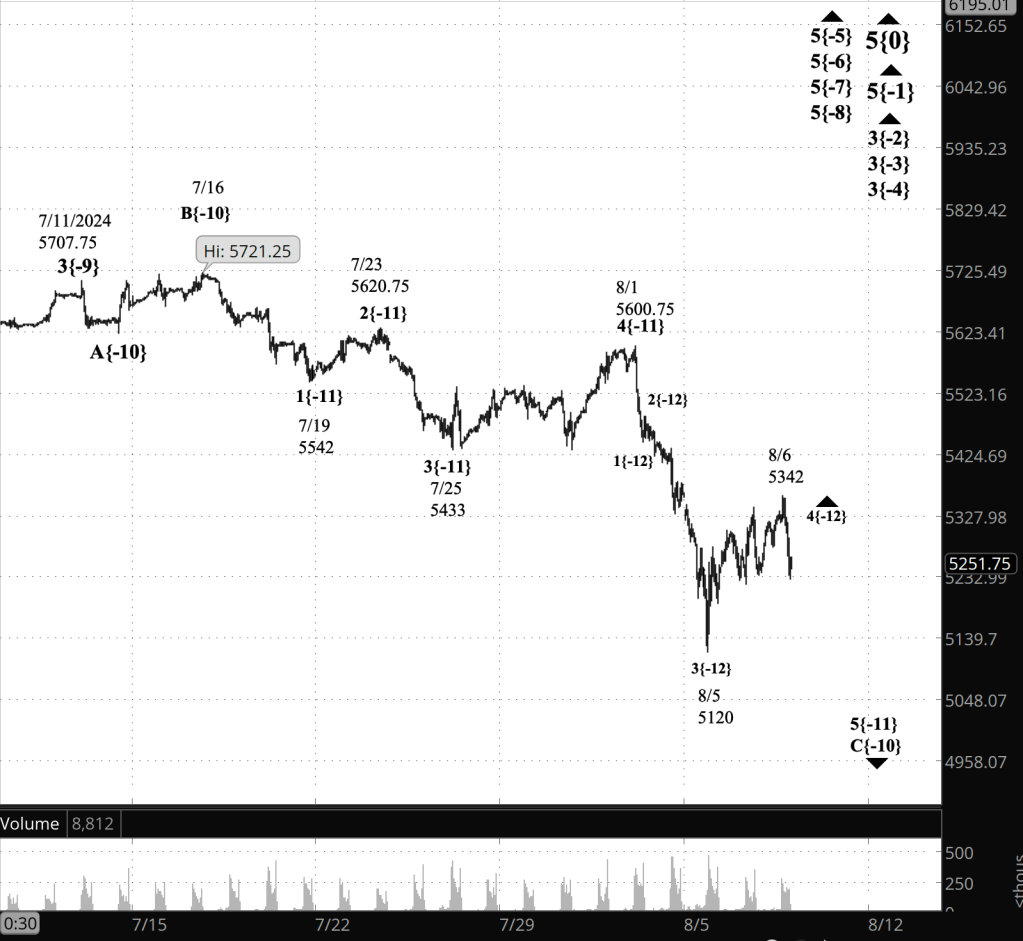
3:30 p.m. New York time
Half an hour before the closing bell. The S&P 500 futures rose during the session, reaching into the 5350s.
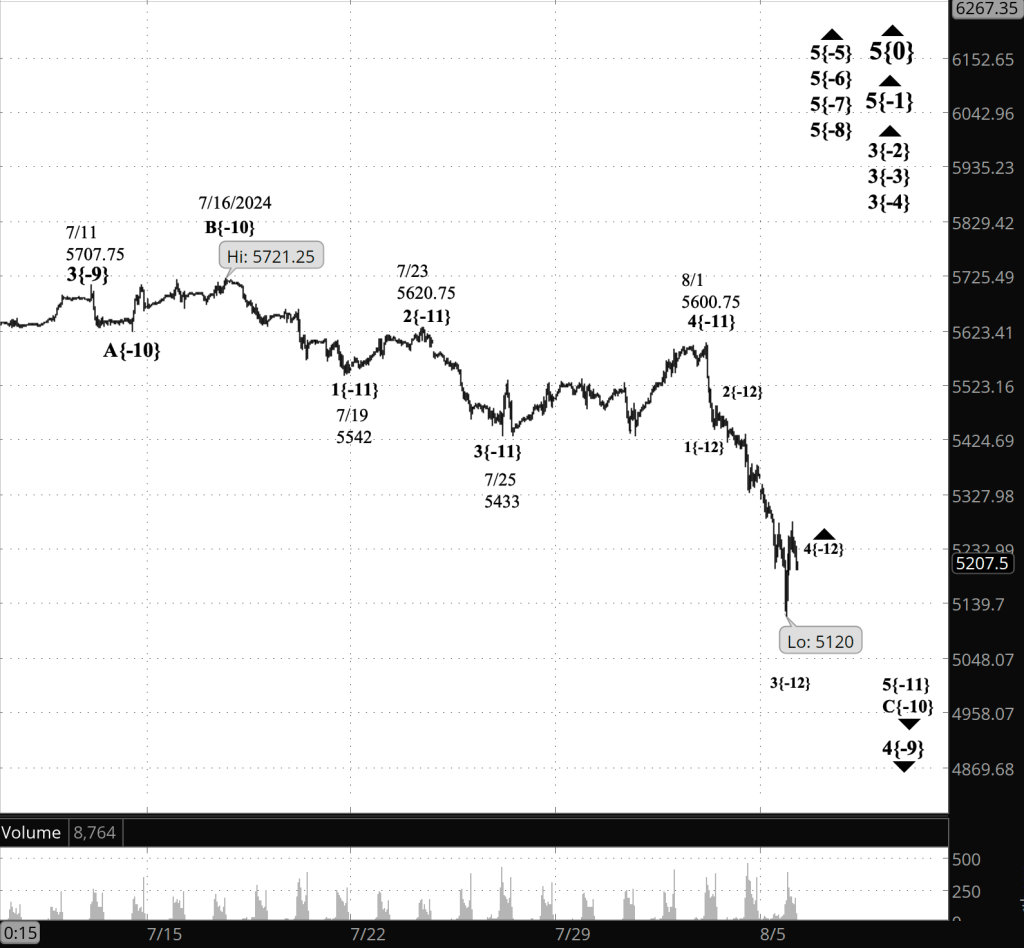
Elliott Wave Theory. The rise carried the price above the starting point of wave A, a subwave of the low-degree 4th-wave upward correction that began on August 5.
That’s persuasive enough to trigger this morning’s alternative analysis: Declining wave B within the upward correction ended on August 7 at 5182, and rising wave C is now underway. The C-wave will have five subwaves.
9:35 a.m. New York time
What’s happening now? The S&P 500 E-mini traded in a narrow range overnight, spiking up into the 5270s when the Initial Jobless Claims weekly statistics were published an hour before the opening bell.
What does it mean? The take-away from all the Elliott Wave Theory detail that follows is that the S&P 500 and its related products have been declining in a correction since mid-July. The complex structure of waves it contains show us that the correction, wave 4, is working through its end game and will soon reach its end.
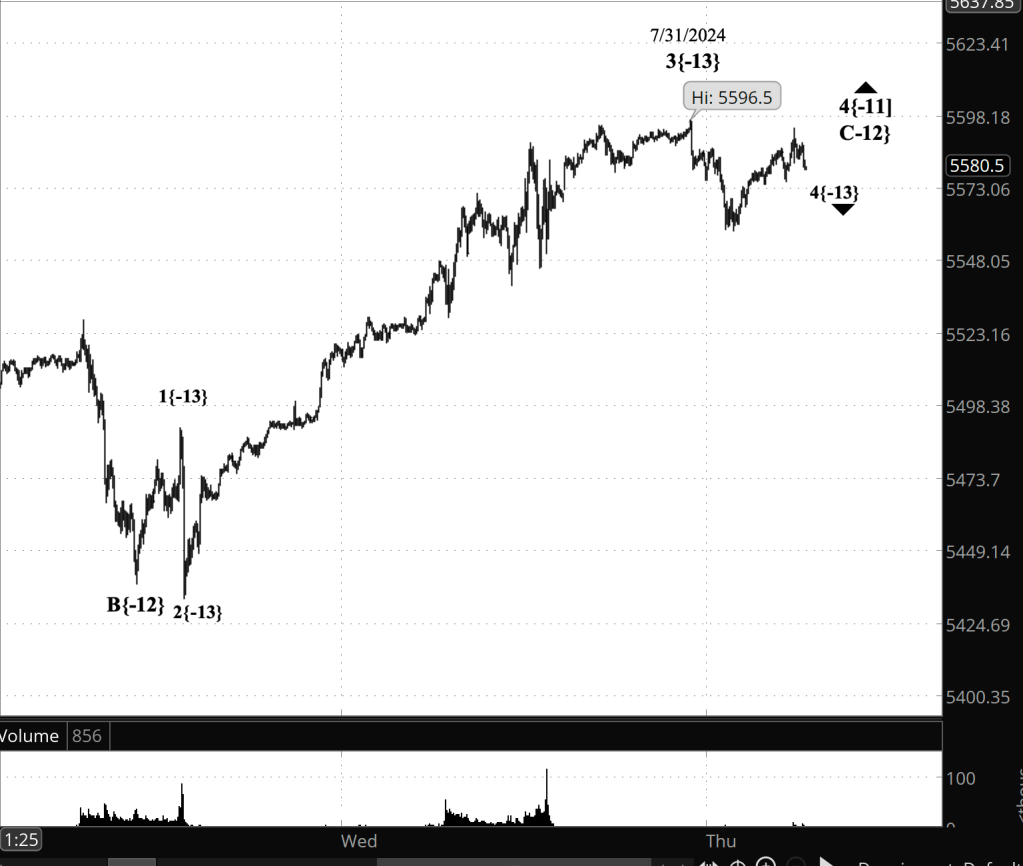
A complex strucuture. The rise took back a portion of what Elliott Wave Theory sees as the second subwave, wave B, within the 4th-wave upward correction that began on August 5. That upward correction is a subwave of the final subwave of a declining 5th wave, which in turn is the final subwave of wave C, the final subwave of a 4th-wave downward correction that began on July 11.
Using the wave labels that appear on the chart, the line up, smaller to larger, is wave B{-13} within wave 4{-12} within wave 5{-11} within wave C{-10}, the final wave of the downward correction, wave 4{-9}
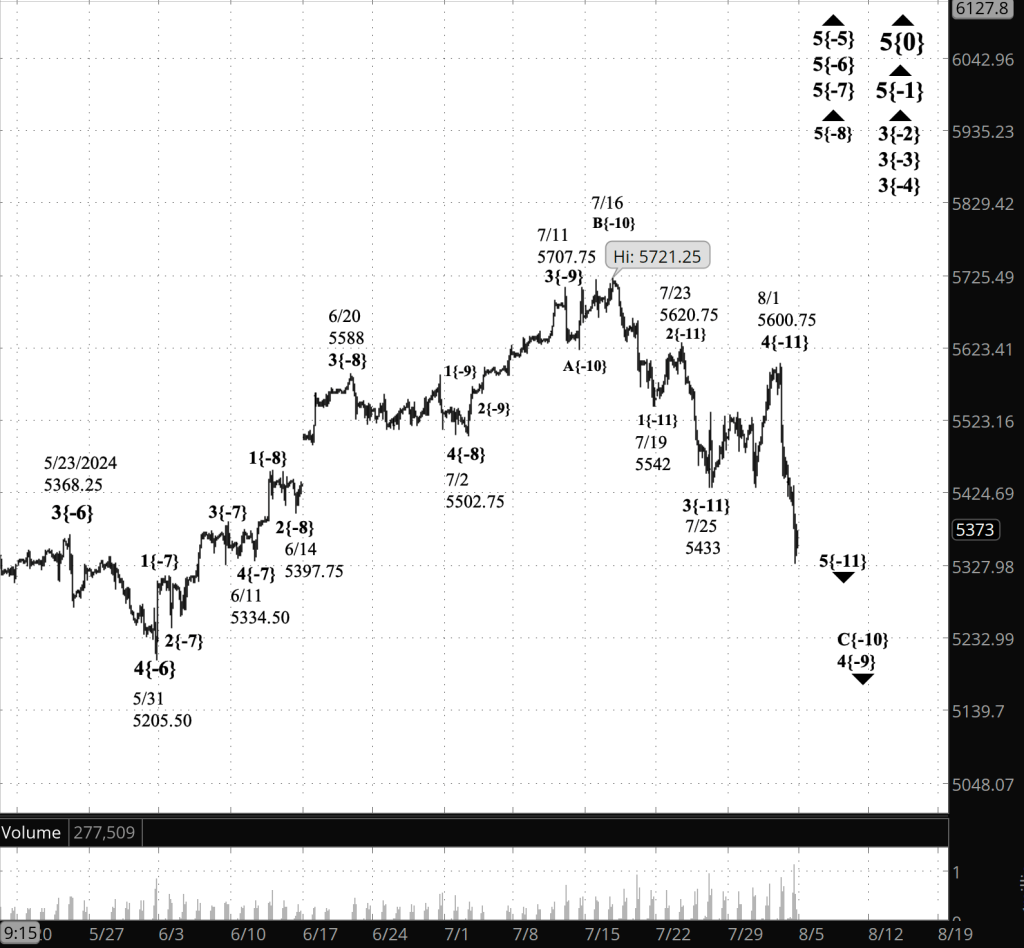
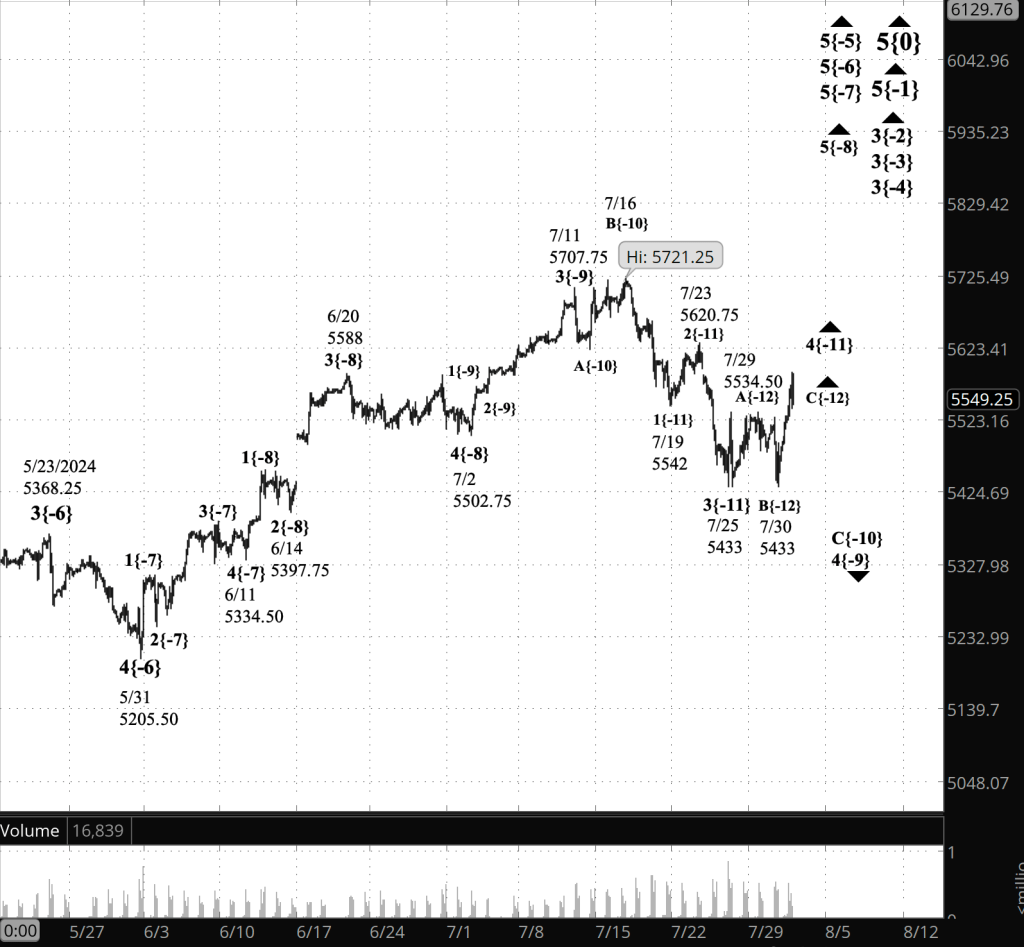
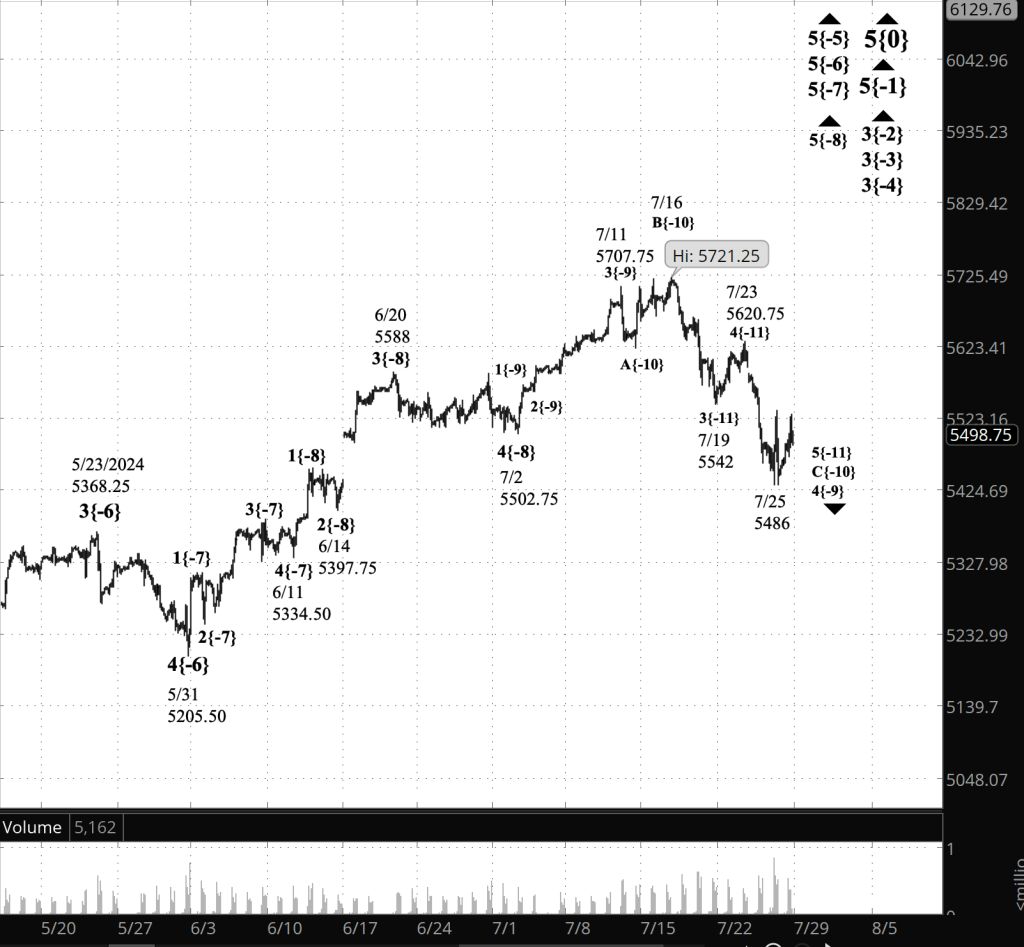
The chart’s waves and labeled by a wave number followed by a subscript in curly brackets showing the distance from the current Intermediate wave, wave 5{0}, which began in December 2018.
And after the correction. The larger 4th-wave downward correction that has defined the markets since mid-July will be followed by an uptrendng wave 5, that if typical will retrace all of decline of wave 4 and will then rise some more. Fifth waves are fickle beasts. This one could truncate, coming up short of the prior wave-4 peak. Or it could extend, moving far higher than expected.
In any case, the end of the uptrending wave 5 will also be the end of a series of nested 5th waves covering four degrees within the fractal structure of the chart. They are waves 5{-8} to wave 5{-5} in the chart’s labeling system.
Enclosing them all is rising wave 3{-4}, which began on February 21 from 4959 and which will also end simultaneously with the smaller waves it contains. A very large 4th-wave downward correction, wave 4{-4}, will follow, taking back a portion of a rise of the last six months.
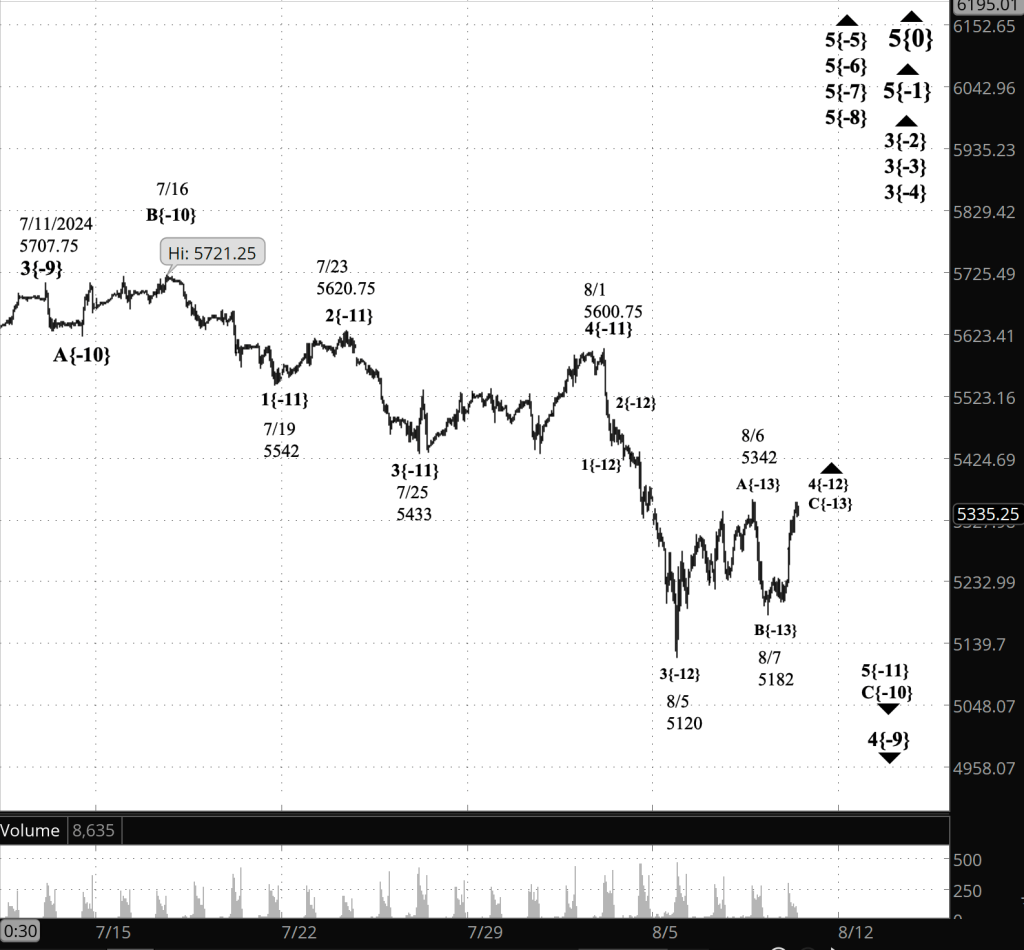
[S&P 500 E-mini futures at 3:30 p.m., 50-minute bars, with volume]
What are the alternatives? It’s possible that the August 6 session high, labeled wave A{-13} on the chart, is the end of the low 4th-wave upward correction. If so, then the 5th-wave uptrend that follows will likely carry the price back into the 5600s, although it could fall short or it could go much higher.
I’ve rejected this because the rise to August 6 appears to have five subwaves, which is more typical of an A-wave in a Zigzag structure than it is an entire correction. None the less, there are ways to analyze it as a full correction.
Another possibility: Wave B ended on the August 7 session low, and rising wave C is underway, an interpretation that seems out of proprotion to me.
What does Elliott wave theory say? Here are the waves that underly the analyses.
Principal Analysis:
- Rising wave 5{0} is underway. It is a wave of Intermediate degree that began in December 2018.
- It is in its final subwave, wave 5{-1}.
- Within wave 5{-1}, rising waves 3{-2}, 3{-3} and 3{-4} are underway, as is wave 5{-5}.
- Wave 5{-6} is underway and is in its final subwave, uptrending wave 5{-7}, which in turn is in its final subwave, uptrending wave 5{-8}.
- Within wave 5{-8}, wave 4{-9}, a downward correction, is in progress.
- Wave 4{-9} is in its final subwave, wave C{-10}.
- Wave C{-10} is in its final subwave, wave 5{-11}.
- Wave 5{-11} is in its next-to-the-last subwave, a rising correction, wave 4{-12}.
- At the lowest level analyzed, decliinng wave B{-13} is underway.
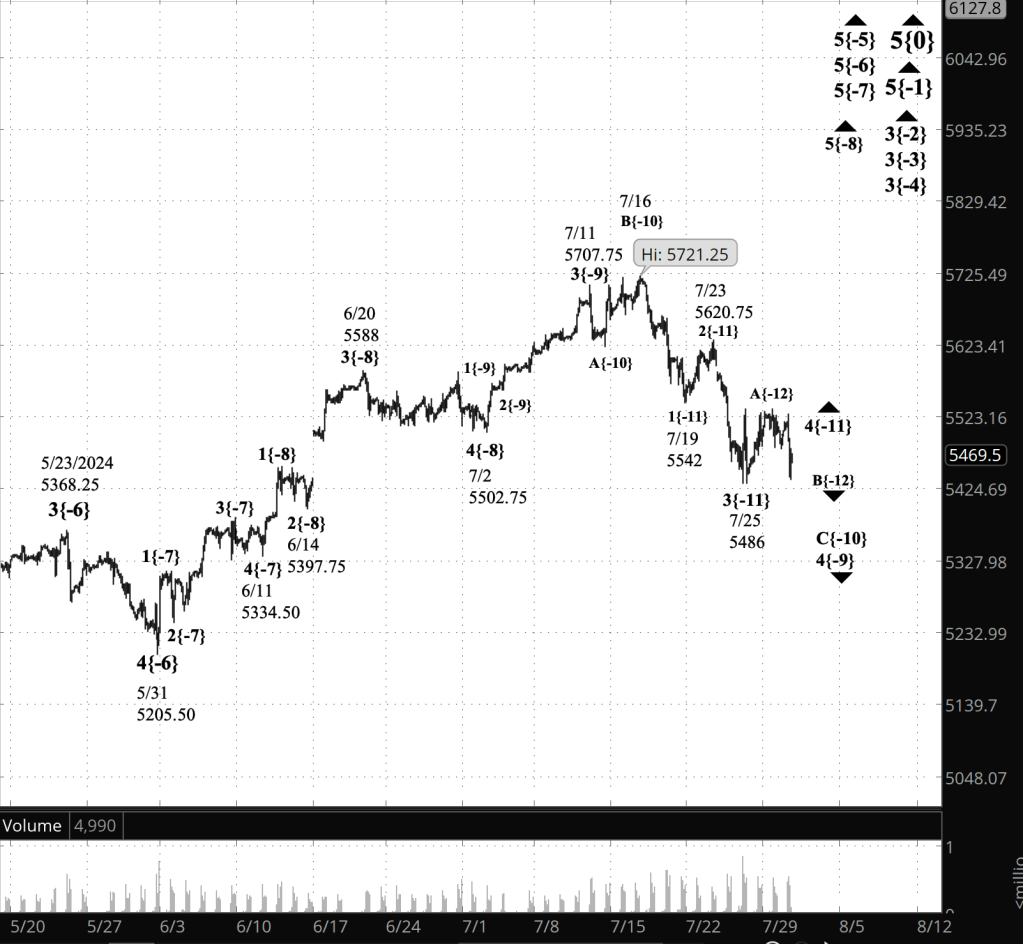
Alternative Analysis:
- Wave 5{-11} is in its final subwave, a rising correction, wave 4{-12}.
- At the lowest level analyzed, rising wave C{-13} is underway.
Reading the chart. Price movements — waves – – in Elliott wave analysis are labeled with numbers within trending waves and letters with corrective waves. The subscripts — numbers in curly brackets — designate the wave’s degree, which, in Elliott wave analysis, means the relative position of a wave within the larger and smaller structures that make up the chart. R.N. Elliott, who in the 1930s developed the form of analysis that bears his name, viewed the chart as a complex structure of smaller waves nested within larger waves, which in turn are nested within still larger waves. In mathematics it’s called a fractal structure, where at every scale the pattern is similar to the others.
Learning and other resources. Elliott wave analysis provides context, not prophecy. As the 20th century semanticist Alfred Korzybski put it in his book Science and Sanity (1933), “The map is not the territory … The only usefulness of a map depends on similarity of structure between the empirical world and the map.” And I would add, in the ever-changing markets, we can judge that similarity of structure only after the fact.
See the menu page Analytical Methods for a rundown on where to go for information on Elliott wave analysis.
By Tim Bovee, Portland, Oregon, August 8, 2024
Disclaimer
Tim Bovee, Private Trader tracks the analysis and trades of a private trader for his own accounts. Nothing in this blog constitutes a recommendation to buy or sell stocks, options or any other financial instrument. The only purpose of this blog is to provide education and entertainment.
No trader is ever 100 percent successful in his or her trades. Trading in the stock and option markets is risky and uncertain. Each trader must make trading decisions for his or her own account, and take responsibility for the consequences.
License
All content on Tim Bovee, Private Trader by Timothy K. Bovee is licensed under a Creative Commons Attribution-ShareAlike 4.0 International License.
Based on a work at www.timbovee.com.


You must be logged in to post a comment.