3:30 p.m. New York time
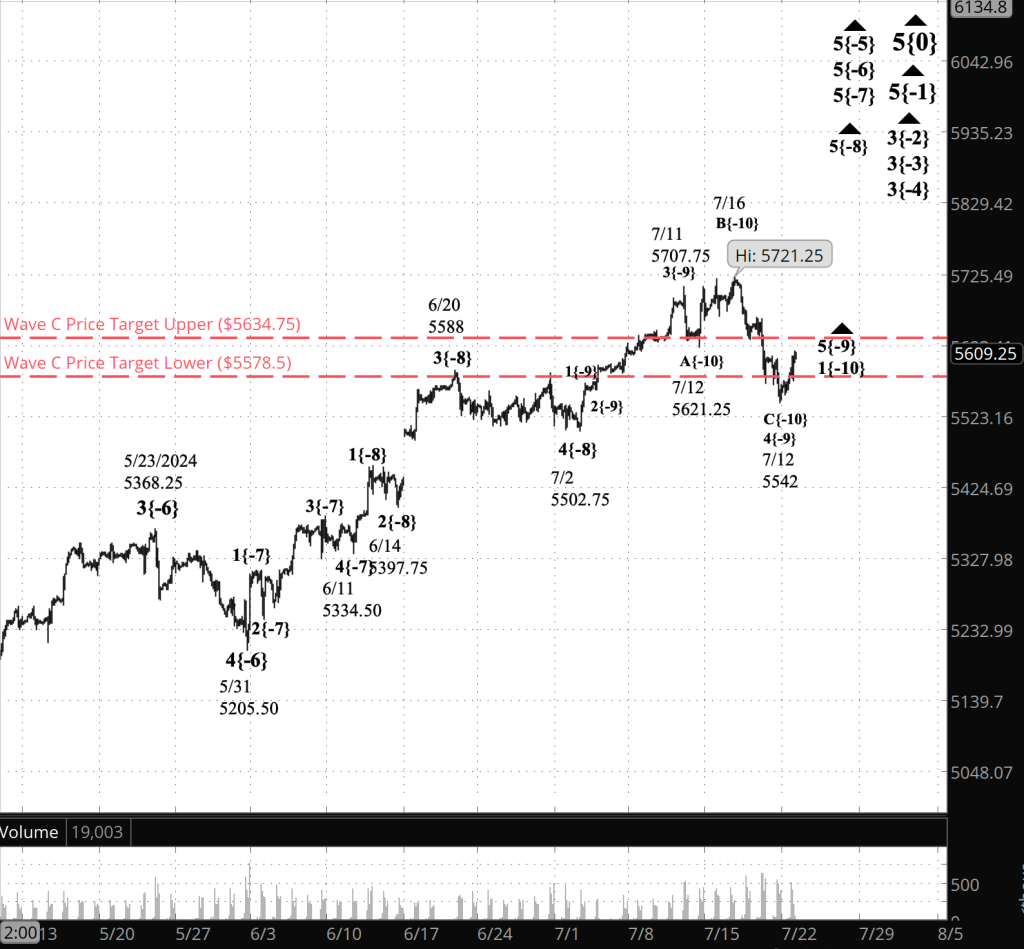
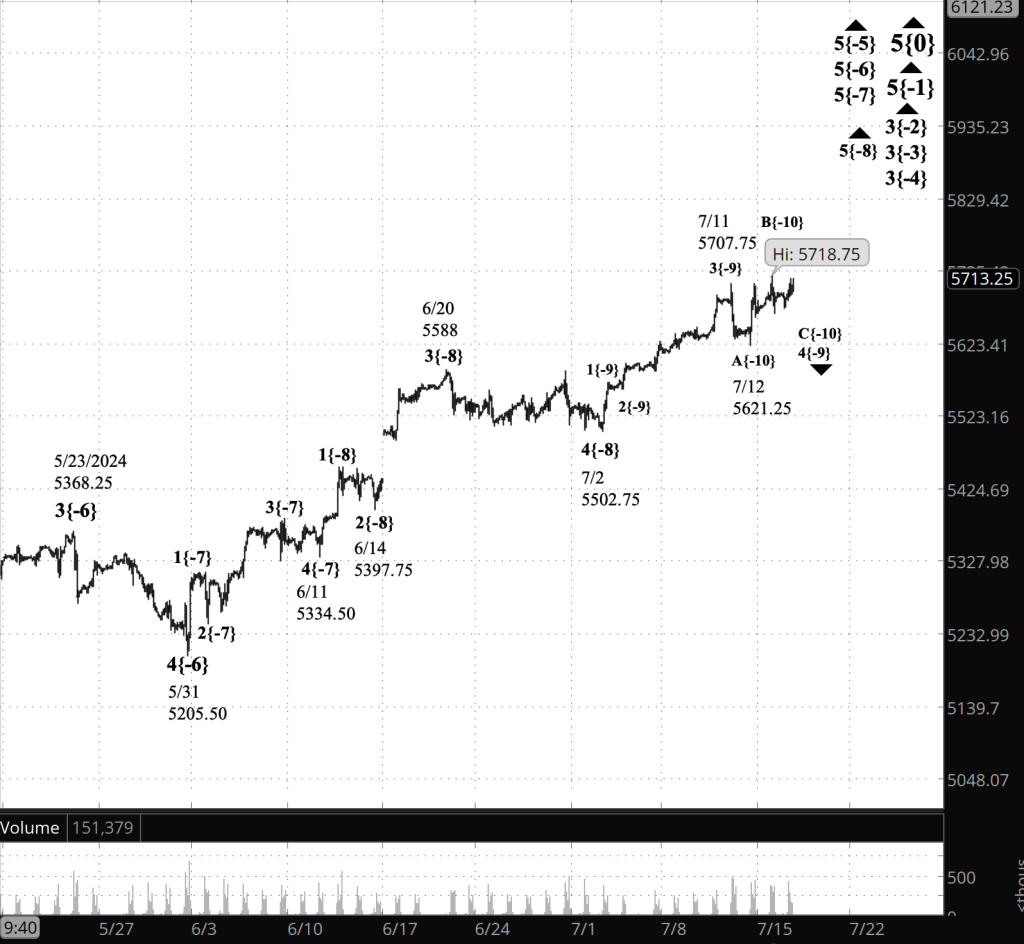
Half an hour before the closing bell. The S&P 500 futures rose during the session into the 5530s and then retreated. This morning’s Elliott Wave Theory analysis stands unchanged: The final subwave within wave C, the final subwave within the 4th-wave downward correction that began on July 11 continues.
Maybe. It’s possible that the session low, 5432.50, marks the end of the the 5th wave, wave C and the 4th-wave correction, and the start of an uptrending 5th wave. There is ambiguity in the wave count within wave 5, especially in the early stages, when the power of the decline was strongest. So for the present, I’m sticking with the 4th-wave scenario. If the wave moves above 5620.25 — the starting point of the 5th wave, then there would be greater confidence that the larger wave 5 uptrend had begun.
I’ve updated the chart.
9:35 a.m. New York time
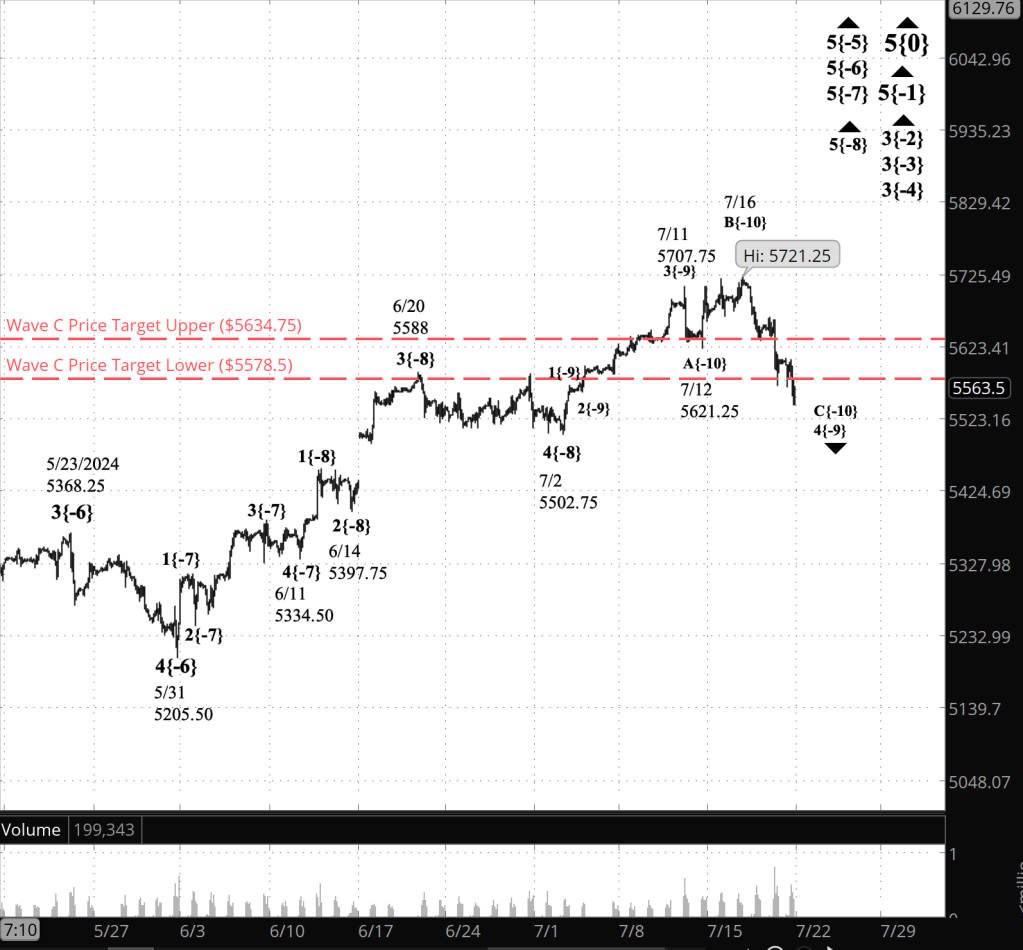
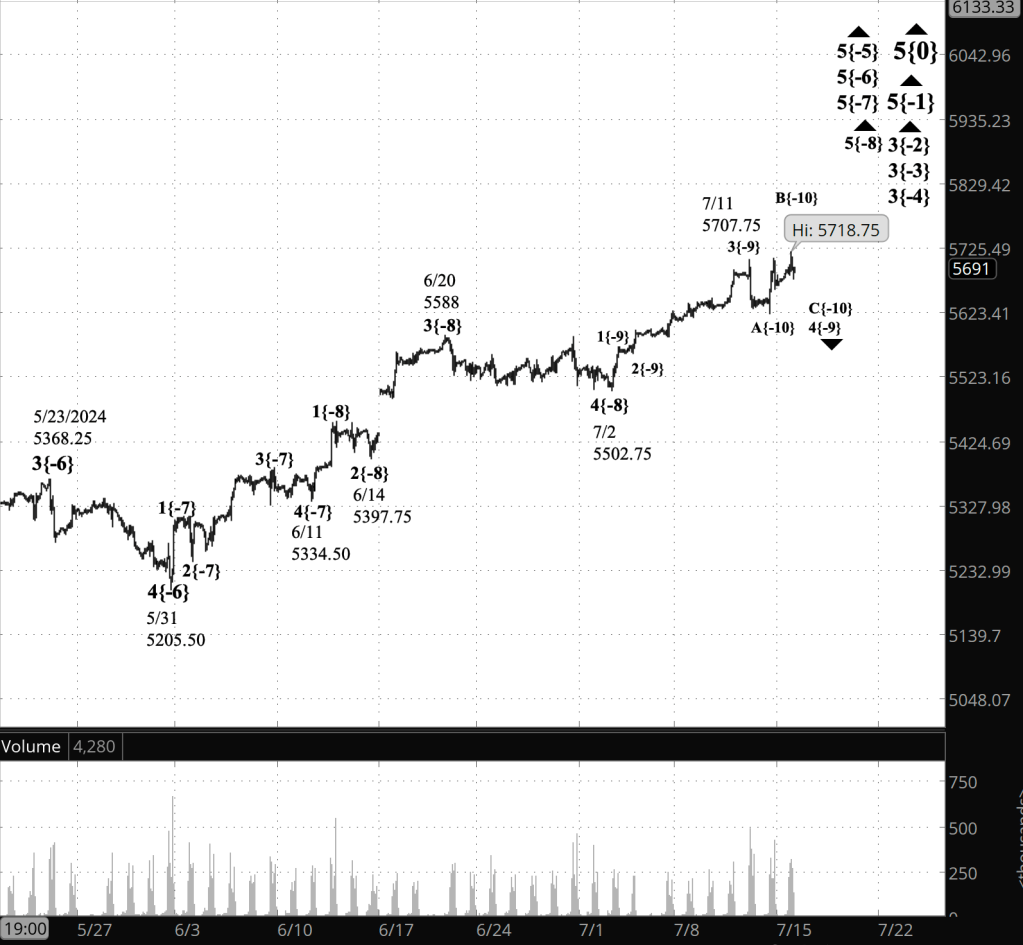
What’s happening now? The S&P 500 E-mini futures continued to fall overnight, reaching into the 5450s and then rising sharply into the 5470s with the release of new GDP statistics as the opening bell approached.
What does it mean? Elliott Wave Theory sees the decline that began on July 23 as the 5th and final subwave within wave C, the 3rd and final subwave within the 4th-wave downward correction that began on July 11.
The question at this point is, How low can it go? And Elliott Wave Theory has no answer, since the price has crashed past the target price range for the wave C. In the words of the New York Yankees baseball legend Yogi Berra, “It ain’t over till it’s over”.
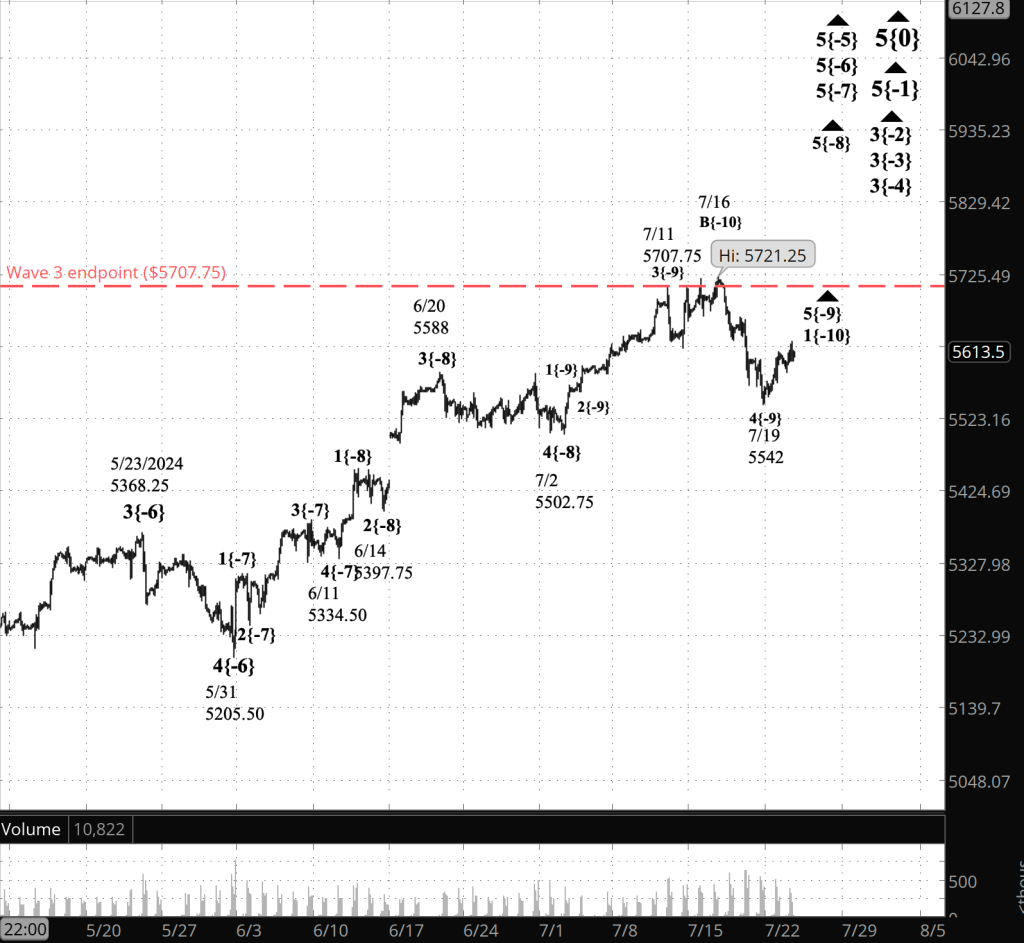
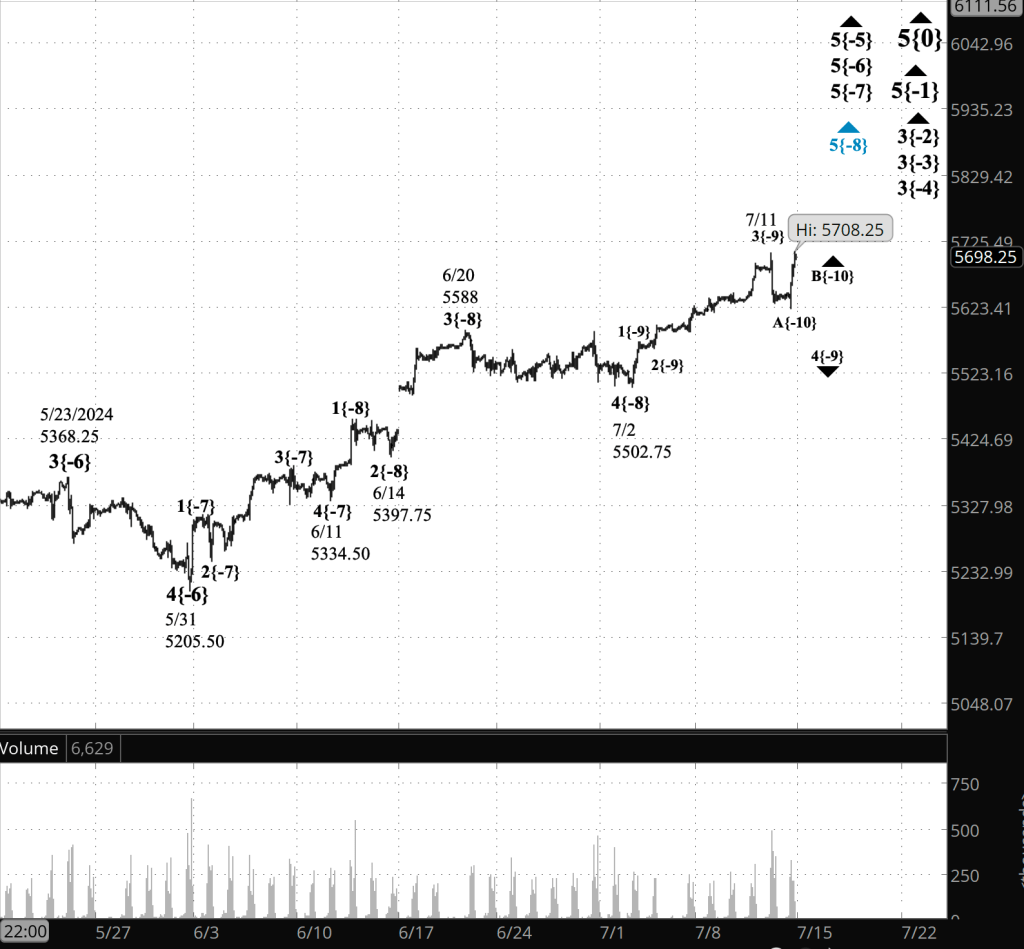
Looking ahead. The end of wave C will also be the end of the 4th-wave downward correction and the beginning of a rising 5th-wave that, if typical, will carry the price above the end of the preceding 3rd wave on July 11, at 5707.75. That’s a tendency not rule. The 5th waves within uptrends tend to vary widely, some ending before the reaching the 3rd-wave peak — truncation — and others moving further beyond that peak than seems proportional — extension.
In either case, the end of this low-degree 5th wave will cascade up the fractal hierarchy of the chart, also marking the end of four 5th waves, each a degree higher than the one below it. At the top of the chain is a 3rd-wave, a degree above the largest of the 5th waves, and it will also come to an end, to be followed by a 4th-wave downward correction that is significantly larger than the one we’re moving through now.
See the “Reading the chart” section below for a brief description of how charts are structure in Elliott Wave Theory.
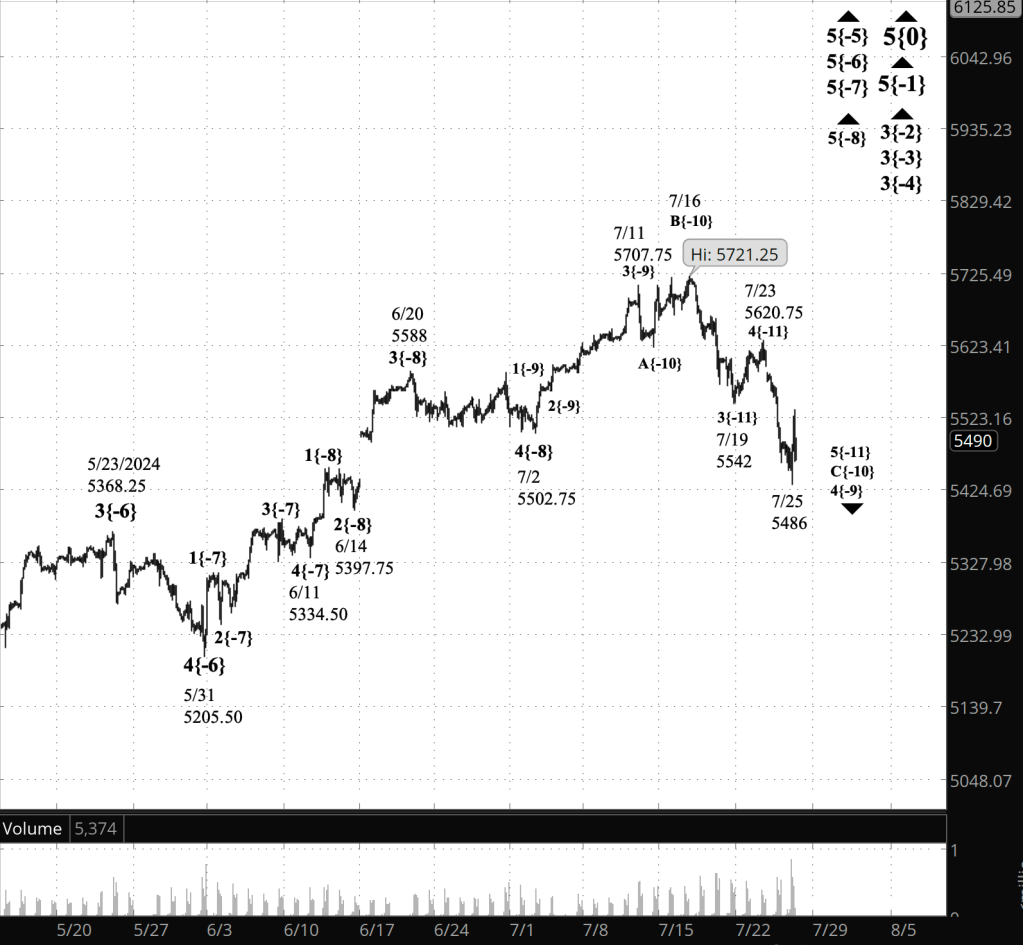
[S&P 500 E-mini futures at 3:30 p.m., 2-hour bars, with volume]
What are the alternatives? None at present. Ambiguities are certain to emerge, most likely in the subwave analysis within the 5th wave within wave C. Calling the end of a trend is always fraught with peril, because the wave within a price movement sometimes lacks clarity.
What does Elliott wave theory say? Here are the waves that underly the analyses.
Principal Analysis:
- Rising wave 5{0} is underway. It is a wave of Intermediate degree that began in December 2018.
- It is in its final subwave, wave 5{-1}.
- Within wave 5{-1}, rising waves 3{-2}, 3{-3} and 3{-4} are underway, as is wave 5{-5}.
- Wave 5{-6} is underway and is in its final subwave, uptrending wave 5{-7}, which in turn is in its final subwave, uptrending wave 5{-8}.
- Within wave 5{-8}, wave 4{-9}, a downward correction, is in progress.
- Wave 4{-9} is in its final subwave, wave C{-10}, which in turn is in its final subwave, wave 5{-11}.
Reading the chart. Price movements — waves – – in Elliott wave analysis are labeled with numbers within trending waves and letters with corrective waves. The subscripts — numbers in curly brackets — designate the wave’s degree, which, in Elliott wave analysis, means the relative position of a wave within the larger and smaller structures that make up the chart. R.N. Elliott, who in the 1930s developed the form of analysis that bears his name, viewed the chart as a complex structure of smaller waves nested within larger waves, which in turn are nested within still larger waves. In mathematics it’s called a fractal structure, where at every scale the pattern is similar to the others.
Learning and other resources. Elliott wave analysis provides context, not prophecy. As the 20th century semanticist Alfred Korzybski put it in his book Science and Sanity (1933), “The map is not the territory … The only usefulness of a map depends on similarity of structure between the empirical world and the map.” And I would add, in the ever-changing markets, we can judge that similarity of structure only after the fact.
See the menu page Analytical Methods for a rundown on where to go for information on Elliott wave analysis.
By Tim Bovee, Portland, Oregon, July 25, 2024
Disclaimer
Tim Bovee, Private Trader tracks the analysis and trades of a private trader for his own accounts. Nothing in this blog constitutes a recommendation to buy or sell stocks, options or any other financial instrument. The only purpose of this blog is to provide education and entertainment.
No trader is ever 100 percent successful in his or her trades. Trading in the stock and option markets is risky and uncertain. Each trader must make trading decisions for his or her own account, and take responsibility for the consequences.
License
All content on Tim Bovee, Private Trader by Timothy K. Bovee is licensed under a Creative Commons Attribution-ShareAlike 4.0 International License.
Based on a work at www.timbovee.com.


You must be logged in to post a comment.