Trader’s Notebook

3:30 p.m. New York time

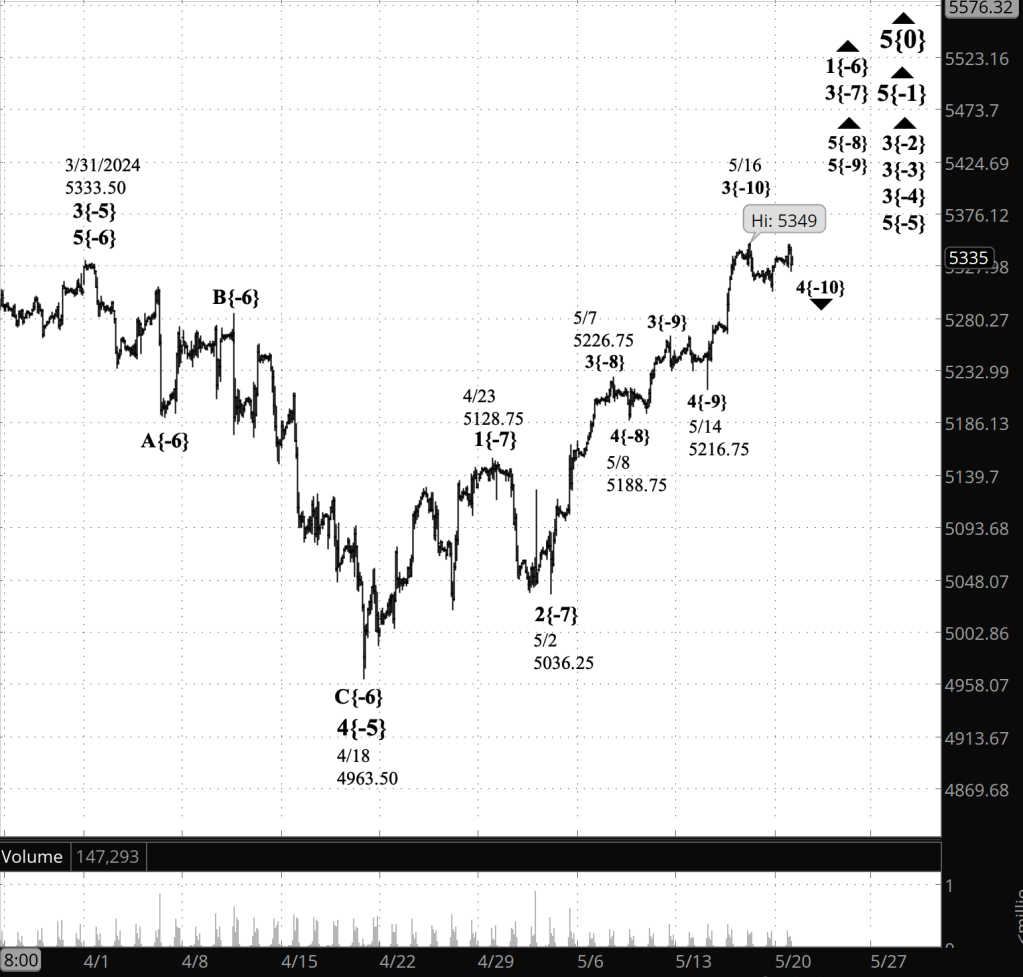
Half an hour before the closing bell. The S&P 500 futures fell during the session, reaching into the 5290s as the last subwave, wave C, of the 4th-wave downward correction continued. Wave 4 has been underway since May 16 and the C wave, since May 23.

I’ve updated the chart.

9:35 a.m. New York time

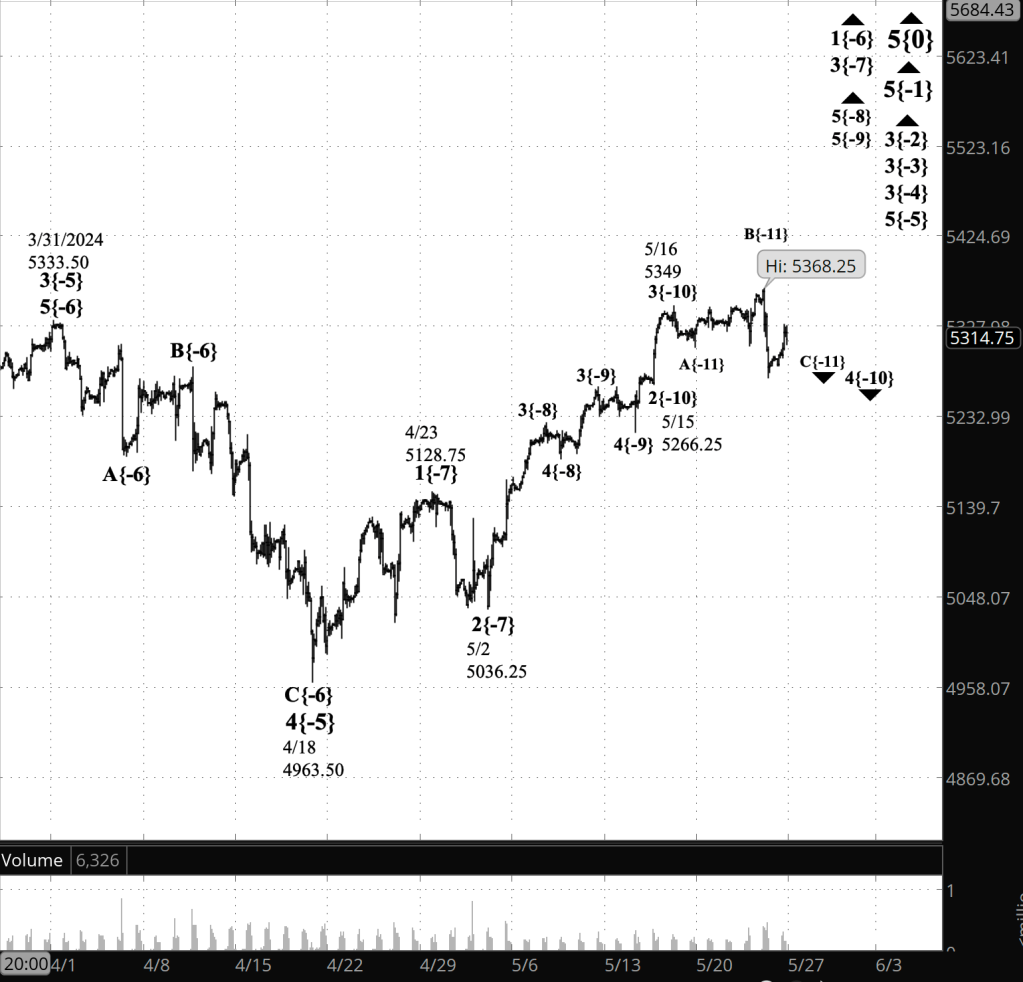
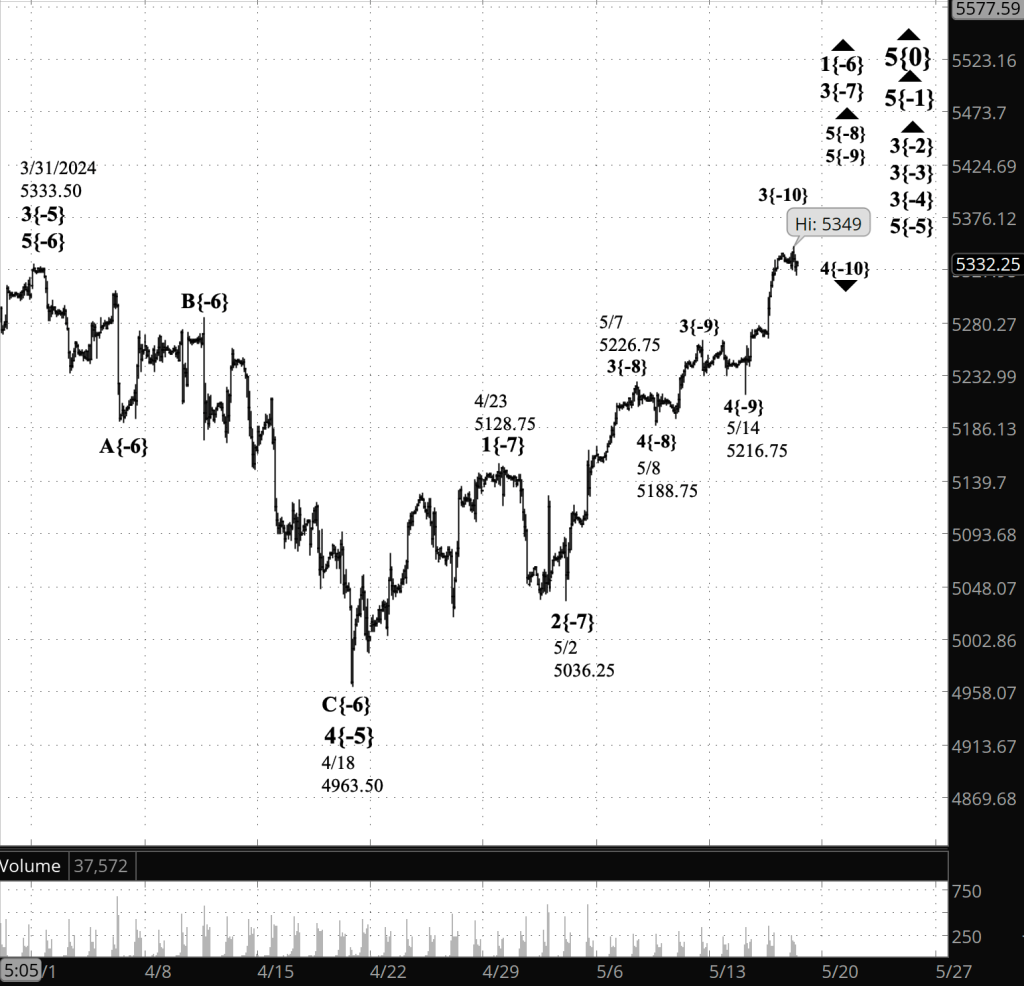
What’s happening now? The S&P 500 E-mini futures kept to a narrow range after trading resumed overnight following a long holiday weekend in the U.S, remaining in the 5320s and 5330s,

What does it mean? The 4th-wave downward correction continues and is in its final subwave — declining wave C. The correction began on May 16 and the C wave, on May 23.

Wave C remains below its starting point, 5368.25 and and its low point is in the neighborhood of the 4th subwave within the preceding 3rd wave — 5338 to 5328 — which is the range in which 4th-wave corrections usually end.

This correction is a small one, but like all 4th waves, it has large implications for the market’s future course.

A counter-trend 4th wave is the next-to-the-last wave within whatever larger trend it’s part of. It is followed by a 5th wave moving in the direction of the trend. When the 5th wave is complete, it’s also the end of the parent wave. And if the grandparent wave is also a 5th wave, it means the completion of that wave and its parent (calll it the great-grandparent).

The 5th wave that will follow the present 4th wave has a 5th wave parent and grandparent. The great-grandparent wave is a 3rd wave and will be followed by a 4th-wave downward correction three degrees higher than the present correction.

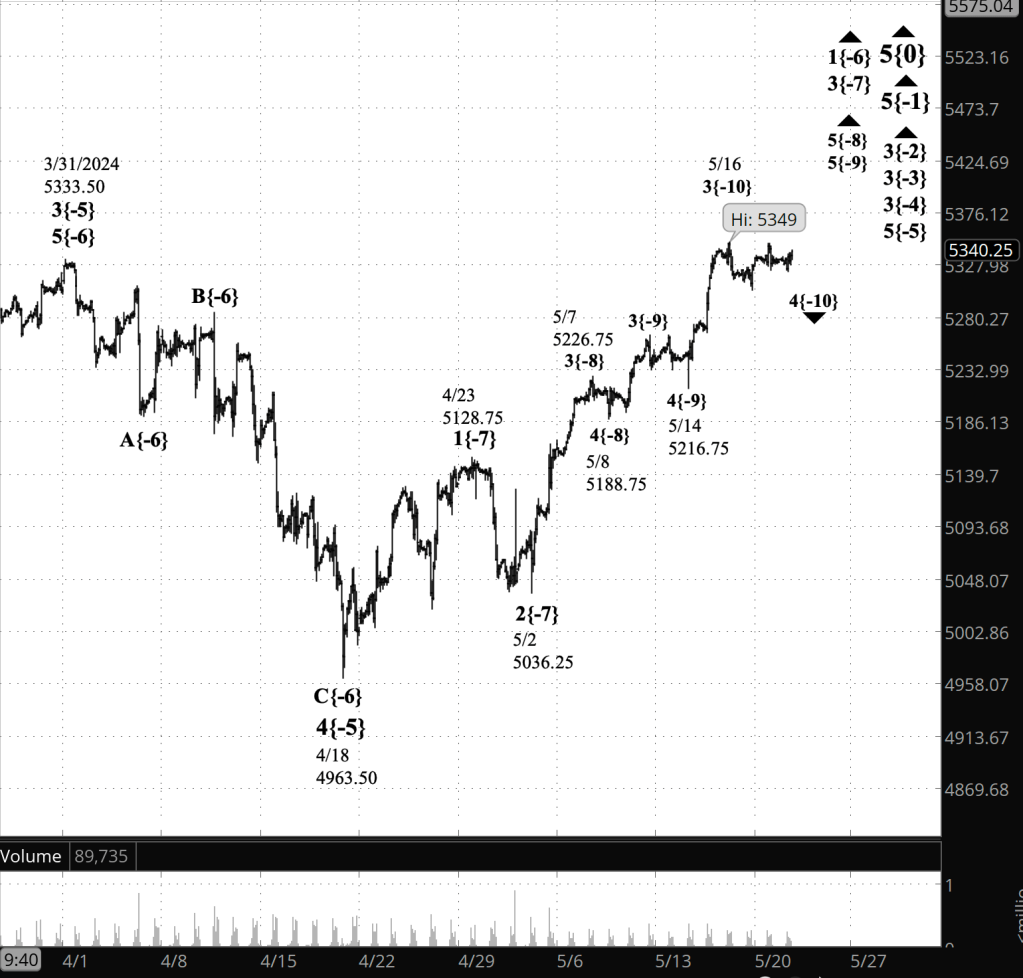
What are the alternatives? The principal analysis puts the 4th-wave correction and its subwaves within a still larger 1st wave that began on April 18. Maybe. It’s also possible that there is no still larger 1st wave, and instead, that the four smaller waves on the chart below wave 1 — labeled 4{-10}, 5{-9}, 5{-8} and 3{-7} — are one degree larger, eliminating the next higher degree. In that case, wave 1{-6} ended on April 23. See the Reading the Chart section below for an explanation of wave labeling, including the curly brackets.

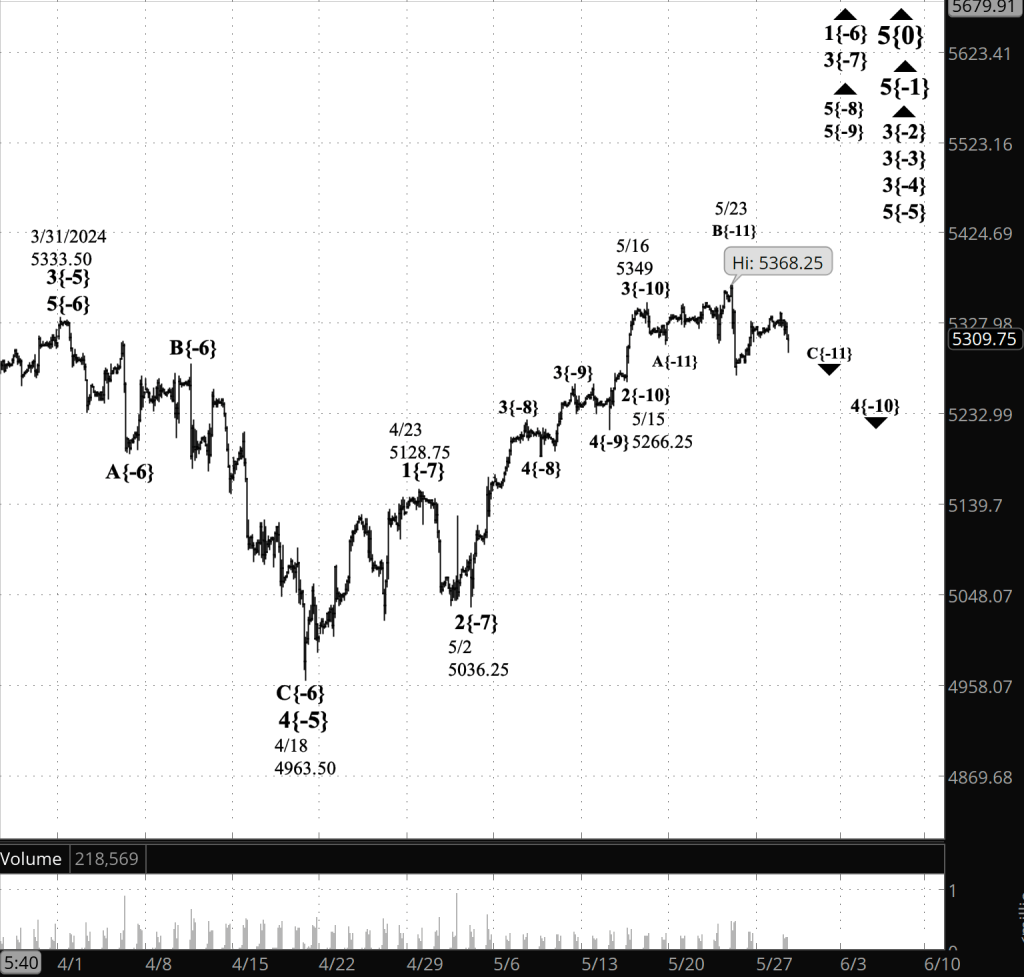
[S&P 500 E-mini futures at 3:30 p.m., 115-minute bars, with volume]

What does Elliott wave theory say? Here are the waves that underly the analyses.

Principal Analysis:

  • Rising wave 5{0} is underway. It is a wave of Intermediate degree that began in December 2018.
  • It is in its final subwave, wave 5{-1}.
  • Within wave 5{-1}, rising waves 3{-2}, 3{-3} and 3{-4} are underway, as is wave 5{-5}.
  • Wave 1{-6} is underway and is in its middle subwave, wave 3{-7}, which is in its final subwave, wave 5{-8}.
  • Wave 5{-8} is in its final subwave, wave 5{-9}, which is in its next-to-the-last subwave, wave 4{-10}.
  • Within wave 4{-10}, the final subwave, wave C{-11}, is underway.

Reading the chart. Price movements — waves – – in Elliott wave analysis are labeled with numbers within trending waves and letters with corrective waves. The subscripts — numbers in curly brackets — designate the wave’s degree, which, in Elliott wave analysis, means the relative position of a wave within the larger and smaller structures that make up the chart. R.N. Elliott, who in the 1930s developed the form of analysis that bears his name, viewed the chart as a complex structure of smaller waves nested within larger waves, which in turn are nested within still larger waves. In mathematics it’s called a fractal structure, where at every scale the pattern is similar to the others.

Learning and other resources. Elliott wave analysis provides context, not prophecy. As the 20th century semanticist Alfred Korzybski put it in his book Science and Sanity (1933), “The map is not the territory … The only usefulness of a map depends on similarity of structure between the empirical world and the map.” And I would add, in the ever-changing markets, we can judge that similarity of structure only after the fact.

See the menu page Analytical Methods for a rundown on where to go for information on Elliott wave analysis.

By Tim Bovee, Portland, Oregon, May 28, 2024

Disclaimer

Tim Bovee, Private Trader tracks the analysis and trades of a private trader for his own accounts. Nothing in this blog constitutes a recommendation to buy or sell stocks, options or any other financial instrument. The only purpose of this blog is to provide education and entertainment.

No trader is ever 100 percent successful in his or her trades. Trading in the stock and option markets is risky and uncertain. Each trader must make trading decisions for his or her own account, and take responsibility for the consequences.

License
Creative Commons License

All content on Tim Bovee, Private Trader by Timothy K. Bovee is licensed under a Creative Commons Attribution-ShareAlike 4.0 International License.

Based on a work at www.timbovee.com.

Trader’s Notebook

Market Holiday. U.S. markets will be closed on Monday in observance of the Memorial Day holiday, which honors American military who died for their country. Trading of the S&P 500 futures will resume Monday night and the regular sessions will resume on Tuesday, May 28.

3:30 p.m. New York time

Half an hour before the closing bell. The S&P 500 futures climbed further, into the 5320s, and then dropped back slightly into the 5310s so far. Elliott Wave Theory: The session rise was the 4th subwave with wave C, the final subwave of the 4th-wave downward correction that began on May 16. The decline that followed is most likely the beginning of the 5th and final subwave within wave C. The 4th subwave of C is expected to have three subwaves, and that’s what shows on the chart. However, I’d like to see further decline to verify that wave C’s 5th subwave is underway.

I’ve updated the chart.

9:35 a.m. New York time

What’s happening now? The S&P 500 E-mini futures rose gently overnight, from the 5280s to above 5300.

What does it mean? Elliott Wave Theory sees the rise as part of the final subwave — wave C — of a 4th-wave downward correction that began on May 16. The C wave in a three-subwave correct has five subwaves, two degrees deep within the correction. The overnight rise is wave C’s 4th subwave.

A falling 5th subwave will follow, bringing wave C to a close and also ending the 4th-wave downward correction. A 5th-wave uptrend will follow. When it is complete, it will also be the end of two 5th waves, each larger than the one before, and a still larger 3rd wave that began on May 2.

What are the alternatives? All of that is happening within a still larger 1st wave that began on April 18. Maybe. It’s also possible that there is no still larger 1st wave, and instead, that the four smaller waves on the chart below wave 1 — labeled 4{-10}, 5{-9}, 5{-8} and 3{-7} — are one degree larger, eliminating the next higher degree. In that case, wave 1{-6} ended on April 23. See the Reading the Chart section below for an explanation of wave labeling, including the curly brackets.

[S&P 500 E-mini futures at 3:30 p.m., 110-minute bars, with volume]

What does Elliott wave theory say? Here are the waves that underly the analyses.

Principal Analysis:

  • Rising wave 5{0} is underway. It is a wave of Intermediate degree that began in December 2018.
  • It is in its final subwave, wave 5{-1}.
  • Within wave 5{-1}, rising waves 3{-2}, 3{-3} and 3{-4} are underway, as is wave 5{-5}.
  • Wave 1{-6} is underway and is in its middle subwave, wave 3{-7}, which is in its final subwave, wave 5{-8}.
  • Wave 5{-8} is in its final subwave, wave 5{-9}, which is in its next-to-the-last subwave, wave 4{-10}.
  • Within wave 4{-10}, the final subwave, wave C{-11}, is underway and likely is in its final subwave, wave 5{-12}.

Bigger Waves.

Of course, the fractal structure of the market isn’t limited to the smaller waves listed above. They are subwaves within a set of much bigger waves power enough to be rightly considered engines of history. Each line on the list shows the wave number, with the subscript in curly brackets, the traditional degree name, the starting date, the starting price of the S&P 500 E-mini futures, and the direction of the wave.

  • S&P 500 Index:
  • 5{+3} Supercycle, 7/8/1932, 4.40 (up)
  • 5{+2} Cycle, 12/9/1974, 60.96 (up)
  • 5{+1} Primary, 3/6/2009, 666.79 (up)
  • 5{0} Intermediate, 12/26/2018, 2346.58 (up)
  • S&P 500 Futures and index:
  • 5{-1} Minor, 10/13/2022, 3502 (up) (futures), 3491.58 (up) (index)

Reading the chart. Price movements — waves – – in Elliott wave analysis are labeled with numbers within trending waves and letters with corrective waves. The subscripts — numbers in curly brackets — designate the wave’s degree, which, in Elliott wave analysis, means the relative position of a wave within the larger and smaller structures that make up the chart. R.N. Elliott, who in the 1930s developed the form of analysis that bears his name, viewed the chart as a complex structure of smaller waves nested within larger waves, which in turn are nested within still larger waves. In mathematics it’s called a fractal structure, where at every scale the pattern is similar to the others.

Learning and other resources. Elliott wave analysis provides context, not prophecy. As the 20th century semanticist Alfred Korzybski put it in his book Science and Sanity (1933), “The map is not the territory … The only usefulness of a map depends on similarity of structure between the empirical world and the map.” And I would add, in the ever-changing markets, we can judge that similarity of structure only after the fact.

See the menu page Analytical Methods for a rundown on where to go for information on Elliott wave analysis.

By Tim Bovee, Portland, Oregon, May 24, 2024

Disclaimer

Tim Bovee, Private Trader tracks the analysis and trades of a private trader for his own accounts. Nothing in this blog constitutes a recommendation to buy or sell stocks, options or any other financial instrument. The only purpose of this blog is to provide education and entertainment.

No trader is ever 100 percent successful in his or her trades. Trading in the stock and option markets is risky and uncertain. Each trader must make trading decisions for his or her own account, and take responsibility for the consequences.

License
Creative Commons License

All content on Tim Bovee, Private Trader by Timothy K. Bovee is licensed under a Creative Commons Attribution-ShareAlike 4.0 International License.

Based on a work at www.timbovee.com.

Trader’s Notebook

3:30 p.m. New York time

Half an hour before the closing bell. The S&P 500 futures turned sharply downward during the session, moving rapidly from the overnight peak in the 5360s into the 5270s.

The decline invalidated this morning’s principal analysis. The 4th-wave downward correction that began on May 16 continues and is in its final subwave, wave C. When wave C is complete, it will also be the end of wave 4 and the beginning of a 5th-wave uptrend. But not yet.

I’ve updated the chart.

9:35 a.m. New York time

[Note that events on the chart have invalidated the analysis that follows.]

What’s happening now? The S&P 500 E-mini futures rose overnight, reaching into the 5360s.

What does it mean? Elliott Wave Theory sees the move to a new high as the first steps in a 5th-wave uptrend of low degree. The uptrend began on May 22 from 5306.75.

The preceding small 3rd-wave uptrend, usually the longest wave within a trend, took two days to complete. However, 5th waves tend to be on the quirky side. Sometimes they come up short, and sometimes they extend, moving beyond expectations.

This wave 5 has already moved beyond the end of the preceding 3rd wave and so by definition hasn’t come up short. It’s now in the as-expected territory.

The preceding 3rd wave rose 82.75 points. There’s no rule in Elliott Wave Theory that requires the 5th wave to be shorter or longer. If it covers a similar distance, it will reach into the 5380s.

In any case, wave 5 will have five subwaves. When complete, it will will also mark the end of two larger 5th waves in the fractal structure of the chart, and a still larger 3rd wave that began on May 7.

Waves are labeled on the chart with the wave number followed by a subscript, in curly brackets, that sow the wave’s distance from Intermediate degree in the fractal structure of the chart. The present Intermediate degree began in December 2018.

Here are the wave’s discussed above: Wave 4{-10} ended, wave 5{-10} has began, it has moved beyond the end of wave 3{-10}. When wave 5{-10} is complete, it will also mark the end of waves 5{-9} and 5{-9}, and also of their parent wave, 3{-8}. A downward correction, wave 4{-8}, will begin.

What are the alternatives? An ambiguity on the chart, regarding the 1st wave that began on April 18. The four smaller waves on the chart below wave 1 — labeled 4{-10}, 5{-9}, 5{-8} and 3{-7} — may in fact be one degree larger, eliminating the next higher degree, wave 1{-6}. See the Reading the Chart section below for an explanation of wave labeling, including the curly brackets.

[S&P 500 E-mini futures at 3:30 p.m., 110-minute bars, with volume]

Note that the above chart contains a major revidsion from this morning’s version]

What does Elliott wave theory say? Here are the waves that underly the analyses.

[Revised to account for events on the chart during the session]

Principal Analysis:

  • Rising wave 5{0} is underway. It is a wave of Intermediate degree that began in December 2018.
  • It is in its final subwave, wave 5{-1}.
  • Within wave 5{-1}, rising waves 3{-2}, 3{-3} and 3{-4} are underway, as is wave 5{-5}.
  • Wave 1{-6} is underway and is in its middle subwave, wave 3{-7}, which is in its final subwave, wave 5{-8}.
  • Wave 5{-8} is in its final subwave, wave 5{-9}, which is in its next-to-the-last subwave, wave 4{-10}.

We Are Here.

These are the waves currently in progress under my principal analysis. Each line on the list shows the wave number, with the subscript in curly brackets, the traditional degree name, the starting date, the starting price of the S&P 500 E-mini futures, and the direction of the wave.

  • S&P 500 Index:
  • 5{+3} Supercycle, 7/8/1932, 4.40 (up)
  • 5{+2} Cycle, 12/9/1974, 60.96 (up)
  • 5{+1} Primary, 3/6/2009, 666.79 (up)
  • 5{0} Intermediate, 12/26/2018, 2346.58 (up)
  • S&P 500 Futures and index:
  • 5{-1} Minor, 10/13/2022, 3502 (up) (futures), 3491.58 (up) (index)
  • S&P 500 Futures:

Reading the chart. Price movements — waves – – in Elliott wave analysis are labeled with numbers within trending waves and letters with corrective waves. The subscripts — numbers in curly brackets — designate the wave’s degree, which, in Elliott wave analysis, means the relative position of a wave within the larger and smaller structures that make up the chart. R.N. Elliott, who in the 1930s developed the form of analysis that bears his name, viewed the chart as a complex structure of smaller waves nested within larger waves, which in turn are nested within still larger waves. In mathematics it’s called a fractal structure, where at every scale the pattern is similar to the others.

Learning and other resources. Elliott wave analysis provides context, not prophecy. As the 20th century semanticist Alfred Korzybski put it in his book Science and Sanity (1933), “The map is not the territory … The only usefulness of a map depends on similarity of structure between the empirical world and the map.” And I would add, in the ever-changing markets, we can judge that similarity of structure only after the fact.

See the menu page Analytical Methods for a rundown on where to go for information on Elliott wave analysis.

By Tim Bovee, Portland, Oregon, May 23, 2024

Disclaimer

Tim Bovee, Private Trader tracks the analysis and trades of a private trader for his own accounts. Nothing in this blog constitutes a recommendation to buy or sell stocks, options or any other financial instrument. The only purpose of this blog is to provide education and entertainment.

No trader is ever 100 percent successful in his or her trades. Trading in the stock and option markets is risky and uncertain. Each trader must make trading decisions for his or her own account, and take responsibility for the consequences.

License
Creative Commons License

All content on Tim Bovee, Private Trader by Timothy K. Bovee is licensed under a Creative Commons Attribution-ShareAlike 4.0 International License.

Based on a work at www.timbovee.com.

Trader’s Notebook

3:30 p.m. New York time

Half an hour before the closing bell. The S&P 500 futures fell sharply during the session, from the 5340s to below 5310. Elliott Wave Theory: The decline confirms this morning’s principal analysis, that declining wave C, the final subwave of the 4th-wave downward correction that began on May 16, is underway. It resolves the ambiguity discussed this morning over whether wave B had ended: It had.

I’ve updated the chart.

9:35 a.m. New York time

What’s happening now? The S&P 500 E-mini futures rose overnight to 25 cents above the starting point of the 4th-wave downward correction that began on May 16,

What does it mean? When applying the rules of Elliott Wave Theory, it becomes clear that the correction is taking the form of a Flat, which is common in 4th waves. This decline from May, wave A, had three subwaves, a sign of the Flat structure.

The rise that followed, wave B, is now underway, or may have ended at the overnight high, 5349.25. In labeling the chart, I’ve chosen the “still underway” scenario for my principal analysis but would be unsurprised if wave B rose still higher.

In any case, the B wave will be followed by declining wave C, the final subwave of the correction. An uptrending 5th wave will follow, completing the parent wave, a rising 5th wave that began on May 14, and triggering the end of two larger 5th waves, as well as the still larger 3rd wave that began on May 2.

The 3rd wave is a subwave within a larger 1st wave that began on April 18, along with its parent 5th wave. When the 3rd wave that began on May 2 is complete, it will be followed by a 4th-wave downward correction three degrees higher than the present 4th-degree correction within the fractal structure of the chart.

What are the alternatives? In addition to the ambiguity over whether wave B has ended, discussed above, there is a more significant ambiguity regarding the 1st wave that began on April 18. The four smaller waves on the chart below wave 1 — labeled 4{-10}, 5{-9}, 5{-8} and 3{-7} — may in fact be one degree larger, eliminating the next higher degree, wave 1{-6}. See the Reading the Chart section below for an explanation of wave labeling, including the curly brackets.

[S&P 500 E-mini futures at 3:30 p.m., 100-minute bars, with volume]

What does Elliott wave theory say? Here are the waves that underly the analyses, update with the afternoon analysis.

Principal Analysis:

  • Rising wave 5{0} is underway. It is a wave of Intermediate degree that began in December 2018.
  • It is in its final subwave, wave 5{-1}.
  • Within wave 5{-1}, rising waves 3{-2}, 3{-3} and 3{-4} are underway, as is wave 5{-5}.
  • Wave 1{-6} is underway and is in its middle subwave, wave 3{-7}, which is in its final subwave, wave 5{-8}.
  • Wave 5{-8} is in its final subwave, wave 5{-9}, which is in its next-to-the-last subwave, wave 4{-10}.
  • Wave 4{-10} is in its final subwave, wave C{-11}.

Reading the chart. Price movements — waves – – in Elliott wave analysis are labeled with numbers within trending waves and letters with corrective waves. The subscripts — numbers in curly brackets — designate the wave’s degree, which, in Elliott wave analysis, means the relative position of a wave within the larger and smaller structures that make up the chart. R.N. Elliott, who in the 1930s developed the form of analysis that bears his name, viewed the chart as a complex structure of smaller waves nested within larger waves, which in turn are nested within still larger waves. In mathematics it’s called a fractal structure, where at every scale the pattern is similar to the others.

Learning and other resources. Elliott wave analysis provides context, not prophecy. As the 20th century semanticist Alfred Korzybski put it in his book Science and Sanity (1933), “The map is not the territory … The only usefulness of a map depends on similarity of structure between the empirical world and the map.” And I would add, in the ever-changing markets, we can judge that similarity of structure only after the fact.

See the menu page Analytical Methods for a rundown on where to go for information on Elliott wave analysis.

By Tim Bovee, Portland, Oregon, May 22, 2024

Disclaimer

Tim Bovee, Private Trader tracks the analysis and trades of a private trader for his own accounts. Nothing in this blog constitutes a recommendation to buy or sell stocks, options or any other financial instrument. The only purpose of this blog is to provide education and entertainment.

No trader is ever 100 percent successful in his or her trades. Trading in the stock and option markets is risky and uncertain. Each trader must make trading decisions for his or her own account, and take responsibility for the consequences.

License
Creative Commons License

All content on Tim Bovee, Private Trader by Timothy K. Bovee is licensed under a Creative Commons Attribution-ShareAlike 4.0 International License.

Based on a work at www.timbovee.com.

Trader’s Notebook

3:30 p.m. New York time

Half an hour before the closing bell. Elliott Wave Theory says: The S&P 500 futures continued to work their way through a 4th-wave downward correction of low degree. So far it has retraced 41% of the preceding 3rd wave. A 4th wave typically ends within the 4th subwave of the preceding 3rd wave. This small correction has moved bellow that level.

I focus on the correction because of what comes next: A rising 5th wave that will complete the smaller correction, which began on May 16, also that larger rising 5th wave that began on May 8, and the still larger 3rd wave that began on May 2, which will be followed by a larger downward correction.

I’ve updated the chart.

9:35 a.m. New York time

What’s happening now? The S&P 500 E-mini futures dropped back into the 5320s overnight.

What does it mean? Elliott Wave Theory reads the decline as a continuation of the 4th-wave downward correction of low degree that began on May 16. In other words, nothing in the analysis has really changed since yesterday.

Although the correction is small, two degrees below Minuscule degree in the traditional nomenclature, the fractal structure of the market’s price movements gives it significance far greater than its size.

Looking ahead, the end of the 4th-wave correction will also be the beginning of a 5th-wave uptrend. When the 5th wave is complete, it will also be completion of two nested 5th waves, each one degree higher in the fractal structure, the uptrending waves that began on May 14 and May 8. It will also mark the end of a 3rd-degree uptrend one degree higher, which began on May 2.

And so it goes. The English poet John Donne, in the beginning lines of a poem published in 1624, said it best: “No man is an island / entire of itself; / Every man is a piece of the continent, / A part of the main.”

In Elliott Wave Theory’s fractal structure, no wave stands alone.

What are the alternatives? Also unchanged. The four smallest waves on the chart — labeled 4{-10}, 5{-9}, 5{-8} and 3{-7} — may in fact be one degree larger, eliminating the next higher degree, wave 1{-6}. See the Reading the Chart section below for an explanation of wave labeling, including the curly brackets.

[S&P 500 E-mini futures at 3:30 p.m., 100-minute bars, with volume]

What does Elliott wave theory say? Here are the waves that underly the analyses.

Principal Analysis:

  • Rising wave 5{0} is underway. It is a wave of Intermediate degree that began in December 2018.
  • It is in its final subwave, wave 5{-1}.
  • Within wave 5{-1}, rising waves 3{-2}, 3{-3} and 3{-4} are underway, as is wave 5{-5}.
  • Wave 1{-6} is underway and is in its middle subwave, wave 3{-7}, which is in its final subwave, wave 5{-8}.
  • Wave 5{-8} is in its final subwave, wave 5{-9}, which is in its next-to-the-last subwave, wave 4{-10}.

Reading the chart. Price movements — waves – – in Elliott wave analysis are labeled with numbers within trending waves and letters with corrective waves. The subscripts — numbers in curly brackets — designate the wave’s degree, which, in Elliott wave analysis, means the relative position of a wave within the larger and smaller structures that make up the chart. R.N. Elliott, who in the 1930s developed the form of analysis that bears his name, viewed the chart as a complex structure of smaller waves nested within larger waves, which in turn are nested within still larger waves. In mathematics it’s called a fractal structure, where at every scale the pattern is similar to the others.

Learning and other resources. Elliott wave analysis provides context, not prophecy. As the 20th century semanticist Alfred Korzybski put it in his book Science and Sanity (1933), “The map is not the territory … The only usefulness of a map depends on similarity of structure between the empirical world and the map.” And I would add, in the ever-changing markets, we can judge that similarity of structure only after the fact.

See the menu page Analytical Methods for a rundown on where to go for information on Elliott wave analysis.

By Tim Bovee, Portland, Oregon, May 21, 2024

Disclaimer

Tim Bovee, Private Trader tracks the analysis and trades of a private trader for his own accounts. Nothing in this blog constitutes a recommendation to buy or sell stocks, options or any other financial instrument. The only purpose of this blog is to provide education and entertainment.

No trader is ever 100 percent successful in his or her trades. Trading in the stock and option markets is risky and uncertain. Each trader must make trading decisions for his or her own account, and take responsibility for the consequences.

License
Creative Commons License

All content on Tim Bovee, Private Trader by Timothy K. Bovee is licensed under a Creative Commons Attribution-ShareAlike 4.0 International License.

Based on a work at www.timbovee.com.

Trader’s Notebook

3:30 p.m. New York time

Half an hour before the closing bell. The S&P 500 futures swung up into the 5340s during the session and fell down into the 5320s, returning to the 5330s as the closing bell approached.

Were Shakespeare analyzing this session chart, he would pronounce it “full of sound and fury, signifying nothing.” Elliott Wave Theory, however, is far less skilled with words than the Bard, and pronounces the chart, “A continuation of the 4th-wave downward correction that began on May 16.”

I love Shakespeare for the beauty of his prose, but spend more time with Elliott Wave Theory for the clarity of its conclusions.

The session high, 5348.75, is likely the end of the second of three waves within the correction, the B wave, and the declining wave that followed is the final wave in the correction, a C wave. The B wave has three subwaves, so unless there’s a reversal above that peak, the B wave is history.

A 5th-wave uptrend of low degree will follow the C wave.

I’ve updated the chart.

9:35 a.m. New York time

What’s happening now? The S&P 500 E-mini futures traded narrowly after trading resumed overnight, rising into the 5330s in the first 5 minutes and staying within that range thereafter.

What does it mean? Elliott Wave Theory sees the overnight pattern as a continuation of the 4th-wave downward correction of low degree that began on May 16. The correction is part of a larger, although still low degree, 5th-wave uptrend that began on May 14.

From that point, as we climb the fractal structure of the chart, we encounter a nested series of uptrending waves that are underway: A 5th-wave uptrend that began on May 8; 3rd wave, May 2; 1st-wave, April 18th wave; 5th wave, April 18.

Each 5th wave, when complete, will signal the end of its parent wave. Each 3rd or 1st wave, when complete, will be followed by a downward correction.

The nested series of waves listed above will be followed by a series of nested 3rd waves of increasing size, covering 4 degrees.

All of this is happening within a 5th-wave uptrend that began on October 13, 2022 from 3502.

For my daily trading I follow the waves of lower degree. However, it’s important to remember that the waves of higher degree have the ability to upset the economy and indeed the wellbeing the nation.

When the 5th-wave uptrend that began on October 13, 2022 is complete, it will trigger the end of a nested series of 5th waves that began on March 6 2009, December 9, 1974 and July 8, 1932.

The downtrend that follows will be an event for the history books.

What are the alternatives? Returning to the more recent waves of low degree, the four smallest waves on the chart — labeled 4{-10}, 5{-9}, 5{-8} and 3{-7} — may in fact be one degree larger, eliminating the next higher degree, wave 1{-6}. See the Reading the Chart section below for an explanation of wave labeling, including the curly brackets.

[S&P 500 E-mini futures at 3:30 p.m., 100-minute bars, with volume]

What does Elliott wave theory say? Here are the waves that underly the analyses.

Principal Analysis:

  • Rising wave 5{0} is underway. It is a wave of Intermediate degree that began in December 2018.
  • It is in its final subwave, wave 5{-1}.
  • Within wave 5{-1}, rising waves 3{-2}, 3{-3} and 3{-4} are underway, as is wave 5{-5}.
  • Wave 1{-6} is underway and is in its middle subwave, wave 3{-7}, which is in its final subwave, wave 5{-8}.
  • Wave 5{-8} is in its final subwave, wave 5{-9}, which is in its next-to-the-last subwave, wave 4{-10}.

Big Picture.

These are the higher-degree waves currently in progress under my principal analysis. Each line on the list shows the wave number, with the subscript in curly brackets, the traditional degree name, the starting date, the starting price of the S&P 500 E-mini futures, and the direction of the wave.

  • S&P 500 Index:
  • 5{+3} Supercycle, 7/8/1932, 4.40 (up)
  • 5{+2} Cycle, 12/9/1974, 60.96 (up)
  • 5{+1} Primary, 3/6/2009, 666.79 (up)
  • 5{0} Intermediate, 12/26/2018, 2346.58 (up)
  • S&P 500 Futures and Index:
  • 5{-1} Minor, 10/13/2022, 3502 (up) (futures), 3491.58 (up) (index)

Reading the chart. Price movements — waves – – in Elliott wave analysis are labeled with numbers within trending waves and letters with corrective waves. The subscripts — numbers in curly brackets — designate the wave’s degree, which, in Elliott wave analysis, means the relative position of a wave within the larger and smaller structures that make up the chart. R.N. Elliott, who in the 1930s developed the form of analysis that bears his name, viewed the chart as a complex structure of smaller waves nested within larger waves, which in turn are nested within still larger waves. In mathematics it’s called a fractal structure, where at every scale the pattern is similar to the others.

Learning and other resources. Elliott wave analysis provides context, not prophecy. As the 20th century semanticist Alfred Korzybski put it in his book Science and Sanity (1933), “The map is not the territory … The only usefulness of a map depends on similarity of structure between the empirical world and the map.” And I would add, in the ever-changing markets, we can judge that similarity of structure only after the fact.

See the menu page Analytical Methods for a rundown on where to go for information on Elliott wave analysis.

By Tim Bovee, Portland, Oregon, May 20, 2024

Disclaimer

Tim Bovee, Private Trader tracks the analysis and trades of a private trader for his own accounts. Nothing in this blog constitutes a recommendation to buy or sell stocks, options or any other financial instrument. The only purpose of this blog is to provide education and entertainment.

No trader is ever 100 percent successful in his or her trades. Trading in the stock and option markets is risky and uncertain. Each trader must make trading decisions for his or her own account, and take responsibility for the consequences.

License
Creative Commons License

All content on Tim Bovee, Private Trader by Timothy K. Bovee is licensed under a Creative Commons Attribution-ShareAlike 4.0 International License.

Based on a work at www.timbovee.com.

Trader’s Notebook

3:30 p.m. New York time

Half an hour before the closing bell. The S&P 500 futures continued to trade sideways during the session, bumping down below 5310 at one point and quickly recovering. This morning’s Elliott Wave analysis is unchanged: A low degree 4th wave, within an increasingly larger series of uptrending waves, continues.

I’ve updated the chart.

9:35 a.m. New York time

What’s happening now? The S&P 500 E-mini futures traded sideways overnight, remaining in the 5210s and 5220s.

What does it mean? Elliott Wave Theory sees the pause as a downward correction within the low-degree uptrending 5th wave that began on May 14. The small uptrend is happening within a series of larger uptrends stretching back to 2018 and beyond, back to the 1930s, all part of the complex fractal structure of market price movements.

What are the alternatives? Elliott Wave analysis in in part subjective, like any pattern recognition process. The four smallest waves on the chart — labeled 4{-10}, 5{-9}, 5{-8} and 3{-7} — may in fact be one degree larger, eliminating the next higher degree, wave 1{-6}. See the Reading the Chart section below for an explanation of wave labeling, including the curly brackets.

[S&P 500 E-mini futures at 3:30 p.m., 95-minute bars, with volume]

What does Elliott wave theory say? Here are the waves that underly the analyses.

Principal Analysis:

  • Rising wave 5{0} is underway. It is a wave of Intermediate degree that began in December 2018.
  • It is in its final subwave, wave 5{-1}.
  • Within wave 5{-1}, rising waves 3{-2}, 3{-3} and 3{-4} are underway, as is wave 5{-5}.
  • Wave 1{-6} is underway and is in its middle subwave, wave 3{-7}, which is in its final subwave, wave 5{-8}.
  • Wave 5{-8} is in its final subwave, wave 5{-9}, which is in its next-to-the-last subwave, wave 4{-10}.

We Are Here.

These are the waves currently in progress under my principal analysis. Each line on the list shows the wave number, with the subscript in curly brackets, the traditional degree name, the starting date, the starting price of the S&P 500 E-mini futures, and the direction of the wave.

  • S&P 500 Index:
  • 5{+3} Supercycle, 7/8/1932, 4.40 (up)
  • 5{+2} Cycle, 12/9/1974, 60.96 (up)
  • 5{+1} Primary, 3/6/2009, 666.79 (up)
  • 5{0} Intermediate, 12/26/2018, 2346.58 (up)

Reading the chart. Price movements — waves – – in Elliott wave analysis are labeled with numbers within trending waves and letters with corrective waves. The subscripts — numbers in curly brackets — designate the wave’s degree, which, in Elliott wave analysis, means the relative position of a wave within the larger and smaller structures that make up the chart. R.N. Elliott, who in the 1930s developed the form of analysis that bears his name, viewed the chart as a complex structure of smaller waves nested within larger waves, which in turn are nested within still larger waves. In mathematics it’s called a fractal structure, where at every scale the pattern is similar to the others.

Learning and other resources. Elliott wave analysis provides context, not prophecy. As the 20th century semanticist Alfred Korzybski put it in his book Science and Sanity (1933), “The map is not the territory … The only usefulness of a map depends on similarity of structure between the empirical world and the map.” And I would add, in the ever-changing markets, we can judge that similarity of structure only after the fact.

See the menu page Analytical Methods for a rundown on where to go for information on Elliott wave analysis.

By Tim Bovee, Portland, Oregon, May 17, 2024

Disclaimer

Tim Bovee, Private Trader tracks the analysis and trades of a private trader for his own accounts. Nothing in this blog constitutes a recommendation to buy or sell stocks, options or any other financial instrument. The only purpose of this blog is to provide education and entertainment.

No trader is ever 100 percent successful in his or her trades. Trading in the stock and option markets is risky and uncertain. Each trader must make trading decisions for his or her own account, and take responsibility for the consequences.

License
Creative Commons License

All content on Tim Bovee, Private Trader by Timothy K. Bovee is licensed under a Creative Commons Attribution-ShareAlike 4.0 International License.

Based on a work at www.timbovee.com.

Trader’s Notebook

3:30 p.m. New York Time

Half an hour before the closing bell. The S&P 500 futures continued to fall during the session, reaching into the 5320s. Elliott Wave Theory: The small 4th-degree downward correction that began at the overnight high continues.

I’ve updated the chart.

9:35 a.m. New York time

What’s happening now? The S&P 500 E-mini futures rose gently into the 5340s overnight and then pulled back slightly.

What does it mean? Elliott Wave Theory sees the rise as a continuation of the 5th-wave uptrend that began on April 18 from 4963.50. The rise carried the price beyond the end of the prior 3rd wave of the same degree, 5333.50 on March 31.

In the discussion that follows, I’ll include the wave labeling on the chart, with each wave number followed by a subscript in curly brackets telling the degree’s distance from the much larger Intermediate degree. The present Intermediate degree, wave 5{0}, began in December 2018, and the 5th-wave uptrend that began on April 18 is wave 5{-5}, which is five degrees smaller that the Intermediate degree.

The upward push, at a low degree, is a 5th-wave uptrend that began on May 14, wave 5{-9}. In yesterday’s analysis I wrote that the 5th wave was in its 5th subwave (wave 5{-10}. As it turns out, yesterday’s rise was the 3rd subwave (wave 3{-10}, ending at the overnight peak, and the slight subwave that followed is the 4th subwave (wave 4{-10}. By that count, the wave 5{-9} has one more uptrending subwave to go before reaching its end.

The end of the low-degree 5th wave will work its way up the fractal structure of the chart, also marking the end of the 5th wave that began on May 8 (wave 5{-8} and the 3rd wave that began on May 2 {wave 3{-7}.

A 4th-wave downward correction will follow {wave 4{-7}}, followed by a 5th-wave rise (wave 5{-7}) that will complete the 1st subwave (wave 1{-6}) of the 5th-wave uptrend that began on April 18 (wave 5{-5}).

What are the alternatives? That 1st wave labeling, wave 1{-6}, may be problematic. It seemed likely that the 1st wave within the 5th-wave uptrend, wave 5{-5}, was still underway, given the size of other movements of that degree. Price movements — waves – – in Elliott wave analysis are labeled with numbers within trending waves and letters with corrective waves. But what if the waves below wave 1{-6} continue to stretch out the time taken to reach completion? It’s possible that what I’ve labeled as wave 5{-7} should really be labeled as wave 5{-6}, eliminating the problematic 1st wave and moving everything within it up one degree.

[S&P 500 E-mini futures at 3:30 p.m., 85-minute bars, with volume]

What does Elliott wave theory say? Here are the waves that underly the analyses.

Principal Analysis:

  • Rising wave 5{0} is underway. It is a wave of Intermediate degree that began in December 2018.
  • It is in its final subwave, wave 5{-1}.
  • Within wave 5{-1}, rising waves 3{-2}, 3{-3} and 3{-4} are underway, as is wave 5{-5}.
  • Wave 1{-6} is underway and is in its middle subwave, wave 3{-7}, which is in its final subwave, wave 5{-8}.
  • Wave 5{-8} is in its final subwave, wave 5{-9}, which is in its next-to-the-last subwave, wave 4{-10}.

Reading the chart. Price movements — waves – – in Elliott wave analysis are labeled with numbers within trending waves and letters with corrective waves. The subscripts — numbers in curly brackets — designate the wave’s degree, which, in Elliott wave analysis, means the relative position of a wave within the larger and smaller structures that make up the chart. R.N. Elliott, who in the 1930s developed the form of analysis that bears his name, viewed the chart as a complex structure of smaller waves nested within larger waves, which in turn are nested within still larger waves. In mathematics it’s called a fractal structure, where at every scale the pattern is similar to the others.

Learning and other resources. Elliott wave analysis provides context, not prophecy. As the 20th century semanticist Alfred Korzybski put it in his book Science and Sanity (1933), “The map is not the territory … The only usefulness of a map depends on similarity of structure between the empirical world and the map.” And I would add, in the ever-changing markets, we can judge that similarity of structure only after the fact.

See the menu page Analytical Methods for a rundown on where to go for information on Elliott wave analysis.

By Tim Bovee, Portland, Oregon, May 16, 2024

Disclaimer

Tim Bovee, Private Trader tracks the analysis and trades of a private trader for his own accounts. Nothing in this blog constitutes a recommendation to buy or sell stocks, options or any other financial instrument. The only purpose of this blog is to provide education and entertainment.

No trader is ever 100 percent successful in his or her trades. Trading in the stock and option markets is risky and uncertain. Each trader must make trading decisions for his or her own account, and take responsibility for the consequences.

License
Creative Commons License

All content on Tim Bovee, Private Trader by Timothy K. Bovee is licensed under a Creative Commons Attribution-ShareAlike 4.0 International License.

Based on a work at www.timbovee.com.

Trader’s Notebook

3:30 p.m. New York time

Half an hour before the closing bell. The S&P 500 futures continued to rise during the session, breaking past 5330. Elliott Wave Theory: The 3rd-wave uptrend that began on May 2 continues to work through its endgame.

I’ve updated the chart.

9:35 a.m. New York time

What’s happening now? The S&P 500 E-mini futures rose after the Consumer Price Index was released, from 5271 to 5303 in a single minute.

What does it mean? In Elliott Wave Theory, the rise was the 5th and final wave within an extremely small uptrend that began from Tuesday’s low, 5216.75. When that final wave is complete, it will also be the end of the parent wave, also a 5th wave, and of the next wave higher in the fractal structure of the price pattern, also a 5th wave.

The waves are labeled on the chart with the wave number followed by a subscript, in curly brackets showing how many degrees distant the wave is from Intermediate degree. The present Intermediate degree, wave 5{0}, began December 2018.

The smallest of the 5th waves listed above is wave 5{-10}, the parent wave is wave 5{-9}, and the next wave up is wave 5{-8}. All are positioned within a 3rd wave that began on May 2, wave 3{-7} from 5036.25. The simultaneous end of the smaller 5th waves will also be the end of that 3rd wave and the beginning a downward correction, wave 4{-7}, which will be followed by a 5th-wave uptrend that will complete the initial wave of the uptrend that began on April 18, wave 1{-6}.

What are the alternatives? Unchanged from yesterday. Is all of this really happening within wave 1{-6}, or should the wave placed at degree {-7} be labeled as degree {-6}, with the subwaves below being promoted by one degree. Impossible to say at this point. Time will tell.

[S&P 500 E-mini futures at 3:30 p.m., 85-minute bars, with volume]

What does Elliott wave theory say? Here are the waves that underly the analysis.

Principal Analysis:

  • Rising wave 5{0} is underway. It is a wave of Intermediate degree that began in December 2018.
  • It is in its final subwave, wave 5{-1}.
  • Within wave 5{-1}, rising waves 3{-2}, 3{-3} and 3{-4} are underway, as is wave 5{-5}.
  • Wave 1{-6} is underway and is in its middle subwave, wave 3{-7}, which is in its final subwave, wave 5{-8}.
  • Wave 5{-8} is in its final subwave, wave 5{-9}, which is in its final subwave, wave 5{-10}.

Reading the chart. Price movements — waves – – in Elliott wave analysis are labeled with numbers within trending waves and letters with corrective waves. The subscripts — numbers in curly brackets — designate the wave’s degree, which, in Elliott wave analysis, means the relative position of a wave within the larger and smaller structures that make up the chart. R.N. Elliott, who in the 1930s developed the form of analysis that bears his name, viewed the chart as a complex structure of smaller waves nested within larger waves, which in turn are nested within still larger waves. In mathematics it’s called a fractal structure, where at every scale the pattern is similar to the others.

Learning and other resources. Elliott wave analysis provides context, not prophecy. As the 20th century semanticist Alfred Korzybski put it in his book Science and Sanity (1933), “The map is not the territory … The only usefulness of a map depends on similarity of structure between the empirical world and the map.” And I would add, in the ever-changing markets, we can judge that similarity of structure only after the fact.

See the menu page Analytical Methods for a rundown on where to go for information on Elliott wave analysis.

By Tim Bovee, Portland, Oregon, May 15, 2024

Disclaimer

Tim Bovee, Private Trader tracks the analysis and trades of a private trader for his own accounts. Nothing in this blog constitutes a recommendation to buy or sell stocks, options or any other financial instrument. The only purpose of this blog is to provide education and entertainment.

No trader is ever 100 percent successful in his or her trades. Trading in the stock and option markets is risky and uncertain. Each trader must make trading decisions for his or her own account, and take responsibility for the consequences.

License
Creative Commons License

All content on Tim Bovee, Private Trader by Timothy K. Bovee is licensed under a Creative Commons Attribution-ShareAlike 4.0 International License.

Based on a work at www.timbovee.com.

Trader’s Notebook

3:30 p.m. New York time

Half an hour before the closing bell. The S&P 500 futures rose during the session into the 5270s. Applying Elliott Wave Theory: The movement indicates that the low degree 4th-wave downward correction (wave 4{-9} on the chart) is complete, and the 5th-wave uptrend (wave 5{-9}) has begun.

When wave 5{-9} is complete, it will also be the end of uptrending wave 5{-8}, one degree higher, and of uptrending wave wave 3{-7}, another degree higher.

Wave 3{-7} began on May 2 from 5036.25. A 4th-wave downward correction will follow — wave 4{-7} — and is likely to end within the 4th subwave of the 3rd wave within wave 3{-7}. That would give wave 4{-7} a price target in the upper 5160s / lower 5170s. That target is a tendency, not a firm rule.

I’ve updated the chart.

9:35 a.m. New York time

What’s happening now? The S&P 500 E-mini futures fell sharply an hour before the opening bell, from the 5250s to the 5210s. The drop, which coincided with the release of the Producer Price Index, quickly returned to its prior level.

What does it mean? The payment producers received from end users — consumers, the government, export and capital investment — rose by 0.5 points from the prior month, potentially an indicator of inflation. The PPI often triggers changes in the public mood, and that public mood is what drives stock prices and Elliott Wave Theory’s analysis.

In this case the decline, while rapid, was relatively small. Elliott Wave Theory sees it as a subwave within a 4th-wave correction within a 5th-wave uptrend that began on May 8.

When the 4th wave correction is complete, it will be followed by a 5th-wave rise that will be the final wave of the larger 5th wave, the uptrend that began on May 8.

Big picture: That uptrend is the final wave of a 3rd-wave uptrend that began on May 2, which in turn is a subwave of a 1st-wave uptrend that began on April 18.

Waves on the chart are labeled by the wave number, followed by a subscript that shows how far the wave is from the Intermediate degree. The distance is stated in degrees within the fractal structure of the chart. The present Intermediate degree — wave 5{0} — began in December 2018.

The waves discussed above are labeled as follows on the chart: Wave 4{-9}, a downward correction, within wave 5{-8}, an uptrend, which in turn is a subwave of wave 3{-7}, a subwave of wave 1{-6}, the initial subwave within uptrending wave 5{-5}, which began on April 18.

A 5th wave, the final wave of a larger trend, has no clear price target. The 5th wave usually moves beyond the end of the preceding 3rd wave, although sometimes it falls short.

In this case, wave 5{-8} has already moved beyond the end of wave 3{-8}. And sometimes a 5th wave will extend, traveling an unusually large distance for its position in the fractal structure of the chart. And there’s no telling what this 5th wave will do until it happens.

Wave 5{-5} has not yet reached the end of the preceding 3rd wave. Wave 3{-5} ended on March 31 at 5333.50.

What are the alternatives? Critics of Elliott Wave Theory point to its ambiguities, and it is true that wave patterns often lack clarity. There is an ambiguity that has been with us for some time on this chart. I’ve counted the 5th wave that began on April 18 (wave 5{-5} on the chart) as being in its 1st subwave (wave 1{-6} on the chart). It’s possible that the subwave of wave 1{-6} (wave 3{-7} on the chart) is in fact the immediate subwave of wave 5{-5}, meaning that the 5th-wave uptrend is further along than the principal analysis would have it.

[S&P 500 E-mini futures at 3:30 p.m., 80-minute bars, with volume]

What does Elliott wave theory say? Here are the waves that underly the analyses.

Principal Analysis:

  • Rising wave 5{0} is underway. It is a wave of Intermediate degree that began in December 2018.
  • It is in its final subwave, wave 5{-1}.
  • Within wave 5{-1}, rising waves 3{-2}, 3{-3} and 3{-4} are underway, as is wave 5{-5}.
  • Wave 1{-6} is underway and is in its middle subwave, wave 3{-7}, which is in its final subwave, wave 5{-8}.
  • Wave 5{-8} is in its next-to-the-last subwave, wave 4{-9}.

We Are Here.

These are waves of larger degree currently in progress under my principal analysis, from Intermediate degree to the Supercycle degree. Each line on the list shows the wave number, with the subscript in curly brackets, the traditional degree name, the starting date, the starting price of the S&P 500 E-mini futures, and the direction of the wave.

  • S&P 500 Index:
  • 5{+3} Supercycle, 7/8/1932, 4.40 (up)
  • 5{+2} Cycle, 12/9/1974, 60.96 (up)
  • 5{+1} Primary, 3/6/2009, 666.79 (up)
  • 5{0} Intermediate, 12/26/2018, 2346.58 (up)

Reading the chart. Price movements — waves – – in Elliott wave analysis are labeled with numbers within trending waves and letters with corrective waves. The subscripts — numbers in curly brackets — designate the wave’s degree, which, in Elliott wave analysis, means the relative position of a wave within the larger and smaller structures that make up the chart. R.N. Elliott, who in the 1930s developed the form of analysis that bears his name, viewed the chart as a complex structure of smaller waves nested within larger waves, which in turn are nested within still larger waves. In mathematics it’s called a fractal structure, where at every scale the pattern is similar to the others.

Learning and other resources. Elliott wave analysis provides context, not prophecy. As the 20th century semanticist Alfred Korzybski put it in his book Science and Sanity (1933), “The map is not the territory … The only usefulness of a map depends on similarity of structure between the empirical world and the map.” And I would add, in the ever-changing markets, we can judge that similarity of structure only after the fact.

See the menu page Analytical Methods for a rundown on where to go for information on Elliott wave analysis.

By Tim Bovee, Portland, Oregon, May 14, 2024

Disclaimer

Tim Bovee, Private Trader tracks the analysis and trades of a private trader for his own accounts. Nothing in this blog constitutes a recommendation to buy or sell stocks, options or any other financial instrument. The only purpose of this blog is to provide education and entertainment.

No trader is ever 100 percent successful in his or her trades. Trading in the stock and option markets is risky and uncertain. Each trader must make trading decisions for his or her own account, and take responsibility for the consequences.

License
Creative Commons License

All content on Tim Bovee, Private Trader by Timothy K. Bovee is licensed under a Creative Commons Attribution-ShareAlike 4.0 International License.

Based on a work at www.timbovee.com.