3:30 p.m. New York time
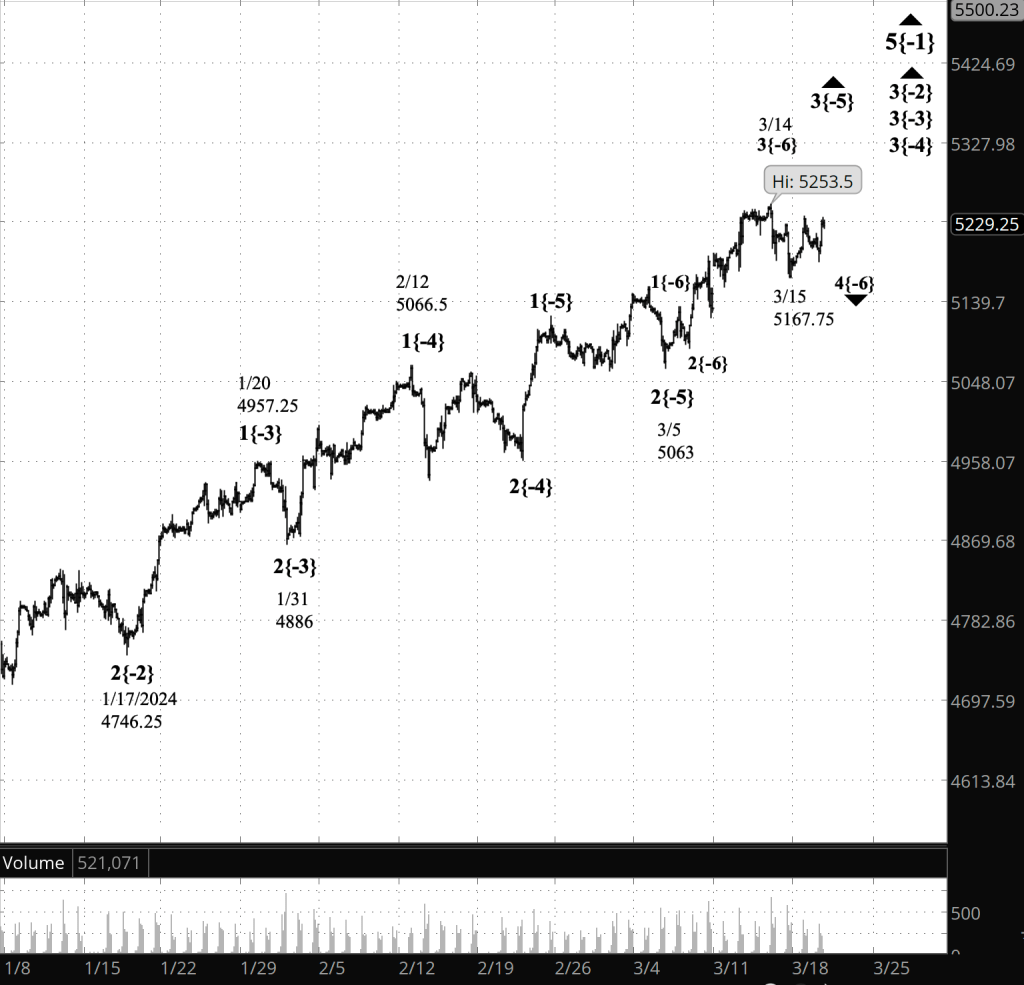
Half an hour before the closing bell. The S&P 500 futures continued to fall during the session, reaching into the 5280s. The further the decline, the greater the likelihood that the the principal analysis is the better match for the reality of the chart: A 4th wave decline has begun.
In Elliott Wave Theory, 4th waves tend to end within the 4th subwave of the preceding 3rd wave of the same degree. On the chart, that would be in the range of wave 4{-6} within wave 3{-5}, from 5253.50 down to 5167.75. I’ve marked the range boundaries with dashed red lines.
That target range represents a tendency, not a firm rule. The correction could turn out to be shallower or deeper than the target range would suggest.
The subwaves of wave the preceding 3rd wave uptrend took one or two weeks to reach completion. Under the Elliott Wave proportionality tendency, the subwaves of the present declining 4th wave can be expected to take about the same amount of time. A 4th wave has three subwaves. If wave A is the shortest of the lot (one week) and the other two each lasts for two weeks, then we can expect correction to last seven weeks or so, carrying the chart into May. Plus or minus who knows what. It’s a tendency, not a rule.
Rather than updating the morning’s close-up chart, I’ve added a new chart for the afternoon analysis, showing the preceding 3rd wave in its entirely followed the early steps of the 4th wave.
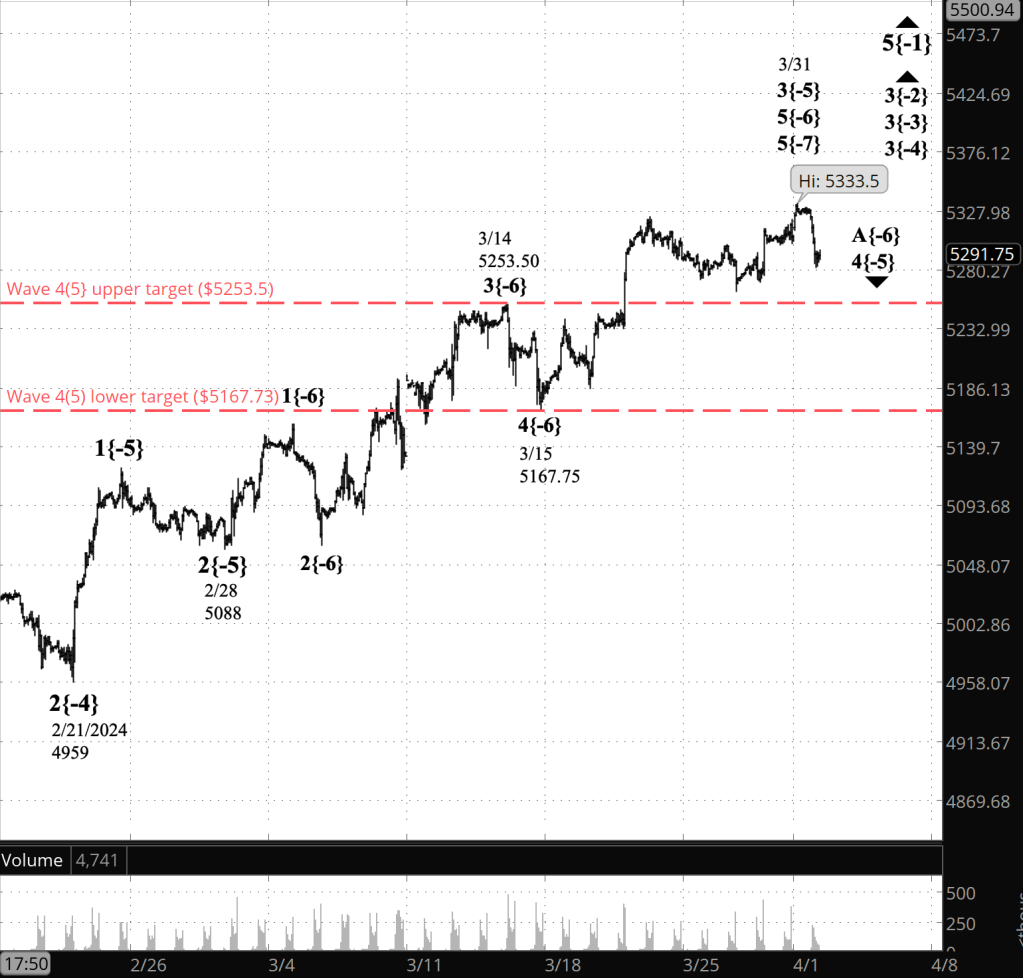
[S&P 500 E-mini futures at 3:30 p.m., 70-minute bars, with volume]
9:35 a.m. New York time
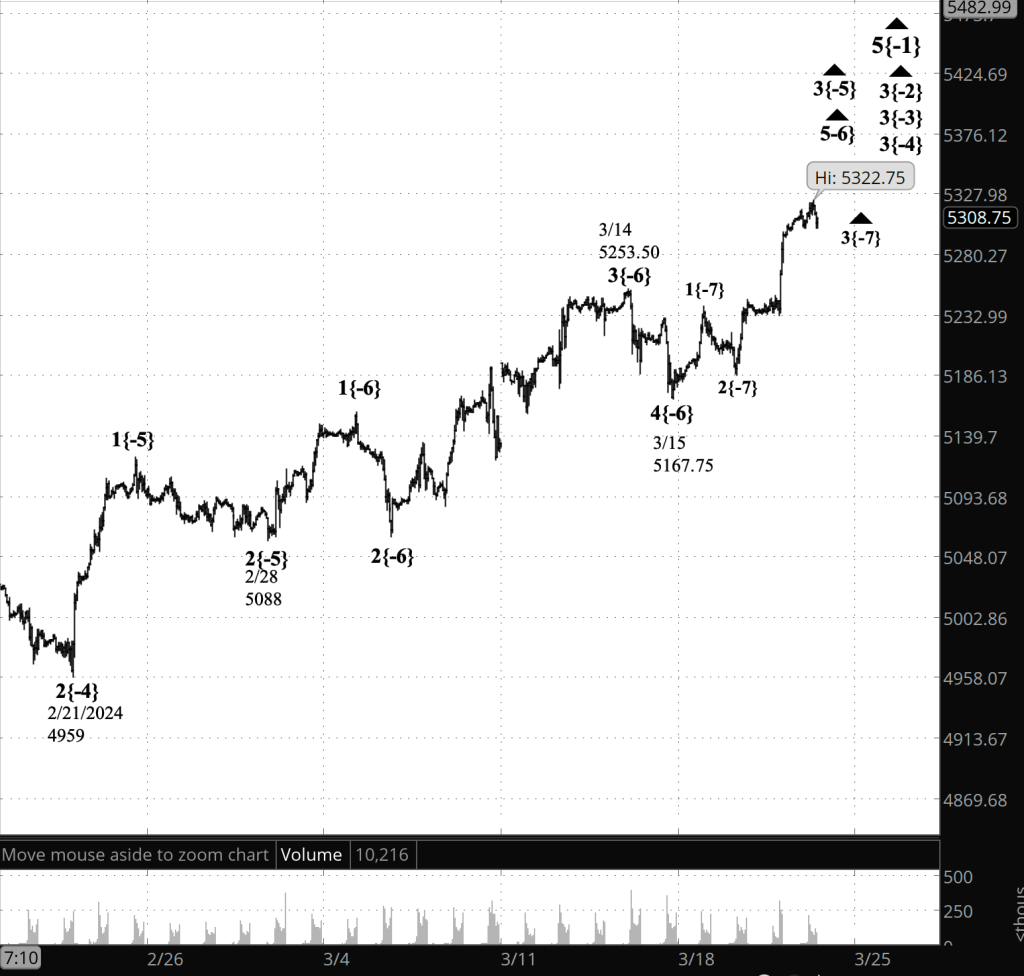
What’s happening now? The S&P 500 E-mini futures peaked at 5333.50 shortly after trading resumed overnight, and then dropped almost to 5310.
What does it mean? The 3rd wave uptrend that began on February 28 has ended, and a 4th-wave downward correction has begun.
Applying Elliott Wave Theory: The peak came as the 5th-wave uptrend that began on March 29 was in the 5th subwave of its rise. The the decline that followed can be counted as being in its 3rd subwave, although the structure of the 11 hours of sideways trading after the peak lacks clarity. The subsequent sharper decline is in its 3rd subwave.
What to make of all of this? The fact that the 5th wave uptrend is in its 5th subwave means that any new high could be its end. The 5th wave is itself the final subwave of a larger 5th wave uptrend that began on March 15. Up one more degree, the end of the two smaller 5th waves also means the end of a larger 5th wave, whose end is the end of a still larger 3rd wave that began on February 28 from 5088.
What follows the 3rd wave is a 4th-wave correction, which is in its 1st subwave, an A wave.
The waves appear on the chart appear with subscript’s in curly brackets showing the relative distance of each wave’s degree from Intermediate degree, which has a degree designation of {0}.
In the above discussion, the ending waves, small to large, are wave 5{-8} within wave 5{-7} within wave A{-6}, all three within wave 3{-5}. The beginning waves are wave 1{-8} within wave 1{-7} within wave 1{-6}, all of them subwaves of wave 4{-5}.
Wave 4{-5} is a downward correction.
What are the alternatives? As always, assigning degree designators to the first tentative steps of a larger wave is an uncertain proposition. Also, is this decline actually the start of a 4th wave correction, as the principal anaysis has it, or is it a subwave of the ongoing 5th-wave uptrend, as an alternative analysis? It looks very much like a correction to my eyes, but it hasn’t proceeded far enough to be absolutely certain.
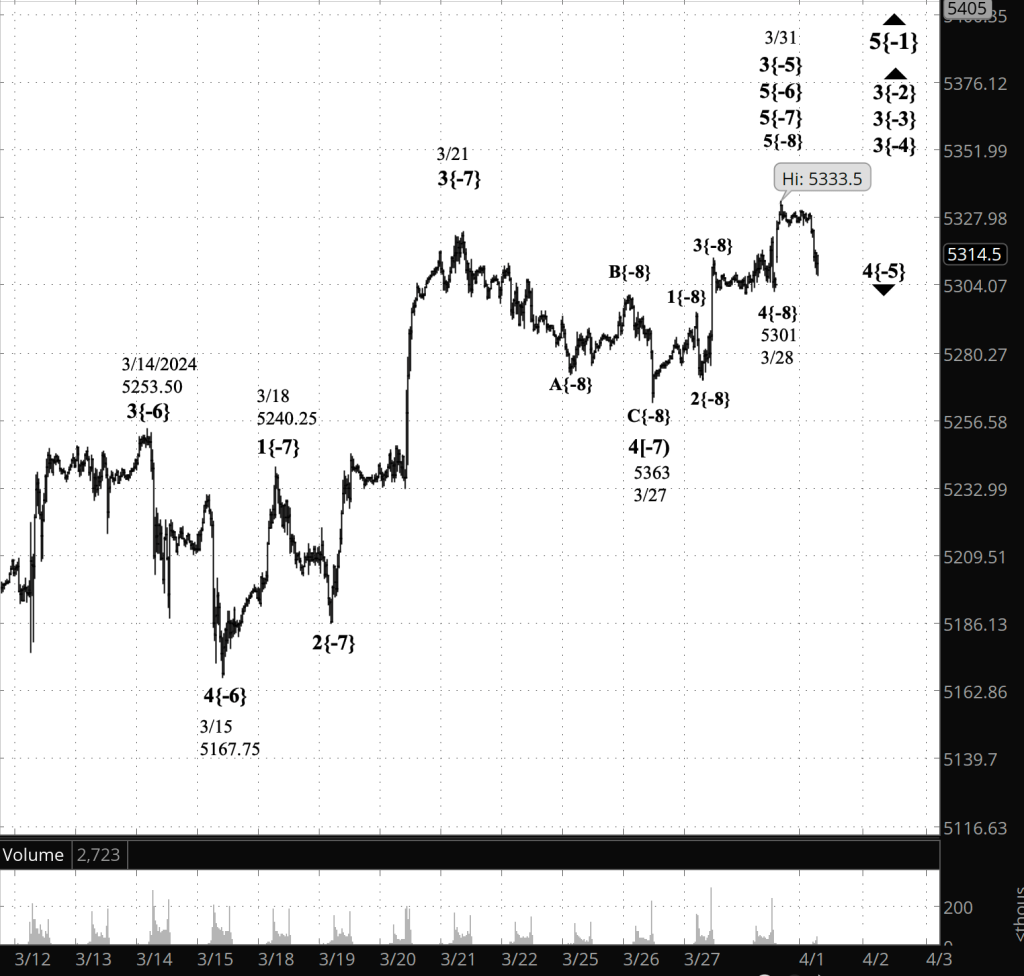
[S&P 500 E-mini futures at 9:35 a.m., 30-minute bars, with volume]
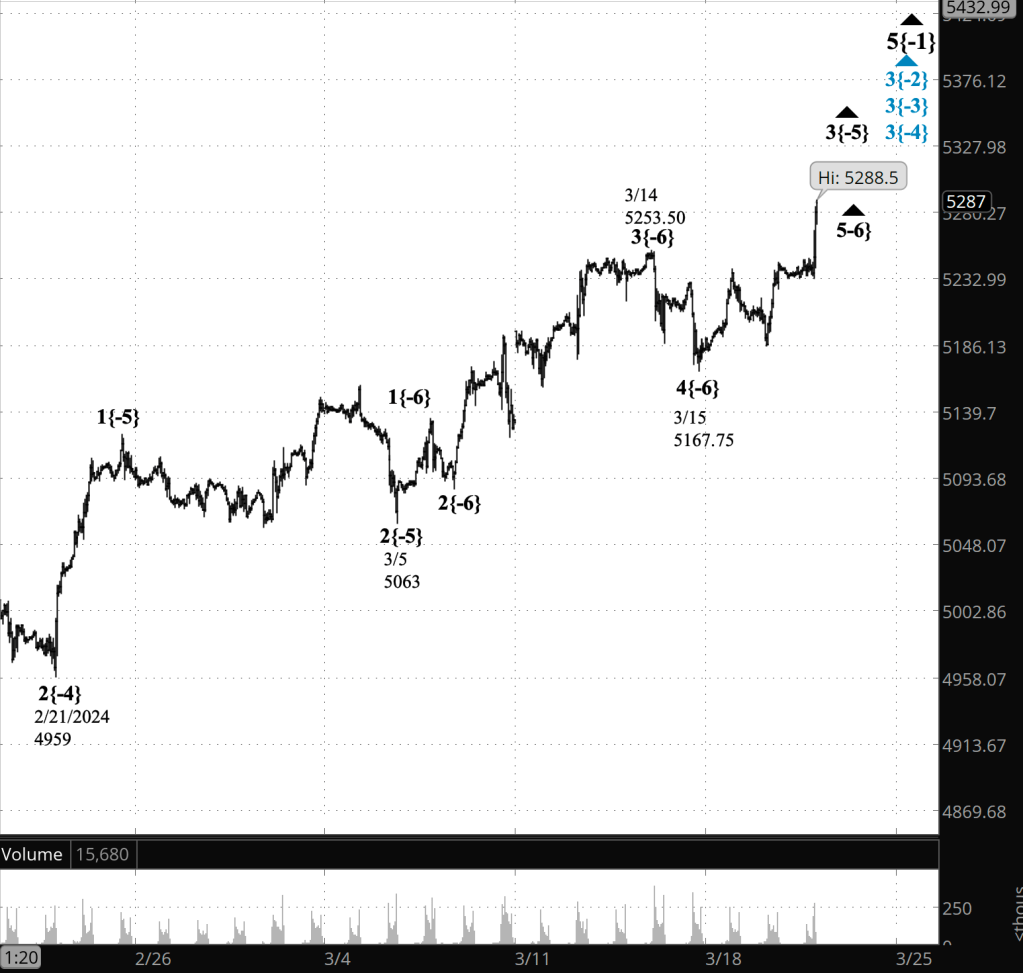
What does Elliott wave theory say? Here are the waves that underly the analyses.
Principal Analysis:
- Rising wave 5{0} is underway.
- It is in its final subwave, wave 5{-1}
- Within wave 5{-1}, rising waves 3{-2}, 3{-3} and 3{-4} are underway, as is the smallest wave labeled on the chart, wave 3{-5}.
- Downtrending wave 4{-5} is in its 1st subwave, wave A{-6}.
Reading the chart. Price movements — waves – – in Elliott wave analysis are labeled with numbers within trending waves and letters with corrective waves. The subscripts — numbers in curly brackets — designate the wave’s degree, which, in Elliott wave analysis, means the relative position of a wave within the larger and smaller structures that make up the chart. R.N. Elliott, who in the 1930s developed the form of analysis that bears his name, viewed the chart as a complex structure of smaller waves nested within larger waves, which in turn are nested within still larger waves. In mathematics it’s called a fractal structure, where at every scale the pattern is similar to the others.
Learning and other resources. Elliott wave analysis provides context, not prophecy. As the 20th century semanticist Alfred Korzybski put it in his book Science and Sanity (1933), “The map is not the territory … The only usefulness of a map depends on similarity of structure between the empirical world and the map.” And I would add, in the ever-changing markets, we can judge that similarity of structure only after the fact.
See the menu page Analytical Methods for a rundown on where to go for information on Elliott wave analysis.
By Tim Bovee, Portland, Oregon, April 1, 2024
Disclaimer
Tim Bovee, Private Trader tracks the analysis and trades of a private trader for his own accounts. Nothing in this blog constitutes a recommendation to buy or sell stocks, options or any other financial instrument. The only purpose of this blog is to provide education and entertainment.
No trader is ever 100 percent successful in his or her trades. Trading in the stock and option markets is risky and uncertain. Each trader must make trading decisions for his or her own account, and take responsibility for the consequences.
License
All content on Tim Bovee, Private Trader by Timothy K. Bovee is licensed under a Creative Commons Attribution-ShareAlike 4.0 International License.
Based on a work at www.timbovee.com.


You must be logged in to post a comment.