Trader’s Notebook

3:30 p.m. New York time

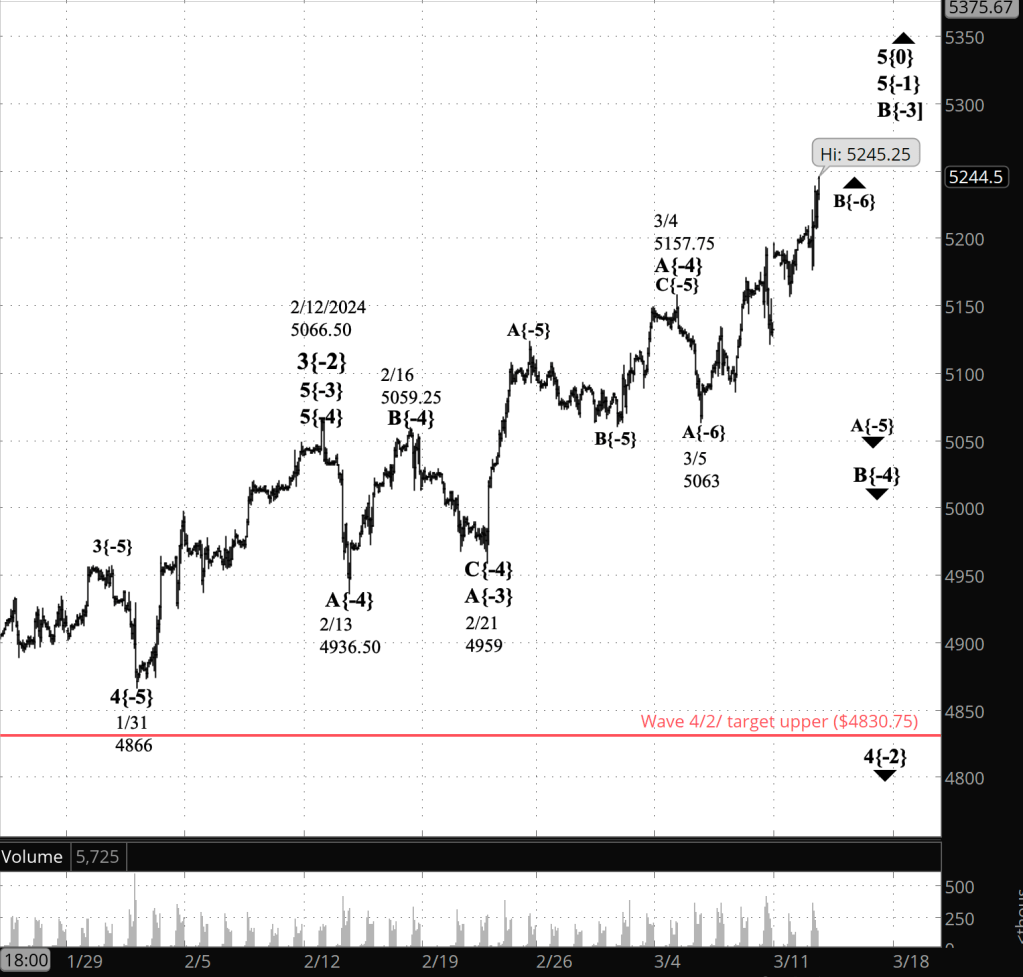
Half an hour before the closing bell. The S&P 500 futures have fallen during the session, so far reaching into the 5160s. The decline is a downward correction within a 3rd-wave uptrend that began on March 5. The small uptrend is part of a series of 3rd-wave uptrends of increasingly larger size, all subwaves of a 5th-wave uptrend that began on October 27, 2023.

I’ve updated the lower (close-up) chart.

9:35 a.m. New York time

What’s happening now? The S&P 500 E-mini futures rose to higher high overnight.

What does it mean? A low-degree 3rd wave that began on March 5 continues, a subwave buried three-degrees deep within a major uptrendng 3rd-wave that began on January 17.

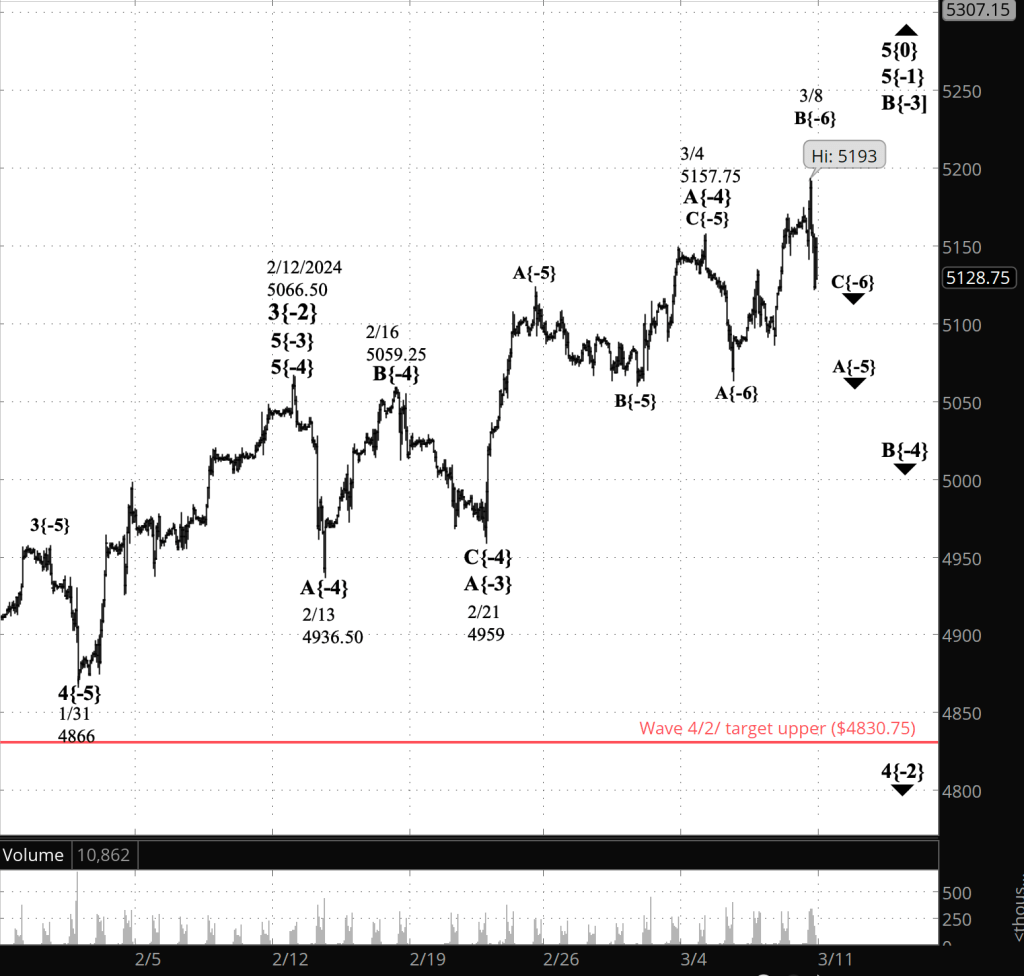
That’s the close-up view. However, today’s Elliott Wave analysis will focus on the bigger picture. The Wednesday, March 13, afternoon analysis produced a problem in the close-up wave count: The low-degree B wave under discussion had five internal waves. B waves have three internal waves.

Indeed, the rise looked very much like a five-way uptrend.

A brief aside: Elliott Wave Theory is one of the most frustrating methods I’ve used for chart analysis. And yet, it has kept me focused directionally in my trading, with an eye to the big picture as well as the day’s price action.

Two major difficulties:

  • Subjectivity: Different analysts can come up with different wave counts, reflecting conflicting interpretations and predictions.
  • Hindsight Bias: It’s often easier to fit wave patterns to historical data than to accurately predict future waves.

I find Elliott Wave Theory to be fascinating and have used it for 40 years, but because of those two characteristics, I’m not a true believer. I approach any chart mark-up with a great deal of scepticism.

After all, in this Private Trader project, which is in its fourth year, time and time again the analysis has bumped up against a rule of Elliott Wave Theory and required a reanalysis.

That’s what has happened this week, yet again.

The goal of my reanalysis was to retain the rise that began on October 13, 2022 as an uptrend and to transform the rise that began on October 27, 2023 into a trending wave rather than an upward correction, all the while staying within the rules of Elliott Wave Theory.

To fix it, I had to go back to the January 4, 2022 high and find a way to analyze the subsequent fall and then rise into a three-subwave correction and then a five-subwave rising impulse wave.

In the process of doing so, the expanding Diagonal Triangle that began in December 2018, a wave that has long encompassed everything that is happening on the chart, had to be disgarded. With an expanding Diagonal Triangle, the 4th wave had to at least approach the triangle’s lower boundary. This 4th wave didn’t come close, so clearly something else was going wrong.

The top chart below is my reanalysis, from the January 4, 2022 peak to the present.

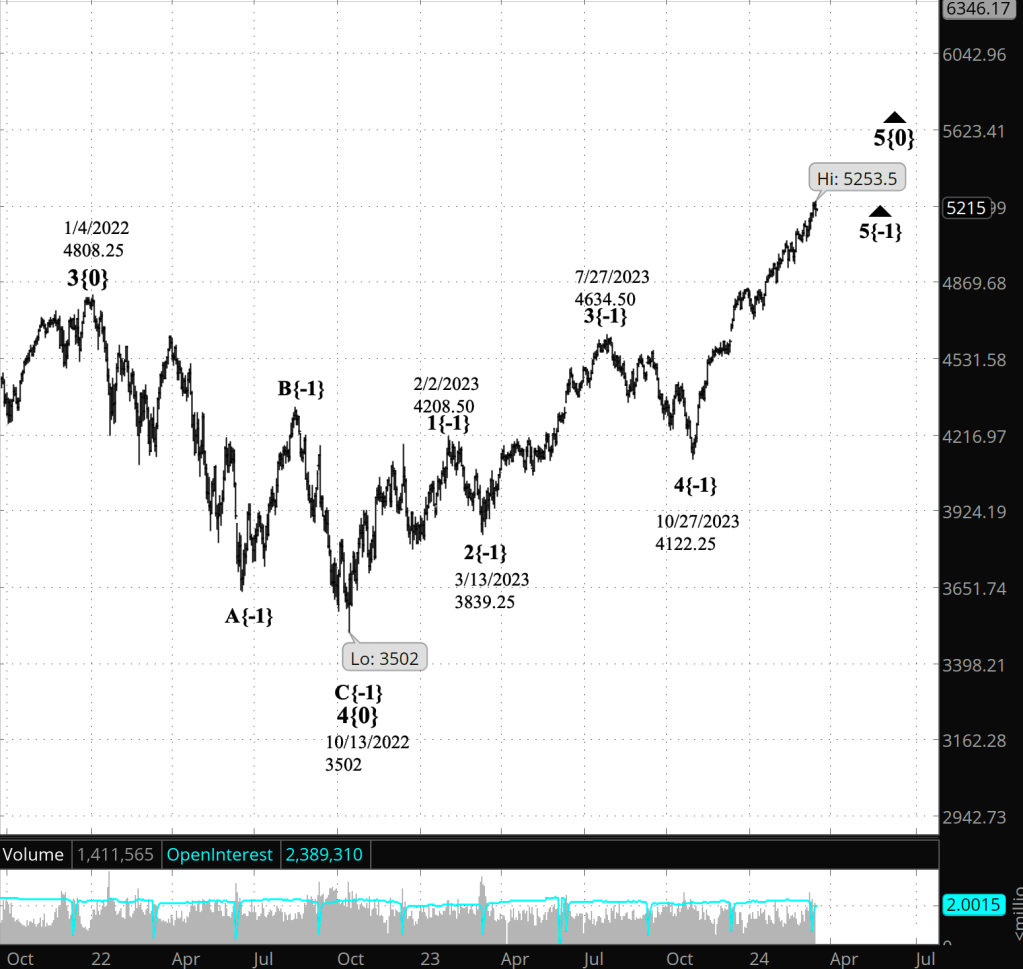
[S&P 500 E-mini futures at the prior day’s session close, daily bars, with volume]

Closer up, I’ve numbered four encompassing degrees of subwaves within the rise from October 27.

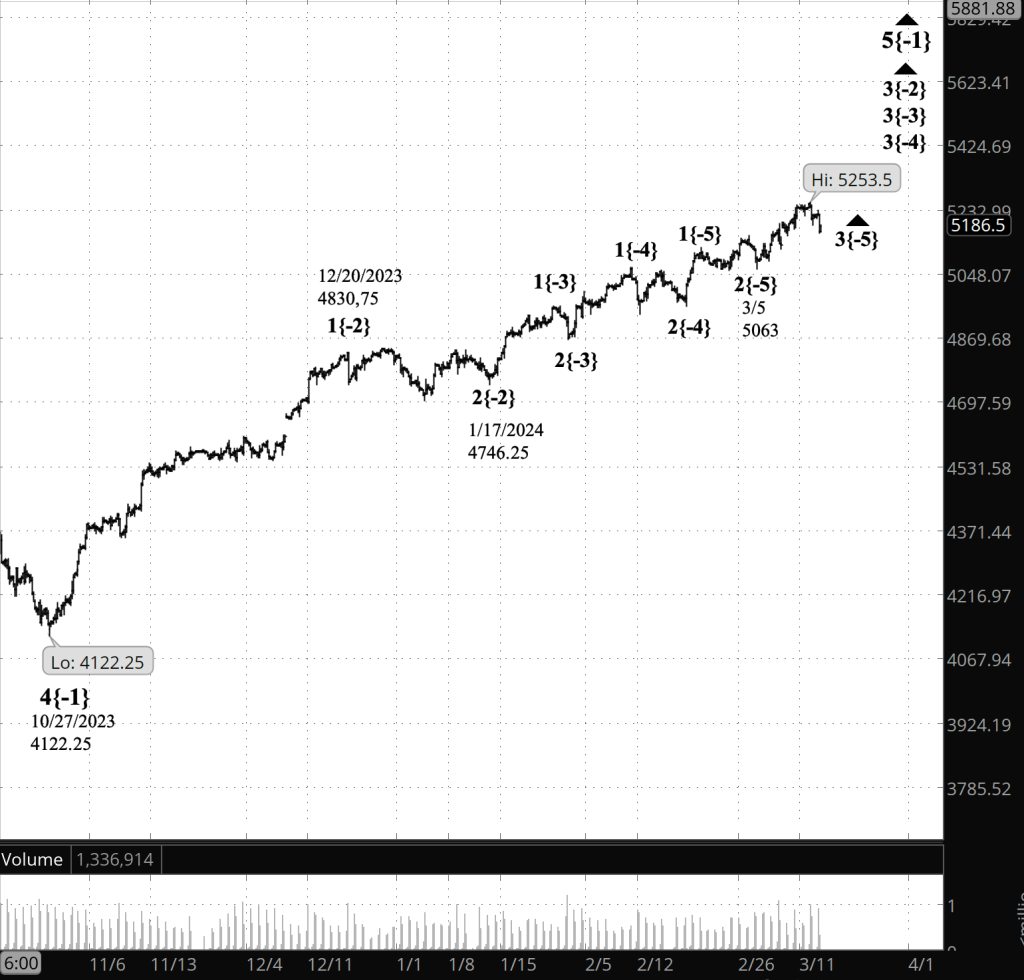
[S&P 500 E-mini futures at 3:30 p.m., 4-hour bars, with volume]

The low-degree 5th wave that began on March 5 — wave 3{-5} on the chart — will be followed by a 4th-wave downward correction and then a 5th-wave push to the upside. Across three degrees larger, the parent waves are all 3rd waves and so are far from their end.

On Monday I’ll discuss my revisions prior to the January 4, 2022 peak.

What are the alternatives? As usual, there is uncertainty over the proper place of the waves within the fractal structure of the chart. For example, should wave 4{0} really be listed as the {0} degree, or is it really a {-1} degree, pushing the later {-1} degree labels down to the {-2} degree. See the “Reading the chart” section below for more on degrees and their labeling,

What does Elliott wave theory say? Here are the waves that underly the analyses.

Principal Analysis:

  • Rising wave 5{0} is underway.
  • It is in its final subwave, wave 5{-1}
  • Within wave 5{-1}, rising waves 3{-2}, 3{-3} and 3{-4} are underway, as is the smallest wave labeled on the chart, wave 3{-5}.

Reading the chart. Price movements — waves – – in Elliott wave analysis are labeled with numbers within trending waves and letters with corrective waves. The subscripts — numbers in curly brackets — designate the wave’s degree, which, in Elliott wave analysis, means the relative position of a wave within the larger and smaller structures that make up the chart. R.N. Elliott, who in the 1930s developed the form of analysis that bears his name, viewed the chart as a complex structure of smaller waves nested within larger waves, which in turn are nested within still larger waves. In mathematics it’s called a fractal structure, where at every scale the pattern is similar to the others.

Learning and other resources. Elliott wave analysis provides context, not prophecy. As the 20th century semanticist Alfred Korzybski put it in his book Science and Sanity (1933), “The map is not the territory … The only usefulness of a map depends on similarity of structure between the empirical world and the map.” And I would add, in the ever-changing markets, we can judge that similarity of structure only after the fact.

See the menu page Analytical Methods for a rundown on where to go for information on Elliott wave analysis.

By Tim Bovee, Portland, Oregon, March 15, 2024

Disclaimer

Tim Bovee, Private Trader tracks the analysis and trades of a private trader for his own accounts. Nothing in this blog constitutes a recommendation to buy or sell stocks, options or any other financial instrument. The only purpose of this blog is to provide education and entertainment.

No trader is ever 100 percent successful in his or her trades. Trading in the stock and option markets is risky and uncertain. Each trader must make trading decisions for his or her own account, and take responsibility for the consequences.

License
Creative Commons License

All content on Tim Bovee, Private Trader by Timothy K. Bovee is licensed under a Creative Commons Attribution-ShareAlike 4.0 International License.

Based on a work at www.timbovee.com.

Options Trades 3/14/2024: SPY

Symbols traded: SPY short Iron Fly (1DTE)

With the week’s economic reports out out of the way and the implied volatility rank having fallen to just above 20, I resumed my very short-term trades — in one day before expiration, out on expiration day.

The short call, with a $513 strike, was assigned. This revision covers to options portion of the trade. I’ll add a section on the stock portion.

SPY short Iron Fly

LOT:11ENTRY DATE:3/14/2024
MANAGEMENT:3/15/2024EXPIRATION:3/15/2024
DAYS HELD:1

Entry and Exit

METRICENTRYEXITCHANGECHANGE %ANNUALIZED CHANGE %
Options premium$ 2.75$ 0.26$ 3.01109.5%39732%
Stock price$ 513.44$ 511.24$ (2.20)-0.4%-156%
Impllied Volatility Rate20.720.4-0.3
Days to expiration10

The structure of the position

STRUCTURESTRIKEODDS EXPIRE OTMDELTAIN PRICEOUT PRICENET PRICE
Calls
Long516.0084.0%17$ (0.30)$ 0.02$ (0.28)
Break-even515.7563.5%37.5
Short513.0043.0%58$ 1.49$ –$ 1.49
Puts
Short513.0053.0%46$ 2.38$ (2.92)$ (0.54)
Break-even510.7565.0%34.5
Long508.0077.0%23$ (0.82)$ 0.41$ (0.41)
======
`NET TOTAL:$ 0.26

Risk and Reward

Per contract:
Reward275.00
Risk125.00
R/R Ratio (n:1)0.5

By Tim Bovee, Portland, Oregon, March 14-15, 2024

Disclaimer

Tim Bovee, Private Trader tracks the analysis and trades of a private trader for his own accounts. Nothing in this blog constitutes a recommendation to buy or sell stocks, options or any other financial instrument. The only purpose of this blog is to provide education and entertainment.

No trader is ever 100 percent successful in his or her trades. Trading in the stock and option markets is risky and uncertain. Each trader must make trading decisions for his or her own account, and take responsibility for the consequences.

License
Creative Commons License

All content on Tim Bovee, Private Trader by Timothy K. Bovee is licensed under a Creative Commons Attribution-ShareAlike 4.0 International License.

Based on a work at www.timbovee.com.

Trader’s Notebook

3:30 p.m. New York time

Half an hour before the closing bell. The S&P futures price fell during the session, reaching into the 5190s. The B wave — wave B{-6} on the chart — has five clear subwaves, and that’s not supposed to happen in Elliott Wave Theory.

I’ve labeled the chart as wave B{-6} having ended at the peak and wave C{-6} having begun its decline, although it has become clear that the labeling has probably been overtaken by events on the chart and will require revision.

The rise that began on February 21 looks very much like an uptrending impulse wave, with five subwaves. However, as it has played out, the 3rd subwave is shorter than the 1st and 5th subwaves, and that never happens under the rules of Elliott Wave Theory.

I’ve updated the chart. And will update the revision, perhaps by Friday, perhaps by Monday.

1:50 p.m. New York time

Trade. With the week’s economic reports out out of the way and the implied volatility rank having fallen, I resumed my very short-term trades — in one day before expiration, out on expiration day. I entered a short Iron Fly position on SPY with the intent of exiting the next day — expiration day — win, lose or draw. I’ve posted an analysis of the trade.

9:35 a.m. New York time

What’s happening now? The S&P 500 E-mini futures reached a new high overnight, 5253.50, and fell sharply after the Producer Price Index for February was released.

What does it mean? Elliott Wave Theory concludes that the higher high, 5253.50, once again extended the reach of the low degree rising wave B that began on March 4. And as is often the case, the higher high may in fact be the end of the wave and the beginning of the next wave down.

The decline after the release of the Producer Price Index carried the price into the 5230s.

The rising B wave is a subwave of a declining A wave one degree higher. Working our way up the fractal chain, the declining A wave is a subwave of a decling B wave, which is a subwave of a rising B wave within a still larger 4th-wave downward correction that began on February 12.

What are the alternatives? As I’ve noted before, the low-degree B-wave — wave B{-6} on the chart — has moved exceptionally high, suggesting that the wave labels may not accurately reflect each wave’s position within the fractal structure of the chart. Working on it.

The chart shows each wave number, followed by a subscript in curly brackets showing the waves distance from an Intermediate wave — in this case wave 5{0}, which began on December 26, 2018. See the “Reading the chart” section below for more on the degrees within the fractal structure of the chart.

[S&P 500 E-mini futures at 3:30 p.m., 80-minute bars, with volume]

What does Elliott wave theory say? Here are the waves that underly the analyses.

Principal Analysis:

  • Wave 5{0}, an expanding Diagonal Triangle, began on December 26, 2018.
  • Within it, an uptrend, wave 5{-1}, began on October 13, 2022 and is underway.
  • Wave 5{-1} is the parent wave of a downward correction, wave 4{-2}, that began on February 12, 2024.
  • Wave 4{-2} is in its second subwave, wave B{-3}, which in turn is in wave B{-4}, its middle subwave.
  • Wave B{-4} is in its initial subwave, wave A{-5}.
  • Internally, wave A{-5} is in its middle subwave, wave B{-6}.

We Are Here.

These are the waves currently in progress under my principal analysis. Each line on the list shows the wave number, with the subscript in curly brackets, the traditional degree name, the starting date, the starting price of the S&P 500 E-mini futures, and the direction of the wave.

  • S&P 500 Index:
  • 5{+3} Supercycle, 7/8/1932, 4.40 (up)
  • 5{+2} Cycle, 12/9/1974, 60.96 (up)
  • 5{+1} Primary, 3/6/2009, 666.79 (up)
  • 5{0} Intermediate, 12/26/2018, 2346.58 (up)
  • S&P 500 Futures and index:
  • 5{-1} Minor, 10/13/2022, 3502 (up) (futures), 3491.58 (up) (index)
  • S&P 500 Futures:
  • 4{-2} Minute, 2/12/2024, 5066.50 (down)
  • B{-3} Minuette, 2/21/2024, 4959 (up)

Reading the chart. Price movements — waves – – in Elliott wave analysis are labeled with numbers within trending waves and letters with corrective waves. The subscripts — numbers in curly brackets — designate the wave’s degree, which, in Elliott wave analysis, means the relative position of a wave within the larger and smaller structures that make up the chart. R.N. Elliott, who in the 1930s developed the form of analysis that bears his name, viewed the chart as a complex structure of smaller waves nested within larger waves, which in turn are nested within still larger waves. In mathematics it’s called a fractal structure, where at every scale the pattern is similar to the others.

Learning and other resources. Elliott wave analysis provides context, not prophecy. As the 20th century semanticist Alfred Korzybski put it in his book Science and Sanity (1933), “The map is not the territory … The only usefulness of a map depends on similarity of structure between the empirical world and the map.” And I would add, in the ever-changing markets, we can judge that similarity of structure only after the fact.

See the menu page Analytical Methods for a rundown on where to go for information on Elliott wave analysis.

By Tim Bovee, Portland, Oregon, March 14, 2024

Disclaimer

Tim Bovee, Private Trader tracks the analysis and trades of a private trader for his own accounts. Nothing in this blog constitutes a recommendation to buy or sell stocks, options or any other financial instrument. The only purpose of this blog is to provide education and entertainment.

No trader is ever 100 percent successful in his or her trades. Trading in the stock and option markets is risky and uncertain. Each trader must make trading decisions for his or her own account, and take responsibility for the consequences.

License
Creative Commons License

All content on Tim Bovee, Private Trader by Timothy K. Bovee is licensed under a Creative Commons Attribution-ShareAlike 4.0 International License.

Based on a work at www.timbovee.com.

Trader’s Notebook

3:30 p.m. New York time

Half an hour before the closing bell. The S&P 500 futures so far have remained below the overnight peak, dropping into the 5220s and then rising back before dropping still lower as the closing bell approached. My analysis is unchanged from this morning. I’ve updated the chart.

9:35 a.m. New York time

What’s happening now? The S&P 500 E-mini futures swung between the 5230s and the 5250s overnight, reaching a new high, 5247.50.

What does it mean? Elliott Wave Theory sees the chart as a rising B wave that began on March 4 continuing to search for its end point. Stock movements, always, are battles between the bulls and the bears. Team Bulls at this point continues to have an edge.

The B wave is a small part of a much larger 4th-wave downward correction that began on February 12. The correction’s price target, reflecting a tendency of 4th waves taking the Flat form, is within a upper boundary of 4830.75 (the red line on the chart) and 4702.

When wave B is complete, it will be followed by a declining C wave that will complete the parent wave, an A wave. Given the waves line-up, the downward correction will be on the chart for awhile.

See the “What does Elliott wave theory say” section, below, for an inventory of current waves, including where they stand in the fractal structure of the chart. See the “Reading the chart” section for a discussion of the fractal structure and a wave’s degree within it.

What are the alternatives? It’s getting a bit repetitious, but I have some doubts about the degree labeling used in my analysis. The present B wave seems overly long for its place in the fractal structure. Figuring it out will be a project for the weekend.

[S&P 500 E-mini futures at 3:30 p.m., 80-minute bars, with volume]

What does Elliott wave theory say? Here are the waves that underly the analyses.

Principal Analysis:

  • Wave 5{0}, an expanding Diagonal Triangle, began on December 26, 2018.
  • Within it, an uptrend, wave 5{-1}, began on October 13, 2022 and is underway.
  • Wave 5{-1} is the parent wave of a downward correction, wave 4{-2}, that began on February 12, 2024.
  • Wave 4{-2} is in its second subwave, wave B{-3}, which in turn is in wave B{-4}, its middle subwave.
  • Wave B{-4} is in its initial subwave, wave A{-5}.
  • Internally, wave A{-5} is in its middle subwave, wave B{-6}.

We Are Here.

These are the waves currently in progress under my principal analysis. Each line on the list shows the wave number, with the subscript in curly brackets, the traditional degree name, the starting date, the starting price of the S&P 500 E-mini futures, and the direction of the wave.

  • S&P 500 Index:
  • 5{+3} Supercycle, 7/8/1932, 4.40 (up)
  • 5{+2} Cycle, 12/9/1974, 60.96 (up)
  • 5{+1} Primary, 3/6/2009, 666.79 (up)
  • 5{0} Intermediate, 12/26/2018, 2346.58 (up)
  • S&P 500 Futures and index:
  • 5{-1} Minor, 10/13/2022, 3502 (up) (futures), 3491.58 (up) (index)
  • S&P 500 Futures:
  • 4{-2} Minute, 2/12/2024, 5066.50 (down)
  • B{-3} Minuette, 2/21/2024, 4959 (up)

Reading the chart. Price movements — waves – – in Elliott wave analysis are labeled with numbers within trending waves and letters with corrective waves. The subscripts — numbers in curly brackets — designate the wave’s degree, which, in Elliott wave analysis, means the relative position of a wave within the larger and smaller structures that make up the chart. R.N. Elliott, who in the 1930s developed the form of analysis that bears his name, viewed the chart as a complex structure of smaller waves nested within larger waves, which in turn are nested within still larger waves. In mathematics it’s called a fractal structure, where at every scale the pattern is similar to the others.

Learning and other resources. Elliott wave analysis provides context, not prophecy. As the 20th century semanticist Alfred Korzybski put it in his book Science and Sanity (1933), “The map is not the territory … The only usefulness of a map depends on similarity of structure between the empirical world and the map.” And I would add, in the ever-changing markets, we can judge that similarity of structure only after the fact.

See the menu page Analytical Methods for a rundown on where to go for information on Elliott wave analysis.

By Tim Bovee, Portland, Oregon, March 13, 2024

Disclaimer

Tim Bovee, Private Trader tracks the analysis and trades of a private trader for his own accounts. Nothing in this blog constitutes a recommendation to buy or sell stocks, options or any other financial instrument. The only purpose of this blog is to provide education and entertainment.

No trader is ever 100 percent successful in his or her trades. Trading in the stock and option markets is risky and uncertain. Each trader must make trading decisions for his or her own account, and take responsibility for the consequences.

License
Creative Commons License

All content on Tim Bovee, Private Trader by Timothy K. Bovee is licensed under a Creative Commons Attribution-ShareAlike 4.0 International License.

Based on a work at www.timbovee.com.

Trader’s Notebook

3:30 p.m. New York time

Half an hour before the closing bell. The S&P 500 futures rose slightly during the session, reaching a new high in the 5240s so far. The small rising B-wave buried deep in the ongoing 4th-wave upward correction continues. I’ve updated the chart.

9:35 a.m. New York time

What’s happening now? The S&P 500 E-mini futures whipsawed when the Consumer Price Index was released, before the opening bell. The price ended up at a new high in the 5220s.

What does it mean? The new high confirmed that, at a low degree, the rising B wave that began on March 5 is still underway. That small B wave and its parent wave are seeking a top. Whenever they appear to have found it, they pull a surprise.

Elliott Wave Theory shows the small B wave — wave B{-6} on the chart — is in its fifth and final subwave.

This is all happening within a downward correction four degrees larger, wave 4{-2} on the chart, which began on February 12.

What are the alternatives? The chart continues to look unbalanced to me, and I’ll continue searching outr alternatives to test, all of which involve changing the degree designation for various groups of waves. That is to say, changing their place within the fractal structure of the chart.

On the chart, the degree designation appears as a subscript, within curly brackets, showing the wave’s position in the fractal hierarchy relative to the Intermediate degree, which is presently wave 5{0}, an expanding Diagonal Triangle that began on December 26, 2018.

[S&P 500 E-mini futures at 3:30 p.m., 80-minute bars, with volume]

What does Elliott wave theory say? Here are the waves that underly the analyses.

Principal Analysis:

  • Wave 5{0}, an expanding Diagonal Triangle, began on December 26, 2018.
  • Within it, an uptrend, wave 5{-1}, began on October 13, 2022 and is underway.
  • Wave 5{-1} is the parent wave of a downward correction, wave 4{-2}, that began on February 12, 2024.
  • Wave 4{-2} is in its second subwave, wave B{-3}, which in turn is in wave B{-4}, its middle subwave.
  • Wave B{-4} is in its initial subwave, wave A{-5}.
  • Internally, wave A{-5} is in its middle subwave, wave B{-6}.

We Are Here.

These are the waves currently in progress under my principal analysis. Each line on the list shows the wave number, with the subscript in curly brackets, the traditional degree name, the starting date, the starting price of the S&P 500 E-mini futures, and the direction of the wave.

  • S&P 500 Index:
  • 5{+3} Supercycle, 7/8/1932, 4.40 (up)
  • 5{+2} Cycle, 12/9/1974, 60.96 (up)
  • 5{+1} Primary, 3/6/2009, 666.79 (up)
  • 5{0} Intermediate, 12/26/2018, 2346.58 (up)
  • S&P 500 Futures and index:
  • 5{-1} Minor, 10/13/2022, 3502 (up) (futures), 3491.58 (up) (index)
  • S&P 500 Futures:
  • 4{-2} Minute, 2/12/2024, 5066.50 (down)
  • B{-3} Minuette, 2/21/2024, 4959 (up)

Reading the chart. Price movements — waves – – in Elliott wave analysis are labeled with numbers within trending waves and letters with corrective waves. The subscripts — numbers in curly brackets — designate the wave’s degree, which, in Elliott wave analysis, means the relative position of a wave within the larger and smaller structures that make up the chart. R.N. Elliott, who in the 1930s developed the form of analysis that bears his name, viewed the chart as a complex structure of smaller waves nested within larger waves, which in turn are nested within still larger waves. In mathematics it’s called a fractal structure, where at every scale the pattern is similar to the others.

Learning and other resources. Elliott wave analysis provides context, not prophecy. As the 20th century semanticist Alfred Korzybski put it in his book Science and Sanity (1933), “The map is not the territory … The only usefulness of a map depends on similarity of structure between the empirical world and the map.” And I would add, in the ever-changing markets, we can judge that similarity of structure only after the fact.

See the menu page Analytical Methods for a rundown on where to go for information on Elliott wave analysis.

By Tim Bovee, Portland, Oregon, March 12, 2024

Disclaimer

Tim Bovee, Private Trader tracks the analysis and trades of a private trader for his own accounts. Nothing in this blog constitutes a recommendation to buy or sell stocks, options or any other financial instrument. The only purpose of this blog is to provide education and entertainment.

No trader is ever 100 percent successful in his or her trades. Trading in the stock and option markets is risky and uncertain. Each trader must make trading decisions for his or her own account, and take responsibility for the consequences.

License
Creative Commons License

All content on Tim Bovee, Private Trader by Timothy K. Bovee is licensed under a Creative Commons Attribution-ShareAlike 4.0 International License.

Based on a work at www.timbovee.com.

Trader’s Notebook

3:30 p.m. New York time

Half an hour before the closing bell. The S&P 500 futures rose during the session, from the 5150s back into the 5190s. If the price moves above 5196 — the overnight high — then the principal analysis will switch the ongoing wave back to rising wave B, with the caveat that each new high could in fact be the end of wave B and the start of declining wave C.

I’ve updated the chart.

9:35 a.m. New York time

What’s happening now? The S&P 500 E-mini futures opened higher when trading resumed, at 5196, and immediately fell, into the 5160s so far.

What does it mean? Elliott Wave Theory analyzes the chart as follows: The downward correction that began on February 12 continues and is in its 3rd subwave, an A wave. On Friday I had labeled, on that chart, that day’s high as the end of a rising B wave four degrees lower in the correction, and the start of next wave, a declining C wave. The new high requires an adjustment, and the overnight high is now considered to be the end of wave B and the start of wave C.

That low-degree C wave is labeled wave C{-6}, with a subscript in curly brackets designating the degree’s relative position in the fractal structure of the chart. The {-6} means that it is six degrees lower in the structure than is the current Intermediate degree, to use the terminology of R.N. Elliott, who developed Elliott Wave Theory in the 1930s. The current Intermediate degree is wave 5{0}, which began on December 26, 2018.

See the “Reading the chart” section below for more on the fractal structure in Elliott’s theory, and the “What does Elliott Wave Theory say?” section and the “We Are Here” section for lists of waves, each with its starting price and date, and direction.

What are the alternatives? The biggest ambiguity is the degree placement: Should everything be moved up a degree? Or the smaller waves moved down a degree?

One glaringly obvious alternative that I looked at over the weekend is that the downward correction, wave 4{-2}, ended on February 21 at 4929 (that position is labeled as the end of a subwave, wave C{-4}, on the chart.) If that’s the end of wave 4{-2}, then uptrending wave 5{-2} began from that point and is presently underway.

I’ve marked the alternative wave numbers on the chart in blue, preceded by “Alt:”.

I concluded that the alternative doesn’t work. It would require that wave [Alt: 1{-3}] end on February 23 (the present label is wave A{-5}. [Alt: 2{-3}] would follow, with three subwaves, ending on March 5 (the present label is wave A{-6}.

And that’s where the problem lies. In a 2nd wave, the B subwave never moves beyond the 2nd wave’s starting point. Yet in the alternative count, wave [Alt: B{-4}] moves above the starting point of [Alt: A{-4}] and its parent, [Alt: 2{-3}].

In Elliott Wave Theory, that’s an error. And from it I conclude that wave 4{-2} is still underway and wave 5{-2} has not yet begun.

[S&P 500 E-mini futures at 3:30 p.m., 75-minute bars, with volume]

What does Elliott wave theory say? Here are the waves that underly the analyses.

Principal Analysis:

  • Wave 5{0}, an expanding Diagonal Triangle, began on December 26, 2018.
  • Within it, an uptrend, wave 5{-1}, began on October 13, 2022 and is underway.
  • Wave 5{-1} is the parent wave of a downward correction, wave 4{-2}, that began on February 12, 2024.
  • Wave 4{-2} is in its second subwave, wave B{-3}, which in turn is in wave B{-4}, its middle subwave.
  • Wave B{-4} is in its initial subwave, wave A{-5}.
  • Internally, wave A{-5} is in its final subwave, wave C{-6}.

We Are Here.

These are the waves currently in progress under my principal analysis. Each line on the list shows the wave number, with the subscript in curly brackets, the traditional degree name, the starting date, the starting price of the S&P 500 E-mini futures, and the direction of the wave.

  • S&P 500 Index:
  • 5{+3} Supercycle, 7/8/1932, 4.40 (up)
  • 5{+2} Cycle, 12/9/1974, 60.96 (up)
  • 5{+1} Primary, 3/6/2009, 666.79 (up)
  • 5{0} Intermediate, 12/26/2018, 2346.58 (up)
  • S&P 500 Futures and index:
  • 5{-1} Minor, 10/13/2022, 3502 (up) (futures), 3491.58 (up) (index)
  • S&P 500 Futures:
  • 4{-2} Minute, 2/12/2024, 5066.50 (down)
  • B{-3} Minuette, 2/21/2024, 4959 (up)

Reading the chart. Price movements — waves – – in Elliott wave analysis are labeled with numbers within trending waves and letters with corrective waves. The subscripts — numbers in curly brackets — designate the wave’s degree, which, in Elliott wave analysis, means the relative position of a wave within the larger and smaller structures that make up the chart. R.N. Elliott, who in the 1930s developed the form of analysis that bears his name, viewed the chart as a complex structure of smaller waves nested within larger waves, which in turn are nested within still larger waves. In mathematics it’s called a fractal structure, where at every scale the pattern is similar to the others.

Learning and other resources. Elliott wave analysis provides context, not prophecy. As the 20th century semanticist Alfred Korzybski put it in his book Science and Sanity (1933), “The map is not the territory … The only usefulness of a map depends on similarity of structure between the empirical world and the map.” And I would add, in the ever-changing markets, we can judge that similarity of structure only after the fact.

See the menu page Analytical Methods for a rundown on where to go for information on Elliott wave analysis.

By Tim Bovee, Portland, Oregon, March 11, 2024

Disclaimer

Tim Bovee, Private Trader tracks the analysis and trades of a private trader for his own accounts. Nothing in this blog constitutes a recommendation to buy or sell stocks, options or any other financial instrument. The only purpose of this blog is to provide education and entertainment.

No trader is ever 100 percent successful in his or her trades. Trading in the stock and option markets is risky and uncertain. Each trader must make trading decisions for his or her own account, and take responsibility for the consequences.

License
Creative Commons License

All content on Tim Bovee, Private Trader by Timothy K. Bovee is licensed under a Creative Commons Attribution-ShareAlike 4.0 International License.

Based on a work at www.timbovee.com.

Options Trades 3/8/2024: IWM

Symbols traded: A short Iron Condor position on IWM

The position expires in 42 days, on April 19. I intend to exit at 50% of potential profit or greater, or on management day, 21 days to expiration, March 29, whichever comes first.

IWM short Iron condor

LOT:4ENTRY DATE:3/8/2024
MANAGEMENT:3/29/2024EXPIRATION:4/19/2024
DAYS HELD:21

Entry and Exit

METRICENTRY
Options premium$ 1.08
Stock price$ 206.64
Impllied Volatility Rate43.5
Days to expiration42

The structure of the position

STRUCTURESTRIKEODDS EXPIRE OTMDELTAIN PRICE
Calls
Long221.0081.0%19$ (1.53)
Break-even219.0878.5%22
Short218.0076.0%25$ 2.13
Puts
Short195.0079.0%21$ 1.87
Break-even193.0881.5%18.5
Long192.0084.0%16$ (1.39)

Risk and Reward

Per contract:
Reward108.00
Risk192.00
R/R Ratio (n:1)1.8

By Tim Bovee, Portland, Oregon, March 8, 2024

Disclaimer

Tim Bovee, Private Trader tracks the analysis and trades of a private trader for his own accounts. Nothing in this blog constitutes a recommendation to buy or sell stocks, options or any other financial instrument. The only purpose of this blog is to provide education and entertainment.

No trader is ever 100 percent successful in his or her trades. Trading in the stock and option markets is risky and uncertain. Each trader must make trading decisions for his or her own account, and take responsibility for the consequences.

License
Creative Commons License

All content on Tim Bovee, Private Trader by Timothy K. Bovee is licensed under a Creative Commons Attribution-ShareAlike 4.0 International License.

Based on a work at www.timbovee.com.

Trader’s Notebook

3:30 p.m. New York time

Half an hour before the closing bell. The S&P 500 futures reached a peak of 5193 early in the session and then fell into the 5120s. The rising B wave that began on March 4 has three clear subwaves on the chart, as is the case with B waves, and then rapidity of the fall suggests a likelihood that the session peak marks the end of the B wave and the beginning of a decline C wave.

It remains possible that the price will reverse and move still higher, which would mean that the B wave has not yet ended.

On the chart, the waves with Elliott Wave Theory degree designators are B{-6} and C{-6}. I’ve updated the chart.

3 p.m. New York time

Trade. I’ve entered a short Iron Condor position on IWM, 42 days before expiration on April 19, with the intent of exiting at 50% or better of maximum potential profit or on management day, March 29, whichever comes first. I’ve posted an analysis of the trade.

9:35 a.m. New York time

What’s happening now? The S&P 500 E-mini futures whipsawed when the latest employment report was released, swinging from the 5150s to the 5140s and then to the 5170s, where the price settled before the opening bell.

What does it mean? In Elliott Wave Theory, the drama suggests that the rising middle subwave of a larger downward correction’s initial wave that began on March 4 is not yet complete…

What are the alternatives? … although, any high attained overnight or during the session could very well be the middle wave’s endpoint.

Whether the principal analysis or the alternative, these are small waves, buried within the 4th-wave downward correction that began on February 12. That larger 4th wave has a target range between 4830.75, the upper boundary shown in red on the chart, and 4702, the lower boundary.

Also, it’s possible that the placement of the waves within the fractal structure of the chart will need to be adjusted at some point.

[S&P 500 E-mini futures at 3:30 p.m., 70-minute bars, with volume]

What does Elliott wave theory say? Here are the waves that underly the analyses.

Principal Analysis:

  • Wave 5{0}, an expanding Diagonal Triangle, began on December 26, 2018.
  • Within it, an uptrend, wave 5{-1}, began on October 13, 2022 and is underway.
  • Wave 5{-1} is the parent wave of a downward correction, wave 4{-2}, that began on February 12, 2024.
  • Wave 4{-2} is in its second subwave, wave B{-3}, which in turn is in wave B{-4}, its middle subwave.
  • Wave B{-4} is in its initial subwave, wave A{-5}.
  • Internally, wave A{-5} is in its second subwave, wave B{-6}.

We Are Here.

These are the waves currently in progress under my principal analysis. Each line on the list shows the wave number, with the subscript in curly brackets, the traditional degree name, the starting date, the starting price of the S&P 500 E-mini futures, and the direction of the wave.

  • S&P 500 Index:
  • 5{+3} Supercycle, 7/8/1932, 4.40 (up)
  • 5{+2} Cycle, 12/9/1974, 60.96 (up)
  • 5{+1} Primary, 3/6/2009, 666.79 (up)
  • 5{0} Intermediate, 12/26/2018, 2346.58 (up)
  • S&P 500 Futures and index:
  • 5{-1} Minor, 10/13/2022, 3502 (up) (futures), 3491.58 (up) (index)
  • S&P 500 Futures:
  • 4{-2} Minute, 2/12/2024, 5066.50 (down)
  • B{-3} Minuette, 2/21/2024, 4959 (up)

Reading the chart. Price movements — waves – – in Elliott wave analysis are labeled with numbers within trending waves and letters with corrective waves. The subscripts — numbers in curly brackets — designate the wave’s degree, which, in Elliott wave analysis, means the relative position of a wave within the larger and smaller structures that make up the chart. R.N. Elliott, who in the 1930s developed the form of analysis that bears his name, viewed the chart as a complex structure of smaller waves nested within larger waves, which in turn are nested within still larger waves. In mathematics it’s called a fractal structure, where at every scale the pattern is similar to the others.

Learning and other resources. Elliott wave analysis provides context, not prophecy. As the 20th century semanticist Alfred Korzybski put it in his book Science and Sanity (1933), “The map is not the territory … The only usefulness of a map depends on similarity of structure between the empirical world and the map.” And I would add, in the ever-changing markets, we can judge that similarity of structure only after the fact.

See the menu page Analytical Methods for a rundown on where to go for information on Elliott wave analysis.

By Tim Bovee, Portland, Oregon, March 8, 2024

Disclaimer

Tim Bovee, Private Trader tracks the analysis and trades of a private trader for his own accounts. Nothing in this blog constitutes a recommendation to buy or sell stocks, options or any other financial instrument. The only purpose of this blog is to provide education and entertainment.

No trader is ever 100 percent successful in his or her trades. Trading in the stock and option markets is risky and uncertain. Each trader must make trading decisions for his or her own account, and take responsibility for the consequences.

License
Creative Commons License

All content on Tim Bovee, Private Trader by Timothy K. Bovee is licensed under a Creative Commons Attribution-ShareAlike 4.0 International License.

Based on a work at www.timbovee.com.

Trader’s Notebook

3:30 p.m. New York time

Half an hour before the closing bell. The S&P 500 futures continued to rise during the session, reaching into the 5170s and then pulling back slightly. The session high could be the end of the middle subwave, a B wave, within the low-degree downward correction that began on March 4 within a still larger upward correction. Or perhaps not. Absent evidence to the contrary, I’ve stayed with this morning’s analysis.

The low-degree B-wave that pulled back is listed on the chart as wave B{-6}. I’ve updated the chart.

2:05 p.m. New York time

Trade. Today was management day on my 45 DTE short Iron Condor position on IWM, and I exited for a 13.9% return after holding the position for 20 days. My rules for such trades say to exit a 45DTE position either when it reaches 50% of maximum potential profit, or 21 days prior to expiration — management day — whichever happens first. In this case, as it turns out management day won the race. I’ve updated the trade analysis with full results.

9:35 a.m. New York time

What’s happening now? The S&P 500 E-mini futures rose overnight, from the 5080s into the 5140s.

What does it mean? Elliott Wave Theory says that the low-degree downward correction that began on March 4 continues to work through its middle rising subwave, which is, at a smaller level, rising in its third and final subwave.

All of this is happening within a series of increasingly larger corrections, all of them subwaves of a 4th-wave downward correction that began on February 12 and that is in its second subwave, a B wave.

The present middle rising B wave within a small downward correction will be followed by a 3rd, and final, declining C wave, which will be the end of the parent degree, a declining A wave, and the beginning of a rising B wave within the larger correction.

On the chart, the waves in play are shown with their wave numbers and a subscript in curly brackets designating the wave’s position within the complex fractal structure of the chart.

The low-degree rising B wave is wave B{-6}, a subwave of falling wave A{-5}, within fallng wave, a subwave of rising wave B{-3}, which is the middle subwave of the large downward correction, wave 4{-2}. See the “Reading the chart” section below for more on degrees, labeling and the fractal structure of the chart.

The 4th wave downward correction has been underway for three weeks and will have more weeks to go before reaching its end. Elliott Wave Theory said that 4th waves have a tendency to end within the range of the 4th subwave of the preceding 3rd wave of the same degree. If that’s how the chart plays out, the 4th wave correction will end between 4830.75, the upper boundary shown in red on the chart, and 4702, the lower boundary.

What are the alternatives? There is some ambiguity about the degree designations, not an unusual state of affairs n Elliott Wave Analysis.

[S&P 500 E-mini futures at 3:30 p.m., 70-minute bars, with volume]

What does Elliott wave theory say? Here are the waves that underly the analyses.

Principal Analysis:

  • Wave 5{0}, an expanding Diagonal Triangle, began on December 26, 2018.
  • Within it, an uptrend, wave 5{-1}, began on October 13, 2022 and is underway.
  • Wave 5{-1} is the parent wave of a downward correction, wave 4{-2}, that began on February 12, 2024.
  • Wave 4{-2} is in its second subwave, wave B{-3}, which in turn is in wave B{-4}, its middle subwave.
  • Wave B{-4} is in its initial subwave, wave A{-5}.
  • Internally, wave A{-5} is in its second subwave, wave B{-6}.

We Are Here.

These are the waves currently in progress under my principal analysis. Each line on the list shows the wave number, with the subscript in curly brackets, the traditional degree name, the starting date, the starting price of the S&P 500 E-mini futures, and the direction of the wave.

  • S&P 500 Index:
  • 5{+3} Supercycle, 7/8/1932, 4.40 (up)
  • 5{+2} Cycle, 12/9/1974, 60.96 (up)
  • 5{+1} Primary, 3/6/2009, 666.79 (up)
  • 5{0} Intermediate, 12/26/2018, 2346.58 (up)
  • S&P 500 Futures and index:
  • 5{-1} Minor, 10/13/2022, 3502 (up) (futures), 3491.58 (up) (index)
  • S&P 500 Futures:
  • 4{-2} Minute, 2/12/2024, 5066.50 (down)
  • B{-3} Minuette, 2/21/2024, 4959 (up)

Reading the chart. Price movements — waves – – in Elliott wave analysis are labeled with numbers within trending waves and letters with corrective waves. The subscripts — numbers in curly brackets — designate the wave’s degree, which, in Elliott wave analysis, means the relative position of a wave within the larger and smaller structures that make up the chart. R.N. Elliott, who in the 1930s developed the form of analysis that bears his name, viewed the chart as a complex structure of smaller waves nested within larger waves, which in turn are nested within still larger waves. In mathematics it’s called a fractal structure, where at every scale the pattern is similar to the others.

Learning and other resources. Elliott wave analysis provides context, not prophecy. As the 20th century semanticist Alfred Korzybski put it in his book Science and Sanity (1933), “The map is not the territory … The only usefulness of a map depends on similarity of structure between the empirical world and the map.” And I would add, in the ever-changing markets, we can judge that similarity of structure only after the fact.

See the menu page Analytical Methods for a rundown on where to go for information on Elliott wave analysis.

By Tim Bovee, Portland, Oregon, March 7, 2024

Disclaimer

Tim Bovee, Private Trader tracks the analysis and trades of a private trader for his own accounts. Nothing in this blog constitutes a recommendation to buy or sell stocks, options or any other financial instrument. The only purpose of this blog is to provide education and entertainment.

No trader is ever 100 percent successful in his or her trades. Trading in the stock and option markets is risky and uncertain. Each trader must make trading decisions for his or her own account, and take responsibility for the consequences.

License
Creative Commons License

All content on Tim Bovee, Private Trader by Timothy K. Bovee is licensed under a Creative Commons Attribution-ShareAlike 4.0 International License.

Based on a work at www.timbovee.com.

Trader’s Notebook

3:30 p.m. New York time

Half an hour before the closing bell. The S&P 500 futures paused in their rise, remaining between the 5130s and just below 5100. In Elliott Wave Theory, the pause is most likely a correction within rising wave B{-6}. (See this morning’s “What does it mean” section for a discussion of wave B{-6}’s position in the fractal hierarchy.)

I’ve updated the chart.

9:35 a.m. New York time

What’s happening now? The S&P 500 E-mini futures rose overnight, from the 5080s into the 5120s.

What does it mean? The rising second subwave — wave B — of a declining larger B wave buried deep within a larger downward correction is underway.

Applying Elliott Wave Theory to the chart: The larger B wave is labeled B{-5}, and the smaller B wave is labelled B{-6}. The subscripts in brackets show the relative position of each wave within the fractal structure of the chart. The smaller the number in the subscript, the further down the fractal chain the wave resides. See “Reading the chart”, below.

The larger downward correction, wave 4{-2}, began on February 12. It is in its middle subwave, rising wave B{-3}. With wave B{-4} now underway and in its middle wave, B{-6}, rising wave B{-6} still has some time to go before it reaches completion.

Eventually, the downward correction, wave 4{-2}, encompassing all of the smaller subwaves mentioned above will reach its end and will be followed by an uptrending wave 5{-2} that will carry the price significantly higher.

What are the alternatives? As is often the case in Elliott Wave Analysis, there is some ambiguity about the degree designations. For example, should the end of wave A{-6} more accurately be labeled the end of wave A{-5}.

[S&P 500 E-mini futures at 9:35 a.m., 1-hour\ bars, with volume]

What does Elliott wave theory say? Here are the waves that underly the analyses.

Principal Analysis:

  • Wave 5{0}, an expanding Diagonal Triangle, began on December 26, 2018.
  • Within it, an uptrend, wave 5{-1}, began on October 13, 2022 and is underway.
  • Wave 5{-1} is the parent wave of a downward correction, wave 4{-2}, that began on February 12, 2024.
  • Wave 4{-2} is in its second subwave, wave B{-3}, which in turn is in wave B{-4}, its middle subwave.
  • Wave B{-4} is in its initial subwave, wave A{-5}.
  • Internally, wave A{-5} is in its second subwave, wave B{-6}.

We Are Here.

These are the waves currently in progress under my principal analysis. Each line on the list shows the wave number, with the subscript in curly brackets, the traditional degree name, the starting date, the starting price of the S&P 500 E-mini futures, and the direction of the wave.

  • S&P 500 Index:
  • 5{+3} Supercycle, 7/8/1932, 4.40 (up)
  • 5{+2} Cycle, 12/9/1974, 60.96 (up)
  • 5{+1} Primary, 3/6/2009, 666.79 (up)
  • 5{0} Intermediate, 12/26/2018, 2346.58 (up)
  • S&P 500 Futures and index:
  • 5{-1} Minor, 10/13/2022, 3502 (up) (futures), 3491.58 (up) (index)
  • S&P 500 Futures:
  • 4{-2} Minute, 2/12/2024, 5066.50 (down)
  • B{-3} Minuette, 2/21/2024, 4959 (up)

Reading the chart. Price movements — waves – – in Elliott wave analysis are labeled with numbers within trending waves and letters with corrective waves. The subscripts — numbers in curly brackets — designate the wave’s degree, which, in Elliott wave analysis, means the relative position of a wave within the larger and smaller structures that make up the chart. R.N. Elliott, who in the 1930s developed the form of analysis that bears his name, viewed the chart as a complex structure of smaller waves nested within larger waves, which in turn are nested within still larger waves. In mathematics it’s called a fractal structure, where at every scale the pattern is similar to the others.

Learning and other resources. Elliott wave analysis provides context, not prophecy. As the 20th century semanticist Alfred Korzybski put it in his book Science and Sanity (1933), “The map is not the territory … The only usefulness of a map depends on similarity of structure between the empirical world and the map.” And I would add, in the ever-changing markets, we can judge that similarity of structure only after the fact.

See the menu page Analytical Methods for a rundown on where to go for information on Elliott wave analysis.

By Tim Bovee, Portland, Oregon, March 6, 2024

Disclaimer

Tim Bovee, Private Trader tracks the analysis and trades of a private trader for his own accounts. Nothing in this blog constitutes a recommendation to buy or sell stocks, options or any other financial instrument. The only purpose of this blog is to provide education and entertainment.

No trader is ever 100 percent successful in his or her trades. Trading in the stock and option markets is risky and uncertain. Each trader must make trading decisions for his or her own account, and take responsibility for the consequences.

License
Creative Commons License

All content on Tim Bovee, Private Trader by Timothy K. Bovee is licensed under a Creative Commons Attribution-ShareAlike 4.0 International License.

Based on a work at www.timbovee.com.