3:30 p.m. New York time
Half an hour before the closing bell. The S&P 500 futures continued their rapid fall, from the overnight peak of 5157.75 into the 5060s.
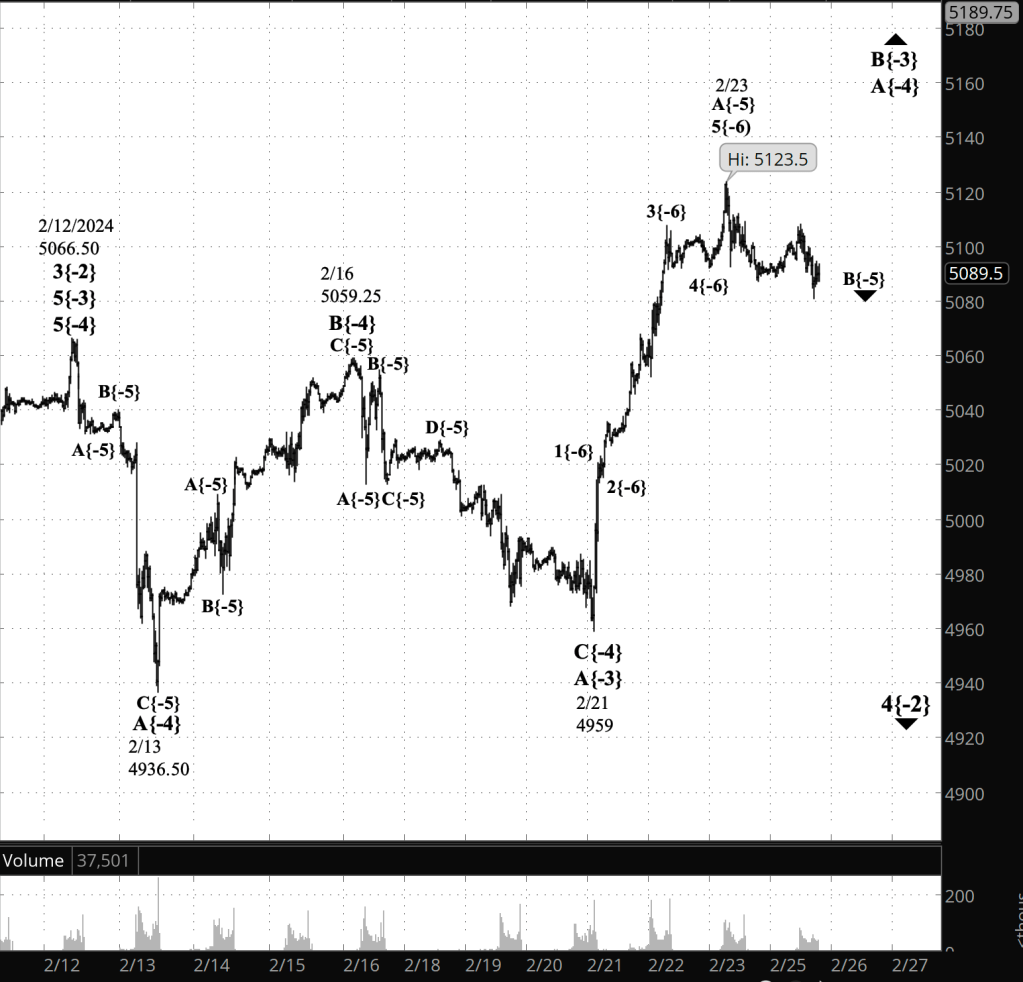
The falling middle subwave, wave B, within the rising middle subwave, also wave B, within the 4th-wave downward correction that began February 12 continues.
At the present moment the chart is a collection of smaller corrective waves within larger corrective waves. From the biggest to the smallest, with wave numbers and degrees as they appear on the chart: Wave 4{-2} is a declining correction. It’s middle subwave, rising wave B{-3}, like all B waves is counter the direction of its parent wave. Wave B{-4}, being a B wave, is also running contrary to the direction of its parent wave structure. And the smallest wave in the batch, declining wave A{-5}, is like all A waves running in the direction of the parent wave structure.
I’ve updated the chart.
2:45 p.m. New York time
A Trade. I exited my short Iron Fly on SPY for a 30.2% loss, on expiration day, one day after entry. I’ve updated the trade analysis with full results and also a discussion of how the trade went.
9:35 a.m. New York time
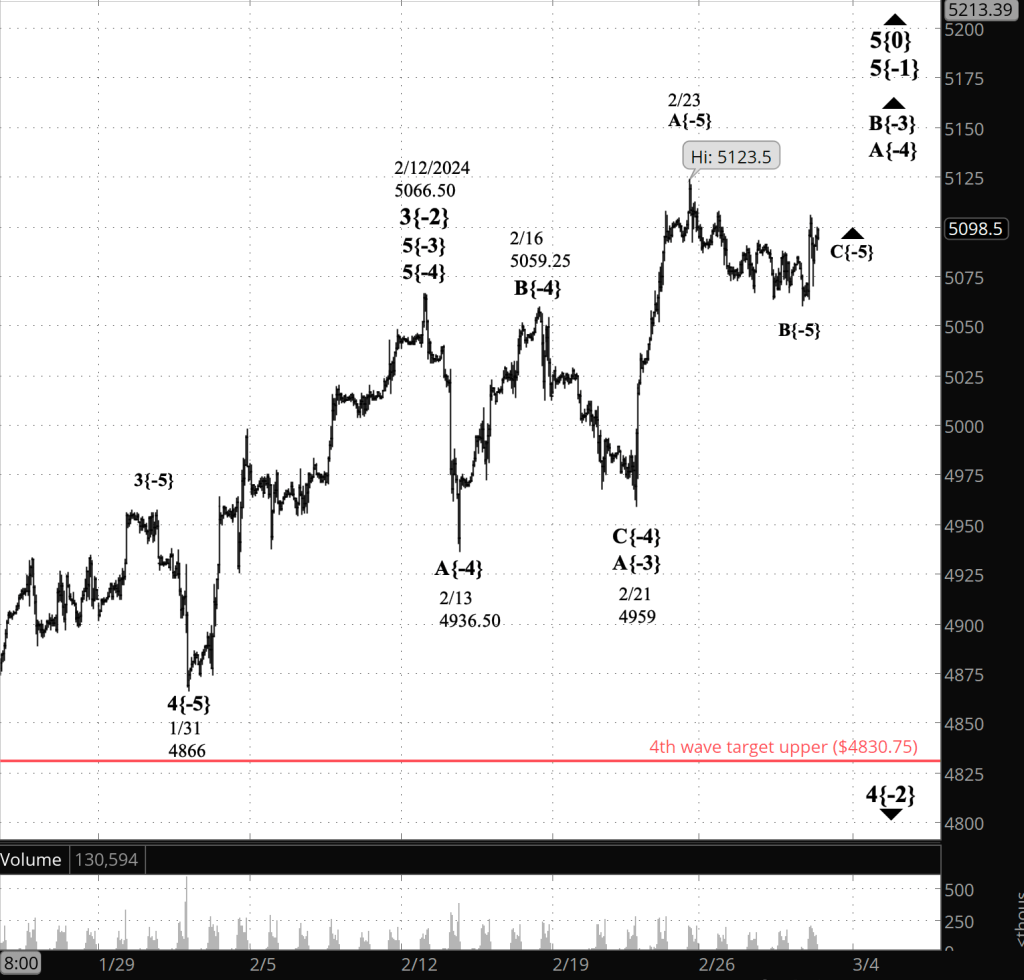
What’s happening now? The S&P 500 E-mini futures declined overnight from yesterday’s session peak — 5157.75 reached on March 4, returning to the 5110s.
What does it mean? The peak and reversal ended the first leg of the first subwave within the downward correction that began on February 12.
In the Elliott Wave Theory discussion that follows I’ll use the wave labels that appear on the chart below: The wave number, followed by a subscript, in curly brackets, describing where the wave stands in the fractal structure of the chart. I’ve chosen designations that place the wave in relation to the Intermediate degree, the name R.N. Elliott, the developer of the theory that bears his name, gave to one of the larger degrees.
Since December 2018, a 5th wave of Intermediate degree has been underway, taking the form of an expanding Diagonal Triangle. Its chart label is wave 5{0}. Waves with negative subscripts are of small degrees, at this point all are subwaves of wave 5{0}. See the “Reading the chart” section below for more on Elliott Waves.
The wave that just ended is wave C{-5}. Its parent, wave A{-4}, also ended. Both waves lie within wave A{-3}, the first subwave of wave 4{-2}, the downward correction that began on February 12.
With the end of rising wave A{-4}, declining wave B{-4} has begun, the middle subwave within the wave B{-3}, the middle subwave of wave 4{-2}. All of that is happening within wave 5{-1}, an uptrending wave that began on October 13, 2022.
When falling wave B{-4} is complete, perhaps in a week or so, rising wave C{-4} will follow, completing the parent, rising wave B{-3} and beginning declinging wave C{-3}, the final subwave of the wave 4{-2} downward correction.s
For the present, the 4th-wave correction defines the main downward trend of the, although at that level, counter-trend corrections lasting weeks can give the impression that the trend has reversed.
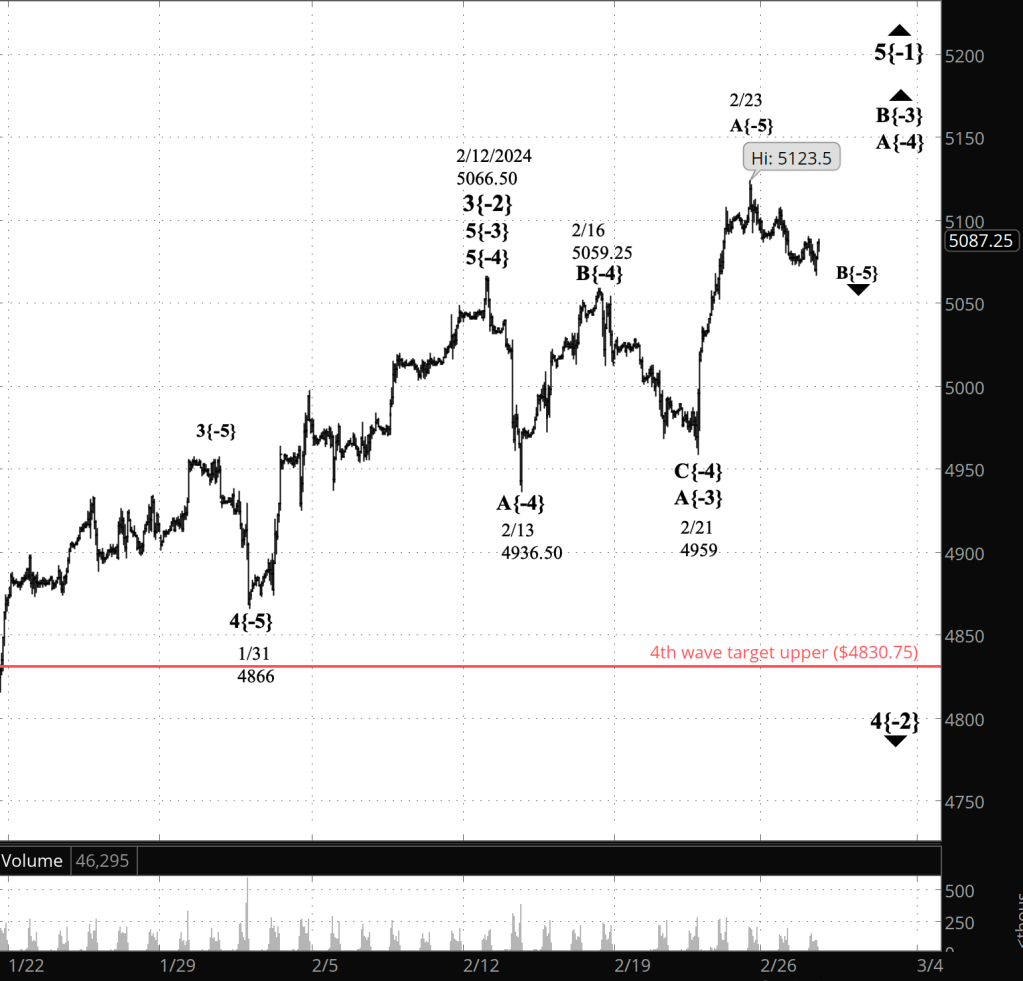
The red line on the chart shows what may be the upper boundary of the wave 4{-2} price target range, although there are often exceptions that either fail to reach the target range or overshoot it.
What are the alternatives? As is often the case in Elliott Wave Analysis, there is some ambiguity about the degree designations. For example, is wave B{-3} really a {-3} degree, or should it be labeled {-4}? Only the passage of time can provide a definite answer, often in retrospect. Meanwhile, i’ll continue to use to degree labelling that seems consistent with the progress of the chart, and will change it when it is proven wrong by developments on the chart.
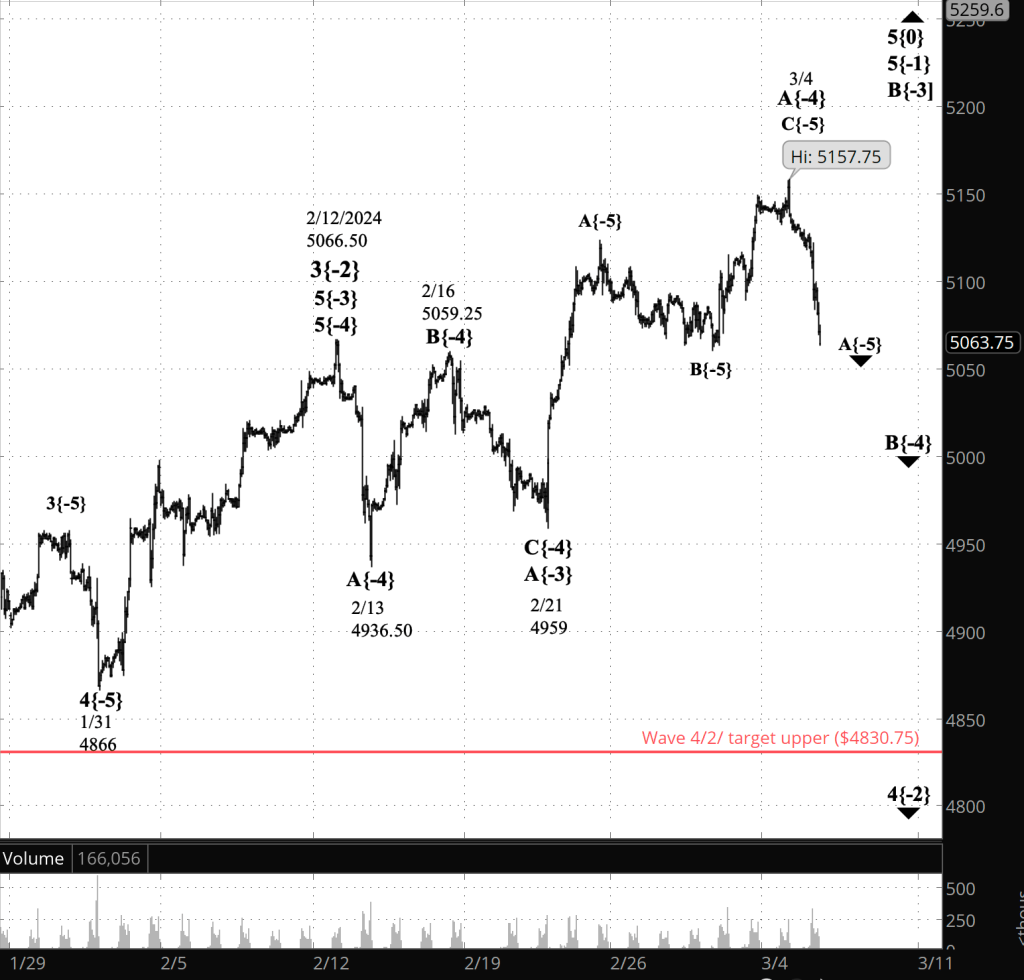
[S&P 500 E-mini futures at 3:30 p.m., 1-hour bars, with volume]
What does Elliott wave theory say? Here are the waves that underly the analyses.
Principal Analysis:
- Wave 5{0}, an expanding Diagonal Triangle, began on December 26, 2018.
- Within it, an uptrend, wave 5{-1}, began on October 13, 2022 and is underway.
- Wave 5{-1} is the parent wave of a downward correction, wave 4{-2}, that began on February 12, 2024.
- Wave 4{-2} is in its second subwave, wave B{-3}, which in turn is in wave B{-4}, its middle subwave.
- Wave B{-4} is in its initial subwave, wave A{-5}.
We Are Here.
These are the waves currently in progress under my principal analysis. Each line on the list shows the wave number, with the subscript in curly brackets, the traditional degree name, the starting date, the starting price of the S&P 500 E-mini futures, and the direction of the wave.
- S&P 500 Index:
- 5{+3} Supercycle, 7/8/1932, 4.40 (up)
- 5{+2} Cycle, 12/9/1974, 60.96 (up)
- 5{+1} Primary, 3/6/2009, 666.79 (up)
- 5{0} Intermediate, 12/26/2018, 2346.58 (up)
- S&P 500 Futures and index:
- 5{-1} Minor, 10/13/2022, 3502 (up) (futures), 3491.58 (up) (index)
- S&P 500 Futures:
- 4{-2} Minute, 2/12/2024, 5066.50 (down)
- B{-3} Minuette, 2/21/2024, 4959 (up)
Reading the chart. Price movements — waves – – in Elliott wave analysis are labeled with numbers within trending waves and letters with corrective waves. The subscripts — numbers in curly brackets — designate the wave’s degree, which, in Elliott wave analysis, means the relative position of a wave within the larger and smaller structures that make up the chart. R.N. Elliott, who in the 1930s developed the form of analysis that bears his name, viewed the chart as a complex structure of smaller waves nested within larger waves, which in turn are nested within still larger waves. In mathematics it’s called a fractal structure, where at every scale the pattern is similar to the others.
Learning and other resources. Elliott wave analysis provides context, not prophecy. As the 20th century semanticist Alfred Korzybski put it in his book Science and Sanity (1933), “The map is not the territory … The only usefulness of a map depends on similarity of structure between the empirical world and the map.” And I would add, in the ever-changing markets, we can judge that similarity of structure only after the fact.
See the menu page Analytical Methods for a rundown on where to go for information on Elliott wave analysis.
By Tim Bovee, Portland, Oregon, March 5, 2024
Disclaimer
Tim Bovee, Private Trader tracks the analysis and trades of a private trader for his own accounts. Nothing in this blog constitutes a recommendation to buy or sell stocks, options or any other financial instrument. The only purpose of this blog is to provide education and entertainment.
No trader is ever 100 percent successful in his or her trades. Trading in the stock and option markets is risky and uncertain. Each trader must make trading decisions for his or her own account, and take responsibility for the consequences.
License
All content on Tim Bovee, Private Trader by Timothy K. Bovee is licensed under a Creative Commons Attribution-ShareAlike 4.0 International License.
Based on a work at www.timbovee.com.


You must be logged in to post a comment.