Trader’s Notebook

3:30 p.m. New York time

Half an hour before the closing bell. The S&P 500 futures peaked at 5066.50 during the session and then declined sharply.

Elliott Wave Analysis: The sharpness of the decline suggests to me that the peak was the end of wave 3{-2}, the uptrend that began on October 27, 2023, and the beginning of a downward correction, wave 4{-2}. I’ve marked the chart to show that hypotheses and have promoted it to principal analysis.

The alternative analysis is that the price will reverse quickly and move above 5066.50, meaning that wave 3{-2} is still underway. The further the decline, the more likely it is that the principal analysis matches the reality of the chart.

9:35 a.m. New York time

What’s happening now? The S&P 500 E-mini futures stayed within a very narrow range after trading resumed overnight, staying almost entirely in the 5040s.

Terminology. In the Elliott Wave Theory discussion that follows, I’ll denote the degree of each wave — where it stands in the fractal structure of the chart — with a subscript in curly brackets that shows how many degrees away from the Intermediate degree it stands. See the “Reading the Chart” section below for further details.

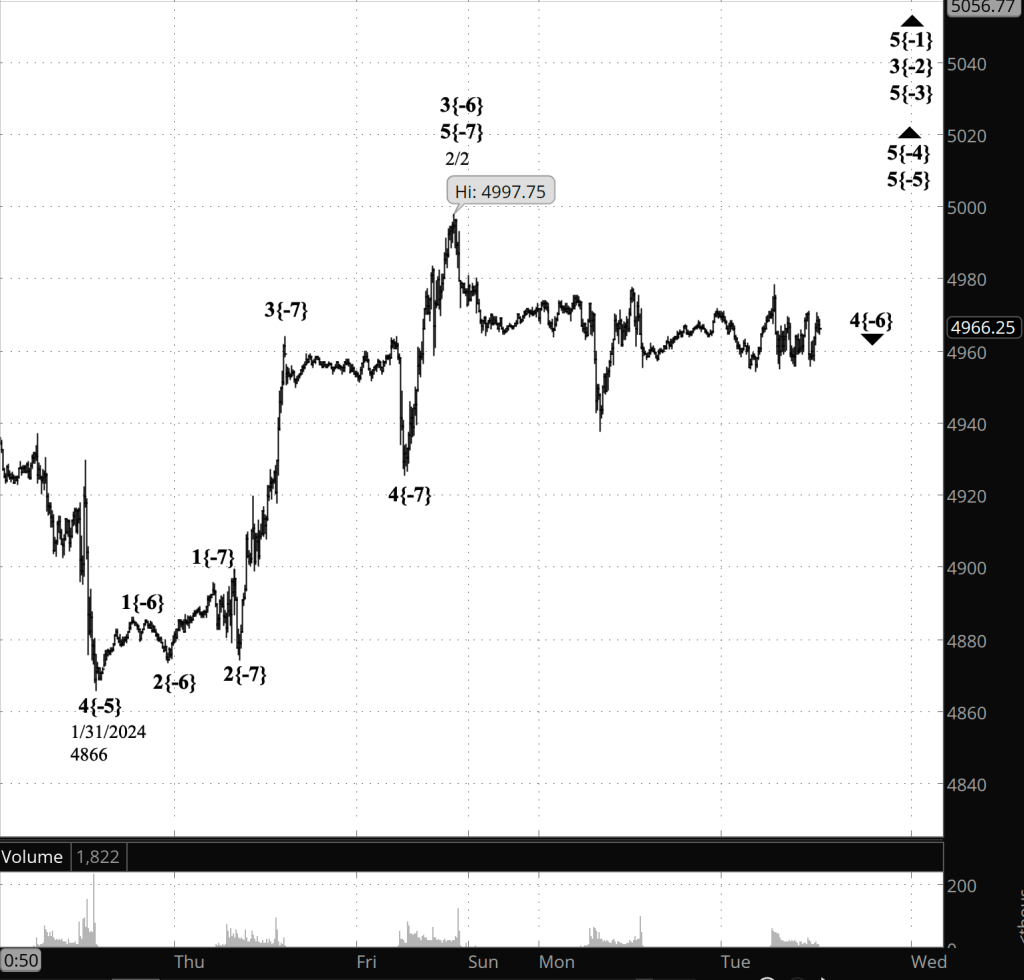
What does it mean? A 5th wave of low degree, wave 5{-7}, began on February 8 from 5008.75 and internally is in a 4th-wave downward correction, it’s next-to-the-last subwave.

The end of wave 5{-7} will cascade up the fractal structure, also marking the end of four 5th wave of increasingly larger degree: 5{-6}, 5{-5}, 5{-4} and 5{-3}.

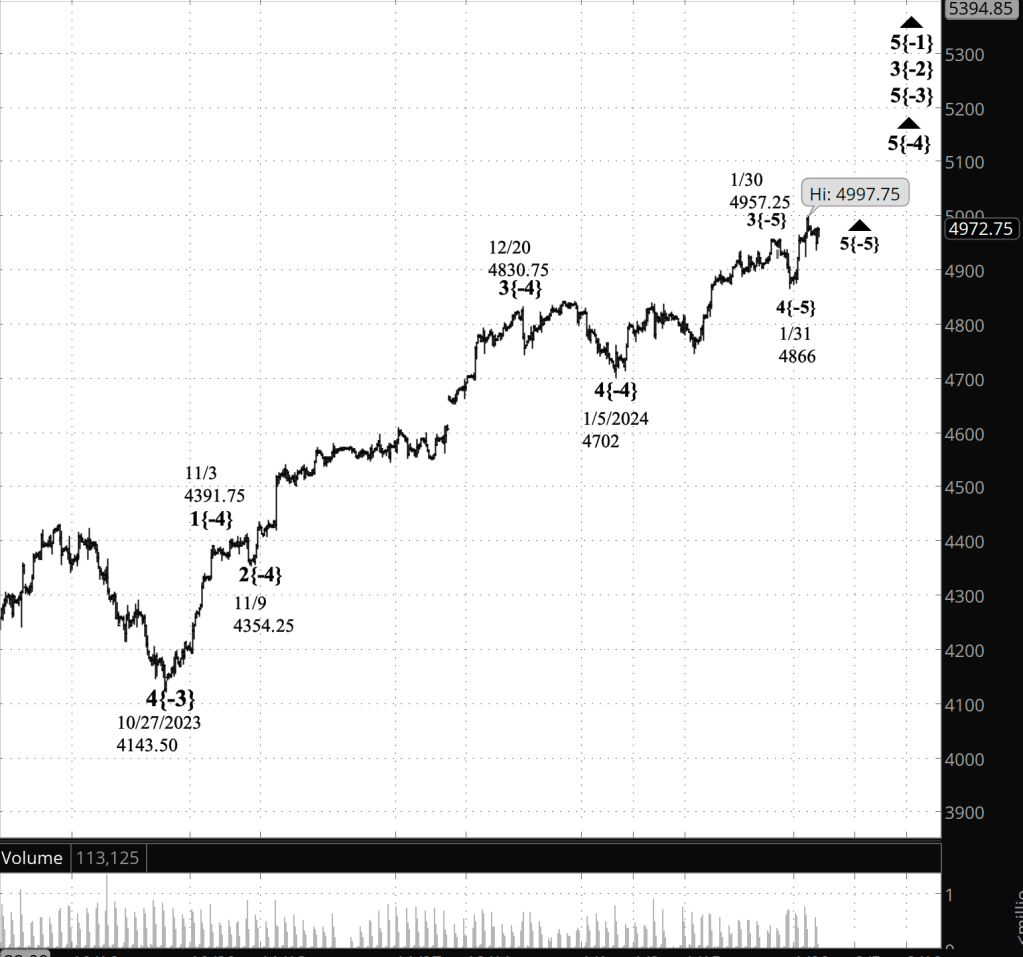
The parent of wave 5{-3} is wave 3{-2}, which began on October 27, 2023 from 4143.50. The end of wave 5{-3} will also be the end of wave 3{-2}. A downward correction, wave 4{-2}, will follow.

Fourth waves often reach completion within the 4th subwave within the larger 3rd subwave of the still larger 4th-wave downward correction. That would be wave 4{-4} within wave 3{-3} within wave 3{-2}, giving a price target of 4830.75 to 4702.

What are the alternatives? None at present, although I expect ambiguities to develop as wave 3{-2} plays out its end game. {See the afternoon update for new ambiguities.]

[S&P 500 E-mini futures at 3:30 p.m., 20-minute bars, with volume]

What does Elliott wave theory say? Here are the waves that underly the analyses. [Updated with this afternoon’s revised principal analysis.]

Principal Analysis:

  • Wave 5{0}, an expanding Diagonal Triangle, began on December 26, 2018.
  • Within it, an uptrend, wave 5{-1}, began on October 13, 2022 and is underway.
  • Wave 5{-1} is the parent wave of a downward correction, wave 4{-2}, that began on February 12, 2024.
  • Wave 4{-2} is in its first subwave, wave A{-3}.

We Are Here.

These are the waves currently in progress under my principal analysis. Each line on the list shows the wave number, with the subscript in curly brackets, the traditional degree name, the starting date, the starting price of the S&P 500 E-mini futures, and the direction of the wave.

  • S&P 500 Index:
  • 5{+3} Supercycle, 7/8/1932, 4.40 (up)
  • 5{+2} Cycle, 12/9/1974, 60.96 (up)
  • 5{+1} Primary, 3/6/2009, 666.79 (up)
  • 5{0} Intermediate, 12/26/2018, 2346.58 (up)
  • S&P 500 Futures and index:
  • 5{-1} Minor, 10/13/2022, 3502 (up) (futures), 3491.58 (up) (index)
  • S&P 500 Futures:
  • 4{-2} Minute, 2/12/2024, 5066.50 (down)
  • A{-3} Minuette, 2/12/2024, 5066.60 (down)

Reading the chart. Price movements — waves – – in Elliott wave analysis are labeled with numbers within trending waves and letters with corrective waves. The subscripts — numbers in curly brackets — designate the wave’s degree, which, in Elliott wave analysis, means the relative position of a wave within the larger and smaller structures that make up the chart. R.N. Elliott, who in the 1930s developed the form of analysis that bears his name, viewed the chart as a complex structure of smaller waves nested within larger waves, which in turn are nested within still larger waves. In mathematics it’s called a fractal structure, where at every scale the pattern is similar to the others.

Learning and other resources. Elliott wave analysis provides context, not prophecy. As the 20th century semanticist Alfred Korzybski put it in his book Science and Sanity (1933), “The map is not the territory … The only usefulness of a map depends on similarity of structure between the empirical world and the map.” And I would add, in the ever-changing markets, we can judge that similarity of structure only after the fact.

See the menu page Analytical Methods for a rundown on where to go for information on Elliott wave analysis.

By Tim Bovee, Portland, Oregon, February 12, 2024

Disclaimer

Tim Bovee, Private Trader tracks the analysis and trades of a private trader for his own accounts. Nothing in this blog constitutes a recommendation to buy or sell stocks, options or any other financial instrument. The only purpose of this blog is to provide education and entertainment.

No trader is ever 100 percent successful in his or her trades. Trading in the stock and option markets is risky and uncertain. Each trader must make trading decisions for his or her own account, and take responsibility for the consequences.

License
Creative Commons License

All content on Tim Bovee, Private Trader by Timothy K. Bovee is licensed under a Creative Commons Attribution-ShareAlike 4.0 International License.

Based on a work at www.timbovee.com.

Trader’s Notebook

3:30 p.m. New York time

Half an hour before the closing bell. The S&P 500 futures continued to rise during the session, reaching deeper into the 5040s. This morning’s Elliott Wave Analysis is unchanged. The uptrend that began on February 6 continues and is in its final subwave. I’ve updated the chart.

9:35 a.m. New York time

What’s happening now? The S&P 500 E-mini futures rose sharply overnight into the 5040s and then returned immediately to its starting point..

What does it mean? Elliott Wave Theory sees the rise as the small 4th-wave downward correction reaching its end and a 5th-wave uptrend beginning, the final subwave within a larger 5th-wave uptrend that began on February 6. This is all happening within a series of three uptrends of increasing size, follow by a still larger 3rd wave uptrend that began on October 27, 2023, from 4143.50, roughly 900 points below the overnight high.

What happens next? When the smallest 5th-wave uptrend — wave 5{-7} on the chart — is complete, it will also be the end of the four larger 5th-wave uptrends — waves 5{-6}, 5{-5}, 5{-4} and 5{-3} — and of the still larger 3rd-wave uptrend, wave 3{-2}.

The wave labels on the chart have the wave number followed by a degree number as a subscript in curly brackets showing how many degrees away — smaller for negative numbers — the wave is from what the developer of Elliott Wave Theory, R.N. Elliott, called the Intermediate degree. The present Intermediate degree, wave 5{0}, began in December 2018.

A large 4th-wave downward correction, wave 4{-2}, will follow wave 3{-2}. Fourth waves tend to end within the 4th subwave within the larger 3rd subwave of the still larger 4th-wave downward correction. That would be wave 4{-4} within wave 3{-3} within wave 3{-2}. Wave 4{-4} began on December 20, 2023 from 4830.75 and ended on January 5 at 4702.

That’s the target range of the future wave 4{-2}: between 4830.75 and 4702.

What are the alternatives? The rapid retreat from the overnight high brings some ambiguity the chart. True: The rise reached a new high for the S&P 500 futures, meaning wave 5 is underway. That’s the principal analysis. Also true: It’s possible that the price will continue significantly lower, meaning that wave 5 ended at overnight peak.

[S&P 500 E-mini futures at 3:30 p.m., 20-minute bars, with volume]

What does Elliott wave theory say? Here are the waves that underly the analyses.

Principal Analysis:

  • Wave 5{0}, an expanding Diagonal Triangle, began on December 26, 2018.
  • Within it, an uptrend, wave 5{-1}, began on October 13, 2022 and is underway.
  • Wave 5{-1} is the parent wave of a uptrend, wave 3{-2}, that began on October 27, 2023 and is in wave 5{-3}, the last of five subwaves.
  • Wave 5{-3} is in turn in its last subwave, wave 5{-4}, which is also in its final subwave, wave 5{-5}.
  • When wave 5{-5} is complete, it will also be the end of waves 5{-4}, 5{-3} and 3{-2}, and a downward correction, wave 4{-2}, will begin.
  • Within wave 5{-5}, uptrending wave 5{-6} is underway, and one degree further down, uptrending wave 5{-7} began on February 8.

Alternative Analysis:

  • Uptrending wave 5{-7} ended on February 8, also bringing waves 5{-6}, 5{-5}, 5{-4}, 5{-3} and 3{-2} to an end.

We Are Here.

These are the waves currently in progress under my principal analysis. Each line on the list shows the wave number, with the subscript in curly brackets, the traditional degree name, the starting date, the starting price of the S&P 500 E-mini futures, and the direction of the wave.

  • S&P 500 Index:
  • 5{+3} Supercycle, 7/8/1932, 4.40 (up)
  • 5{+2} Cycle, 12/9/1974, 60.96 (up)
  • 5{+1} Primary, 3/6/2009, 666.79 (up)
  • 5{0} Intermediate, 12/26/2018, 2346.58 (up)
  • S&P 500 Futures and index:
  • 5{-1} Minor, 10/13/2022, 3502 (up) (futures), 3491.58 (up) (index)
  • S&P 500 Futures:
  • 3{-2} Minute, 10/27/2023, 4143.50 (up)
  • 5{-3} Minuette, 10/27/2023, 4143.50 (up)

Reading the chart. Price movements — waves – – in Elliott wave analysis are labeled with numbers within trending waves and letters with corrective waves. The subscripts — numbers in curly brackets — designate the wave’s degree, which, in Elliott wave analysis, means the relative position of a wave within the larger and smaller structures that make up the chart. R.N. Elliott, who in the 1930s developed the form of analysis that bears his name, viewed the chart as a complex structure of smaller waves nested within larger waves, which in turn are nested within still larger waves. In mathematics it’s called a fractal structure, where at every scale the pattern is similar to the others.

Learning and other resources. Elliott wave analysis provides context, not prophecy. As the 20th century semanticist Alfred Korzybski put it in his book Science and Sanity (1933), “The map is not the territory … The only usefulness of a map depends on similarity of structure between the empirical world and the map.” And I would add, in the ever-changing markets, we can judge that similarity of structure only after the fact.

See the menu page Analytical Methods for a rundown on where to go for information on Elliott wave analysis.

By Tim Bovee, Portland, Oregon, February 9, 2024

Disclaimer

Tim Bovee, Private Trader tracks the analysis and trades of a private trader for his own accounts. Nothing in this blog constitutes a recommendation to buy or sell stocks, options or any other financial instrument. The only purpose of this blog is to provide education and entertainment.

No trader is ever 100 percent successful in his or her trades. Trading in the stock and option markets is risky and uncertain. Each trader must make trading decisions for his or her own account, and take responsibility for the consequences.

License
Creative Commons License

All content on Tim Bovee, Private Trader by Timothy K. Bovee is licensed under a Creative Commons Attribution-ShareAlike 4.0 International License.

Based on a work at www.timbovee.com.

Options Trades 2/8/2024: MSFT XSP

Symbols traded: MSFT (1DTE) short Iron Fly, XSP (1DTE) short Iron Fly

I entered two trades the day before each expired, both structured as short Iron Fly options positions: MSFT and XSP. My intent is to exit them shortly after the next session begins.

XSP has an offerings that expire every day. MSFT expires weekly and is is much less flexible. I chose to enter MSFT after earnings had been published and traders had sufficient time to turn their attention elsewhere. The post-earnings timing produced an extremely low IVR, which is a plus for short Iron Fly trades.

MSFT rose sharply and I exited for a 40.9% loss. XSP also produced a loss, albeit a small one: 2.1%.

MSFT short Iron Fly

LOT:1ENTRY DATE:2/8/2024
EXIT DATE:2/9/2024
DAYS HELD:1

Entry and Exit

METRICCREDITDEBITCHANGECHANGE %ANNUALIZED CHANGE %
Options premium$ 3.32$ 5.62$ (2.30)-40.9%-14856%
METRICENTRYEXITCHANGECHANGE %ANNUALIZED CHANGE %
Stock price$ 413.90$ 418.31$ (4.41)1.07%389%
Impllied Volatility Rate2.91.9-1.0
Days to expiration10

The structure of the position

STRUCTURESTRIKEODDS EXPIRE OTMDELTAIN PRICEOUT PRICENET PRICE
Calls
Long420.0089.0%11$ (0.26)$ 0.35$ 0.09
Break-even415.8263.5%31.5
Short412.5038.0%52$ 2.63$ (5.95)$ (3.32)
Puts
Short412.5037.0%63$ 1.14$ (0.03)$ 1.11
Break-even410.8264.0%36
Long407.5091.0%9$ (0.19)$ 0.01$ (0.18)
======
`NET TOTAL:$ (2.30)

Risk and Reward

Per contract:
Reward332.00
Risk293.00
R/R Ratio (n:1)0.9

XSP short Iron Fly

LOT:6ENTRY DATE:2/8/2024
EXIT DATE:2/9/2024
DAYS HELD:1

Entry and Exit

METRICCREDITDEBITCHANGECHANGE %ANNUALIZED CHANGE %
Options premium$ 1.85$ 1.89$ (0.04)-2.1%-768%
METRICENTRYEXITCHANGECHANGE %ANNUALIZED CHANGE %
Stock price$ 499.35$ 500.18$ (0.83)0.17%61%
Impllied Volatility Rate8.28.50.3
Days to expiration10

The structure of the position

STRUCTURESTRIKEODDS EXPIRE OTMDELTAIN PRICEOUT PRICENET PRICE
Calls
Long502.0084.0%16$ (0.38)$ 0.28$ (0.10)
Break-even500.8564.0%35.5
Short499.0044.0%55$ 1.54$ (1.57)$ (0.03)
Puts
Short499.0056.0%45$ 0.92$ (0.65)$ 0.27
Break-even497.8567.5%33
Long496.0079.0%21$ (0.23)$ 0.13$ (0.10)
======
`NET TOTAL:$ 0.04

Risk and Reward

Per contract:
Reward185.00
Risk115.00
R/R Ratio (n:1)0.6

By Tim Bovee, Portland, Oregon, February 8-9, 2024

Disclaimer

Tim Bovee, Private Trader tracks the analysis and trades of a private trader for his own accounts. Nothing in this blog constitutes a recommendation to buy or sell stocks, options or any other financial instrument. The only purpose of this blog is to provide education and entertainment.

No trader is ever 100 percent successful in his or her trades. Trading in the stock and option markets is risky and uncertain. Each trader must make trading decisions for his or her own account, and take responsibility for the consequences.

License
Creative Commons License

All content on Tim Bovee, Private Trader by Timothy K. Bovee is licensed under a Creative Commons Attribution-ShareAlike 4.0 International License.

Based on a work at www.timbovee.com.

Trader’s Notebook

3:30 p.m. New York time

Half an hour before the closing bell. The S&P 500 futures went nowhere during the session. The low-degree downward correction that began on February 7 continues. This morning’s application of Elliott Wave Theory to the chart remains valid, and I’ve updated the chart.

2:10 p.m. New York time

Trades. Three trades today: One out, two in.

I exited my short Iron Fly 1DTE trade on SPY for a 27.8% loss. Shortly after I entered the S&P 500 rose sharply, turning the position unprofitable. I exited the in the money calls in the position and allowed the out-of-the-money puts to expire without value. I’ve updated the trade analysis with full results.

I entered two 1DTE short Iron Fly positions today.

MSFT has weekly expirations and published earnings on January 30. The price has settled since then, and the volatility measure (IVR) has reached an extreme low of 2.9%, perfect for a 1DTE short Iron Fly.

XSP expires daily and so is extremely flexible. The S&P 500 settled somewhat today, with a lower IVR than the prior day, and so I decided to enter the 1DTE short Iron Fly position.

I’ve posted trade analyses for MSFT and XSP.

9:35 a.m. New York time

What’s happening now? The S&P 500 E-mini futures traded sideways overnight, remaining below the prior day’s session high, 5020.

What does it mean? Elliott Wave Analysis: The 5th-wave uptrend that began on January 31 is in its final subwave, a smaller 5th wave, and that subwave began its next-to-the-last subwave, a 4th-wave downward correction, from that session high.

On the chart that smallest subwave is labeled wave 4{-7}, where the {-7} subscript shows the 4th-wave’s relative position within the fractal hierarchy of the chart. When wave 4{-7} is complete, a final subwave, wave 5{-7}, will complete a series of subwaves from the parent wave 5{-6} up to wave 5{-3}, and one degree larger, wave 3{-2}, which began on October 27, 2023 and which will be followed by a 4th-wave downward correction of significant size.

What are the alternatives? None at present. They will develop, as they always do.

[S&P 500 E-mini futures at 3:30 p.m., 15-minute bars, with volume]

What does Elliott wave theory say? Here are the waves that underly the analyses.

Principal Analysis:

  • Wave 5{0}, an expanding Diagonal Triangle, began on December 26, 2018.
  • Within it, an uptrend, wave 5{-1}, began on October 13, 2022 and is underway.
  • Wave 5{-1} is the parent wave of a uptrend, wave 3{-2}, that began on October 27, 2023 and is in wave 5{-3}, the last of five subwaves.
  • Wave 5{-3} is in turn in its last subwave, wave 5{-4}, which is also in its final subwave, wave 5{-5}.
  • When wave 5{-5} is complete, it will also be the end of waves 5{-4}, 5{-3} and 3{-2}, and a downward correction, wave 4{-2}, will begin.
  • Within wave 5{-5}, uptrending wave 5{-6} is underway, and one degree further down, wave 4{-7}, a downward correction, began on February 7.

We Are Here.

These are the waves currently in progress under my principal analysis. Each line on the list shows the wave number, with the subscript in curly brackets, the traditional degree name, the starting date, the starting price of the S&P 500 E-mini futures, and the direction of the wave.

  • S&P 500 Index:
  • 5{+3} Supercycle, 7/8/1932, 4.40 (up)
  • 5{+2} Cycle, 12/9/1974, 60.96 (up)
  • 5{+1} Primary, 3/6/2009, 666.79 (up)
  • 5{0} Intermediate, 12/26/2018, 2346.58 (up)
  • S&P 500 Futures and index:
  • 5{-1} Minor, 10/13/2022, 3502 (up) (futures), 3491.58 (up) (index)
  • S&P 500 Futures:
  • 3{-2} Minute, 10/27/2023, 4143.50 (up)
  • 5{-3} Minuette, 10/27/2023, 4143.50 (up)

Reading the chart. Price movements — waves – – in Elliott wave analysis are labeled with numbers within trending waves and letters with corrective waves. The subscripts — numbers in curly brackets — designate the wave’s degree, which, in Elliott wave analysis, means the relative position of a wave within the larger and smaller structures that make up the chart. R.N. Elliott, who in the 1930s developed the form of analysis that bears his name, viewed the chart as a complex structure of smaller waves nested within larger waves, which in turn are nested within still larger waves. In mathematics it’s called a fractal structure, where at every scale the pattern is similar to the others.

Learning and other resources. Elliott wave analysis provides context, not prophecy. As the 20th century semanticist Alfred Korzybski put it in his book Science and Sanity (1933), “The map is not the territory … The only usefulness of a map depends on similarity of structure between the empirical world and the map.” And I would add, in the ever-changing markets, we can judge that similarity of structure only after the fact.

See the menu page Analytical Methods for a rundown on where to go for information on Elliott wave analysis.

By Tim Bovee, Portland, Oregon, February 8, 2024

Disclaimer

Tim Bovee, Private Trader tracks the analysis and trades of a private trader for his own accounts. Nothing in this blog constitutes a recommendation to buy or sell stocks, options or any other financial instrument. The only purpose of this blog is to provide education and entertainment.

No trader is ever 100 percent successful in his or her trades. Trading in the stock and option markets is risky and uncertain. Each trader must make trading decisions for his or her own account, and take responsibility for the consequences.

License
Creative Commons License

All content on Tim Bovee, Private Trader by Timothy K. Bovee is licensed under a Creative Commons Attribution-ShareAlike 4.0 International License.

Based on a work at www.timbovee.com.

Trader’s Notebook

3:30 p.m. New York time

Half an hour before the closing bell. The S&P 500 futures rose into the 5020s during the session, as the final subwave within the uptrend that began on January 31 continues. In Elliott wave terminology, the subwave, wave 5{-6}, is underway, within the uptrend, wave 5{-5}.

Third waves tend to be the longest within a trend, but occasionally 5th waves take that honor. The third subwave within the trend covered a bit more than 100 points. A similar distance on the 5th subwave would take it to the 5050s, about 30 points or so above where it is now. That’s not a forecast, just an exercise “if this, then that”.

This morning’s analysis stands. I’ve updated the chart.

3:05 p.m. New York time

Trades. The rapid rise in the S&P 500 put my 1DTE short Iron Fly position on SPY in a losing position. I sold the in-the-money options for a loss and will allow the out-of-the-money options to expire with zero value. I’ll update the trade analysis when the process is complete.

9:35 a.m. New York time

What’s happening now? The S&P 500 E-mini futures rose sharply overnight, from 4970 to within cents of 5000. The price rose above the February 2 peak, 4997.75, as the opening bell sounded.

What does it mean? The final leg of the uptrend that began on January 31 — the 5th wave — continues. Internally, the 4th-wave downward correction ended during yesterday’s session, on September 6, and the 5th and final subwave began.

What are the alternatives? As always, there is some uncertainty over the relative size of waves within the fractal structure described above.

[S&P 500 E-mini futures at 3:30 p.m., 15-minute bars, with volume]

What does Elliott wave theory say? Here are the waves that underly the analyses.

Principal Analysis:

  • Wave 5{0}, an expanding Diagonal Triangle, began on December 26, 2018.
  • Within it, an uptrend, wave 5{-1}, began on October 13, 2022 and is underway.
  • Wave 5{-1} is the parent wave of a uptrend, wave 3{-2}, that began on October 27, 2023 and is in wave 5{-3}, the last of five subwaves.
  • Wave 5{-3} is in turn in its last subwave, wave 5{-4}, which is also in its final subwave, wave 5{-5}.
  • When wave 5{-5} is complete, it will also be the end of waves 5{-4}, 5{-3} and 3{-2}, and a downward correction, wave 4{-2}, will begin.
  • Within wave 5{-5}, uptrending wave 5{-6} is underway.

We Are Here.

These are the waves currently in progress under my principal analysis. Each line on the list shows the wave number, with the subscript in curly brackets, the traditional degree name, the starting date, the starting price of the S&P 500 E-mini futures, and the direction of the wave.

  • S&P 500 Index:
  • 5{+3} Supercycle, 7/8/1932, 4.40 (up)
  • 5{+2} Cycle, 12/9/1974, 60.96 (up)
  • 5{+1} Primary, 3/6/2009, 666.79 (up)
  • 5{0} Intermediate, 12/26/2018, 2346.58 (up)
  • S&P 500 Futures and index:
  • 5{-1} Minor, 10/13/2022, 3502 (up) (futures), 3491.58 (up) (index)
  • S&P 500 Futures:
  • 3{-2} Minute, 10/27/2023, 4143.50 (up)
  • 5{-3} Minuette, 10/27/2023, 4143.50 (up)

Reading the chart. Price movements — waves – – in Elliott wave analysis are labeled with numbers within trending waves and letters with corrective waves. The subscripts — numbers in curly brackets — designate the wave’s degree, which, in Elliott wave analysis, means the relative position of a wave within the larger and smaller structures that make up the chart. R.N. Elliott, who in the 1930s developed the form of analysis that bears his name, viewed the chart as a complex structure of smaller waves nested within larger waves, which in turn are nested within still larger waves. In mathematics it’s called a fractal structure, where at every scale the pattern is similar to the others.

Learning and other resources. Elliott wave analysis provides context, not prophecy. As the 20th century semanticist Alfred Korzybski put it in his book Science and Sanity (1933), “The map is not the territory … The only usefulness of a map depends on similarity of structure between the empirical world and the map.” And I would add, in the ever-changing markets, we can judge that similarity of structure only after the fact.

See the menu page Analytical Methods for a rundown on where to go for information on Elliott wave analysis.

By Tim Bovee, Portland, Oregon, February 7, 2024

Disclaimer

Tim Bovee, Private Trader tracks the analysis and trades of a private trader for his own accounts. Nothing in this blog constitutes a recommendation to buy or sell stocks, options or any other financial instrument. The only purpose of this blog is to provide education and entertainment.

No trader is ever 100 percent successful in his or her trades. Trading in the stock and option markets is risky and uncertain. Each trader must make trading decisions for his or her own account, and take responsibility for the consequences.

License
Creative Commons License

All content on Tim Bovee, Private Trader by Timothy K. Bovee is licensed under a Creative Commons Attribution-ShareAlike 4.0 International License.

Based on a work at www.timbovee.com.

Options Trades 2/6/2024: SPY

Symbols traded: SPY short Iron Fly (1DTE)

I’ve entered a short Iron Fly position on SPY, one day prior to expiration, and exited on February 7, expiration day. The call options within the position were in the money and therefore unprofitable after the stock price rose overnight. I exited the calls early in the session and left the put options, which were out of the money, to expire without value.

SPY short Iron Fly

LOT:7ENTRY DATE:2/6/2024
EXIT DATE:2/7/2024
DAYS HELD:1

Entry and Exit

METRICCREDITDEBITCHANGECHANGE %ANNUALIZED CHANGE %
Options premium$ 1.95$ 2.70$ (0.75)-27.8%-10083%
METRICENTRYEXITCHANGECHANGE %ANNUALIZED CHANGE %
Stock price$ 493.22$ 498.10$ (4.88)0.99%361%
Impllied Volatility Rate10.88.6-2.2
Days to expiration10

The structure of the position

STRUCTURESTRIKEODDS EXPIRE OTMDELTAIN PRICEOUT PRICENET PRICE
Calls
Long496.0078.0%20$ (0.38)$ 1.85$ 1.47
Break-even494.9562.5%36.5
Short493.0047.0%53$ 1.48$ (4.55)$ (3.07)
Puts
Short493.0047.0%54$ 1.19$ –$ 1.19
Break-even491.9565.5%35.5
Long490.0084.0%17$ (0.34)$ –$ (0.34)
======
`NET TOTAL:$ (0.75)

Risk and Reward

Per contract:
Reward195.00
Risk105.00
R/R Ratio (n:1)0.5

By Tim Bovee, Portland, Oregon, February 6, 7, 2024

Disclaimer

Tim Bovee, Private Trader tracks the analysis and trades of a private trader for his own accounts. Nothing in this blog constitutes a recommendation to buy or sell stocks, options or any other financial instrument. The only purpose of this blog is to provide education and entertainment.

No trader is ever 100 percent successful in his or her trades. Trading in the stock and option markets is risky and uncertain. Each trader must make trading decisions for his or her own account, and take responsibility for the consequences.

License
Creative Commons License

All content on Tim Bovee, Private Trader by Timothy K. Bovee is licensed under a Creative Commons Attribution-ShareAlike 4.0 International License.

Based on a work at www.timbovee.com.

Trader’s Notebook

3:30 p.m. New York time

Half an hour before the closing bell. The S&P 500 futures continued to trade within a narrow range during the session, fluctuating between the 4950s and the 4970s.

A downward correction, wave 4{-6} within an uptrend, wave 5{-5}, continues. This morning’s analysis is unchanged.

I’ve updated the chart.

2:05 p.m. New York time

Trades. I continued my daily 1DTE trade alternation between SPY and XSP. Today, it was XSP’s turn for exit and SPY’s for entry. Wednesday, February 7, will be an opportunity for 9DTE trades on options that expire weekly, and Thursday, February 8, for 1DTE trades on the weeklies.

But today, I exited my short Iron Fly position on XSP for a 21.7% profit and updated the trade analysis with full results.

And I entered a short Iron Fly position on SPY a day before expiration, with the intent of exiting on Wednesday, February 7. I’ve posted a trade analysis.

9:35 a.m. New York time

What’s happening now? The S&P 500 E-mini futures rose to the 4970s and then fell to the 4950s before returning to the higher level.

What does it mean? A small downward 4th-wave correction within a larger uptrend — wave 5{-5} on the chart — that began on January 31 continues. The 5th wave is the smallest of a series of 5th waves of increasing size, all within an uptrending 3rd wave that began last autumn.

When the small 5th wave is complete, it will also be the end of those increasingly 5th waves and of the 3rd-wave uptrend, which will be followed by a 4th-wave downward correction of significant size.

What are the alternatives? As always, there is some uncertainty over the relative size of waves within the fractal structure described above.

The Chart. A close-up view of wave 5{-5} and its subwaves.

[S&P 500 E-mini futures at 3:30 p.m., 10-minute bars, with volume]

What does Elliott wave theory say? Here are the waves that underly the analyses.

Principal Analysis:

  • Wave 5{0}, an expanding Diagonal Triangle, began on December 26, 2018.
  • Within it, an uptrend, wave 5{-1}, began on October 13, 2022 and is underway.
  • Wave 5{-1} is the parent wave of a uptrend, wave 3{-2}, that began on October 27, 2023 and is in wave 5{-3}, the last of five subwaves.
  • Wave 5{-3} is in turn in its last subwave, wave 5{-4}, which is also in its final subwave, wave 5{-5}.
  • When wave 5{-5} is complete, it will also be the end of waves 5{-4}, 5{-3} and 3{-2}, and a downward correction, wave 4{-2}, will begin.
  • Within wave 5{-5}, wave 4{-6}, a downward correction, is underway.

We Are Here.

These are the waves currently in progress under my principal analysis. Each line on the list shows the wave number, with the subscript in curly brackets, the traditional degree name, the starting date, the starting price of the S&P 500 E-mini futures, and the direction of the wave.

  • S&P 500 Index:
  • 5{+3} Supercycle, 7/8/1932, 4.40 (up)
  • 5{+2} Cycle, 12/9/1974, 60.96 (up)
  • 5{+1} Primary, 3/6/2009, 666.79 (up)
  • 5{0} Intermediate, 12/26/2018, 2346.58 (up)
  • S&P 500 Futures and index:
  • 5{-1} Minor, 10/13/2022, 3502 (up) (futures), 3491.58 (up) (index)
  • S&P 500 Futures:
  • 3{-2} Minute, 10/27/2023, 4143.50 (up)
  • 5{-3} Minuette, 10/27/2023, 4143.50 (up)

Reading the chart. Price movements — waves – – in Elliott wave analysis are labeled with numbers within trending waves and letters with corrective waves. The subscripts — numbers in curly brackets — designate the wave’s degree, which, in Elliott wave analysis, means the relative position of a wave within the larger and smaller structures that make up the chart. R.N. Elliott, who in the 1930s developed the form of analysis that bears his name, viewed the chart as a complex structure of smaller waves nested within larger waves, which in turn are nested within still larger waves. In mathematics it’s called a fractal structure, where at every scale the pattern is similar to the others.

Learning and other resources. Elliott wave analysis provides context, not prophecy. As the 20th century semanticist Alfred Korzybski put it in his book Science and Sanity (1933), “The map is not the territory … The only usefulness of a map depends on similarity of structure between the empirical world and the map.” And I would add, in the ever-changing markets, we can judge that similarity of structure only after the fact.

See the menu page Analytical Methods for a rundown on where to go for information on Elliott wave analysis.

By Tim Bovee, Portland, Oregon, February 6, 2024

Disclaimer

Tim Bovee, Private Trader tracks the analysis and trades of a private trader for his own accounts. Nothing in this blog constitutes a recommendation to buy or sell stocks, options or any other financial instrument. The only purpose of this blog is to provide education and entertainment.

No trader is ever 100 percent successful in his or her trades. Trading in the stock and option markets is risky and uncertain. Each trader must make trading decisions for his or her own account, and take responsibility for the consequences.

License
Creative Commons License

All content on Tim Bovee, Private Trader by Timothy K. Bovee is licensed under a Creative Commons Attribution-ShareAlike 4.0 International License.

Based on a work at www.timbovee.com.

Options Trades 2/5/2024: XSP

Symbols traded: XSP (1DTE) short Iron Fly

I entered the short Iron Fly position a day before expiration, and exited on expiration day for a 21.7% profit.

XSP short Iron Fly

LOT:5ENTRY DATE:2/5/2024
EXIT DATE:2/6/2024
DAYS HELD:1

Entry and Exit

METRICCREDITDEBITCHANGECHANGE %ANNUALIZED CHANGE %
Options premium$ 1.91$ 1.57$ 0.3421.7%7861%
METRICENTRYEXITCHANGECHANGE %ANNUALIZED CHANGE %
Stock price$ 494.37$ 495.24$ (0.87)0.18%64%
Impllied Volatility Rate13.210.8-2.4
Days to expiration10

The structure of the position

STRUCTURESTRIKEODDS EXPIRE OTMDELTAIN PRICEOUT PRICENET PRICE
Calls
Long498.0086.0%14$ (0.22)$ 0.10$ (0.12)
Break-even496.9171.0%29
Short495.0056.0%44$ 1.02$ (0.99)$ 0.03
Puts
Short495.0056.0%44$ 1.60$ (0.79)$ 0.81
Break-even493.9166.0%34
Long492.0076.0%24$ (0.49)$ 0.11$ (0.38)
======
`NET TOTAL:$ 0.34

Risk and Reward

Per contract:
Reward191.00
Risk109.00
R/R Ratio (n:1)0.6

By Tim Bovee, Portland, Oregon, February 5-6, 2024

Disclaimer

Tim Bovee, Private Trader tracks the analysis and trades of a private trader for his own accounts. Nothing in this blog constitutes a recommendation to buy or sell stocks, options or any other financial instrument. The only purpose of this blog is to provide education and entertainment.

No trader is ever 100 percent successful in his or her trades. Trading in the stock and option markets is risky and uncertain. Each trader must make trading decisions for his or her own account, and take responsibility for the consequences.

License
Creative Commons License

All content on Tim Bovee, Private Trader by Timothy K. Bovee is licensed under a Creative Commons Attribution-ShareAlike 4.0 International License.

Based on a work at www.timbovee.com.

Trader’s Notebook

3:30 p.m. New York time

Half an hour before the closing bell. The S&P 500 futures fell into the 4930s during the session and then returned to the 4960s, within the range it had traded overnight.

The decline is a small subwave within the uptrending 5th wave that began on January 31.

This morning’s analysis is unchanged. I’ve updated the chart.

1:40 p.m. New York time

Trades. Two short-duration trades today on ETFs based on the S&P 500.

I exited my 3DTE over-the-weekend position on SPY for an 19.5% profit and updated the trade analysis with full results.

I entered a 1DTE position on XSP and will exit it on expiration day, February 6. I’ve posted a trade analysis.

Both positions were structured as a short Iron Fly — the same as a short Iron Condor except the two short options have the same strike price. It’s a low-risk, relatively low-reward strategy that does best with low volatility underlying symbols.

9:35 a.m. New York time

What’s happening now? The S&P 500 E-mini futures remained mainly in the 4960s and 4970s after trading resumed overnight. The price remained below the February 2 high, before the weekend, of 4997.75.

What does it mean? The uptrend that began on January 31 continues, a 5th-wave within a series of increasingly larger 5th waves stretching up two levels within the fractal structure of the chart, to a larger 3rd-wave uptrend within another, larger 5th wave uptrend.

The end of the January 31 5th-wave uptrend will also be the end of three of its parent waves. In incresing size, they are two 5th waves and a 3rd wave that began on October 31. The 3rd wave, when complete, will be followed by a significant 4th-wave downward correction.

On the chart the smallest movement I’m tracking is wave 5{-5} — the January 31 uptrend — up through wave 3{-2} to the largest, wave 5{-1}, which began on October 13, 2023. See the “Reading the Chart” section below for an explanation of the degree indicators in curly brackets. The future downward correction will show on the chart as wave 4{-2}.

What are the alternatives? I made an adjustment last week the relative placement of waves within the fractal structure of the price movements, It is possible that further degree adjustments will be needed. In Friday’s analysis I said that I would work over the weekend on the question of when wave 4{-1} ended and wave 5{-1} began. Still working on it.

[S&P 500 E-mini futures at 3:30 p.m., 210-minute bars, with volume]

What does Elliott wave theory say? Here are the waves that underly the analyses.

Principal Analysis:

  • Wave 5{0}, an expanding Diagonal Triangle, began on December 26, 2018.
  • Within it, an uptrend, wave 5{-1}, began on October 13, 2022 and is underway.
  • Wave 5{-1} is the parent wave of a uptrend, wave 3{-2}, that began on October 25, 2023 and is in wave 5{-3}, the last of five subwaves.
  • Wave 5{-3} is in turn in its last subwave, wave 5{-4}, which is also in its final subwave, wave 5{-5}.
  • When wave 5{-5} is complete, it will also be the end of waves 5{-4}, 5{-3} and 3{-2}, and a downward correction, wave 4{-2}, will begin.

We Are Here.

These are the waves currently in progress under my principal analysis. Each line on the list shows the wave number, with the subscript in curly brackets, the traditional degree name, the starting date, the starting price of the S&P 500 E-mini futures, and the direction of the wave.

  • S&P 500 Index:
  • 5{+3} Supercycle, 7/8/1932, 4.40 (up)
  • 5{+2} Cycle, 12/9/1974, 60.96 (up)
  • 5{+1} Primary, 3/6/2009, 666.79 (up)
  • 5{0} Intermediate, 12/26/2018, 2346.58 (up)
  • S&P 500 Futures and index:
  • 5{-1} Minor, 10/13/2022, 3502 (up) (futures), 3491.58 (up) (index)
  • S&P 500 Futures:
  • 3{-2} Minute, 10/27/2023, 4143.50 (up)
  • 5{-3} Minuette, 10/27/2023, 4143.50 (up)

Reading the chart. Price movements — waves – – in Elliott wave analysis are labeled with numbers within trending waves and letters with corrective waves. The subscripts — numbers in curly brackets — designate the wave’s degree, which, in Elliott wave analysis, means the relative position of a wave within the larger and smaller structures that make up the chart. R.N. Elliott, who in the 1930s developed the form of analysis that bears his name, viewed the chart as a complex structure of smaller waves nested within larger waves, which in turn are nested within still larger waves. In mathematics it’s called a fractal structure, where at every scale the pattern is similar to the others.

Learning and other resources. Elliott wave analysis provides context, not prophecy. As the 20th century semanticist Alfred Korzybski put it in his book Science and Sanity (1933), “The map is not the territory … The only usefulness of a map depends on similarity of structure between the empirical world and the map.” And I would add, in the ever-changing markets, we can judge that similarity of structure only after the fact.

See the menu page Analytical Methods for a rundown on where to go for information on Elliott wave analysis.

By Tim Bovee, Portland, Oregon, February 5, 2024

Disclaimer

Tim Bovee, Private Trader tracks the analysis and trades of a private trader for his own accounts. Nothing in this blog constitutes a recommendation to buy or sell stocks, options or any other financial instrument. The only purpose of this blog is to provide education and entertainment.

No trader is ever 100 percent successful in his or her trades. Trading in the stock and option markets is risky and uncertain. Each trader must make trading decisions for his or her own account, and take responsibility for the consequences.

License
Creative Commons License

All content on Tim Bovee, Private Trader by Timothy K. Bovee is licensed under a Creative Commons Attribution-ShareAlike 4.0 International License.

Based on a work at www.timbovee.com.

Options Trades 2/2/2024: SPY

Symbols traded: SPY (3DTE)

I’ve entered a short Iron Fly position on SPY with the intention of holding it over the weekend and exiting on Monday. I exited the position as planned, on February 5, for an 18.5% profit.

SPY short Iron Fly

LOT:6ENTRY DATE:2/2/2024
EXIT DATE:2/5/2024
DAYS HELD:3

Entry and Exit

METRICCREDITDEBITCHANGECHANGE %ANNUALIZED CHANGE %
Options premium$ 2.11$ 1.78$ 0.3318.5%2243%
METRICENTRYEXITCHANGECHANGE %ANNUALIZED CHANGE %
Stock price$ 495.18$ 493.12$ 2.06-0.42%-51%
Impllied Volatility Rate14.715.71.0
Days to expiration30

The structure of the position

STRUCTURESTRIKEODDS EXPIRE OTMDELTAIN PRICEOUT PRICENET PRICE
Calls
Long497.0077.0%22$ (0.79)$ 0.09$ (0.70)
Break-even496.1164.0%33.5
Short494.0051.0%45$ 2.24$ (0.65)$ 1.59
Puts
Short494.0050.0%56$ 1.00$ (1.56)$ (0.56)
Break-even493.1163.0%42.5
Long491.0076.0%29$ (0.34)$ 0.34$ –
======
`NET TOTAL:$ 0.33

Risk and Reward

Per contract:
Reward211.00
Risk89.00
R/R Ratio (n:1)0.4

By Tim Bovee, Portland, Oregon, February 2, February 5, 2024

Disclaimer

Tim Bovee, Private Trader tracks the analysis and trades of a private trader for his own accounts. Nothing in this blog constitutes a recommendation to buy or sell stocks, options or any other financial instrument. The only purpose of this blog is to provide education and entertainment.

No trader is ever 100 percent successful in his or her trades. Trading in the stock and option markets is risky and uncertain. Each trader must make trading decisions for his or her own account, and take responsibility for the consequences.

License
Creative Commons License

All content on Tim Bovee, Private Trader by Timothy K. Bovee is licensed under a Creative Commons Attribution-ShareAlike 4.0 International License.

Based on a work at www.timbovee.com.