3:30 p.m. New York time
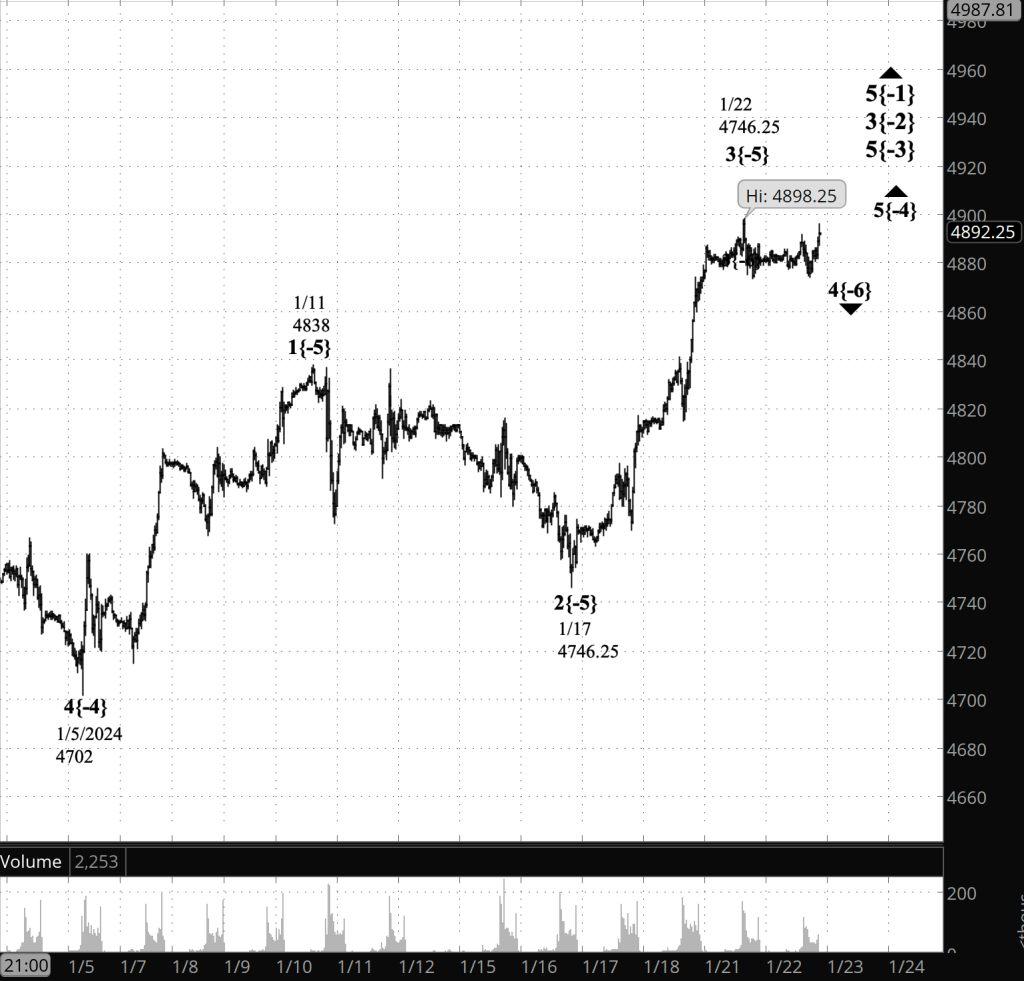
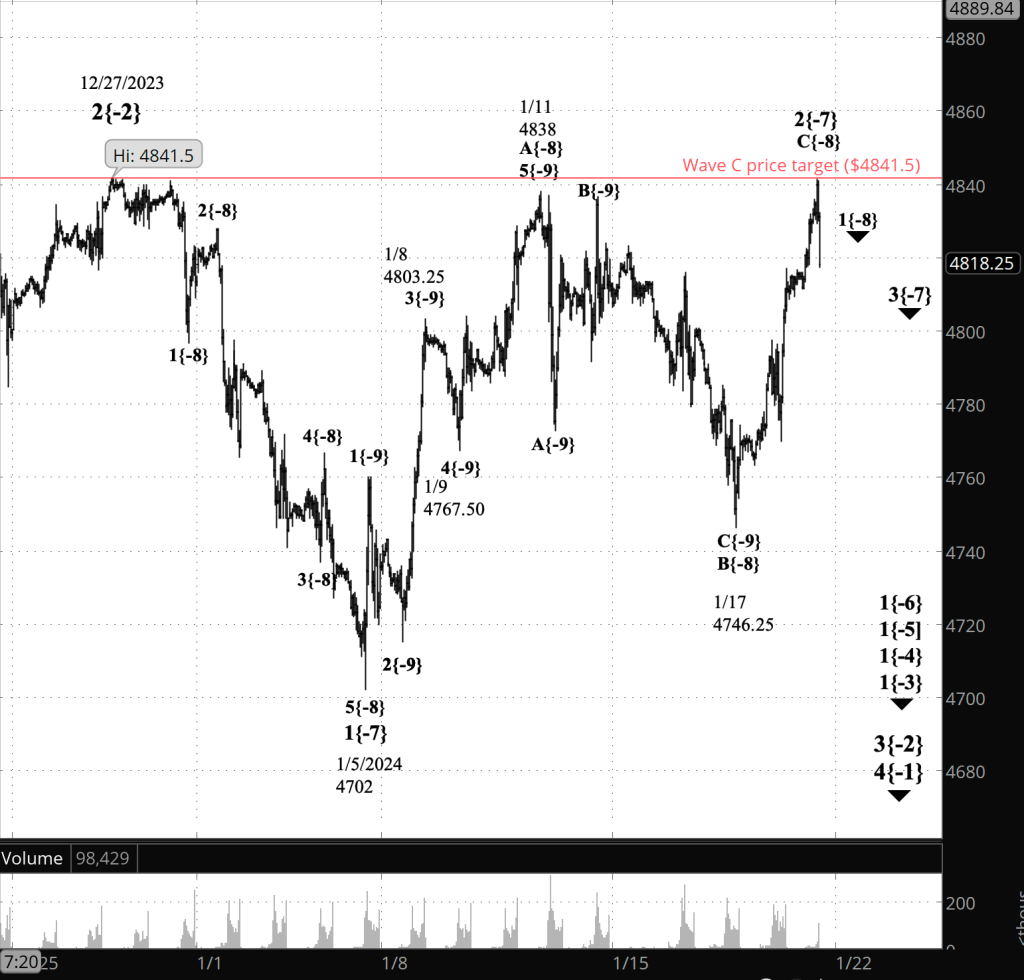
Half an hour before the closing bell. The S&P 500 futures peaked at 4933.25 during the session and then declined, approaching 4900 as the closing bell drew near. The rise and decline are part of a low-degree uptrending 5th wave that began on January 23.
I tentatively count the decline as being a 4th-wave downward correction within the larger uptrend. If the price again rises past the peak then my tentative count is a proper match for the chart. If the decline continues, then the odds increase that wave 5 ended at the session peak. The end of the preceding 1st wave, 4886.25, is the lowest the 4th wave can go under a rule of Elliott Wave Theory. A typical low point for a downward correction is the 4th subwave within the preceding 3rd wave: About where it is now.
I’ve updated the chart.
2:50 p.m. New York time
Trades. I exited by short bull put Vertical Spread on SPY, which I entered yesterday, for a 51% profit and have updated the trade analysis with results.
I entered a short bull put spread on QQQ and posted a trade analysis.
9:35 a.m. New York time
What’s happening now? The S&P 500 E-mini futures rose overnight from the around 4900 into the 4920s.
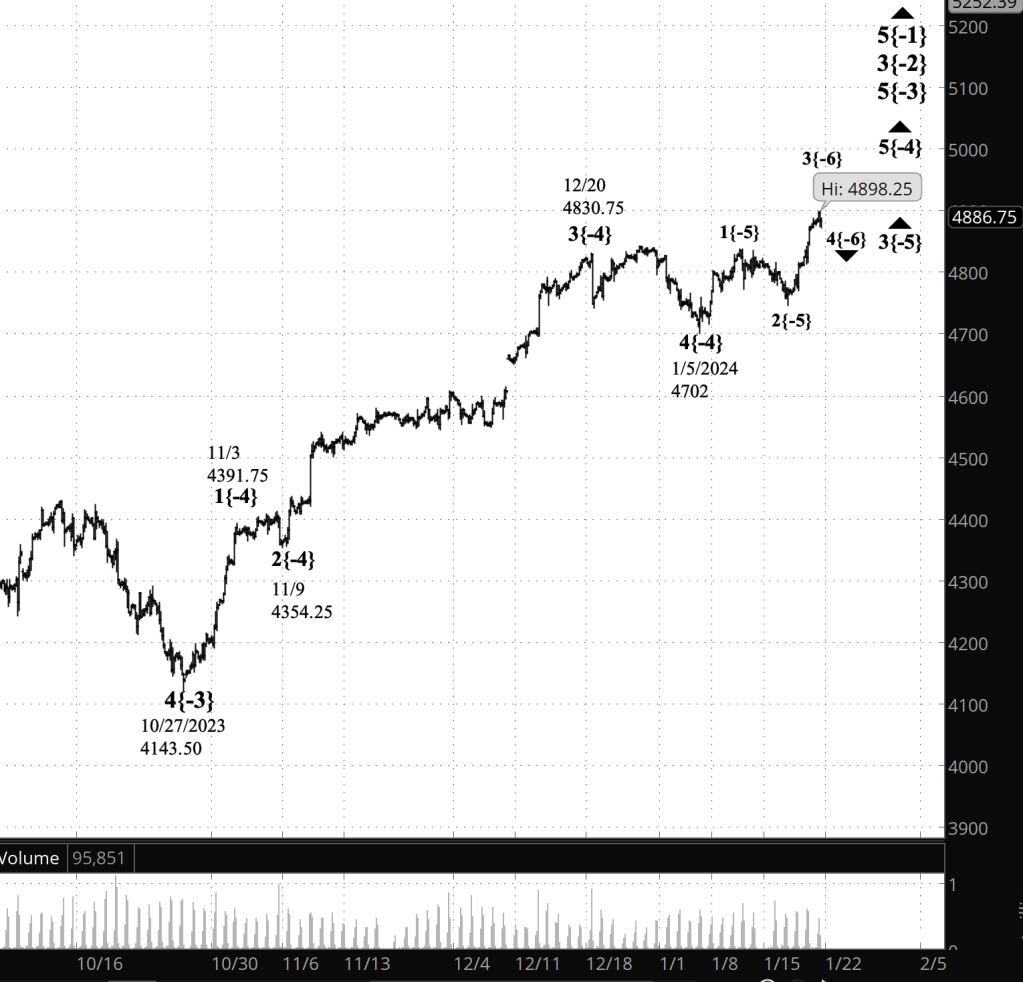
What does it mean? Using the model of Elliott Wave theory, a 3rd wave uptrend that began on October 27, 2023 is underway and is working through its end game. A subwave two levels lower within the fractal structure of the chart is an uptrending 5th wave within a larger 5th wave.
On the chart, each wave is numbered, and its degree — its placement within the fractal structure — is indicated by a number showing the distance from what in Elliott Wave Theory is called an Intermediate wave — in this case, wave 5{0}, which began on December 26, 2018.
The 3rd wave uptrend is wave 3{-2}. Within it, waves 5{-3}, 5{-4} and 5{-5}.
When the smallest of the set, wave 5{-5}, is complete, it will also mark the endpoint of waves 5{-4, 5{-3} and 3{-2}. A downward correction, wave 4{-2}, will follow. If it is typical of its degree, it will last for months.
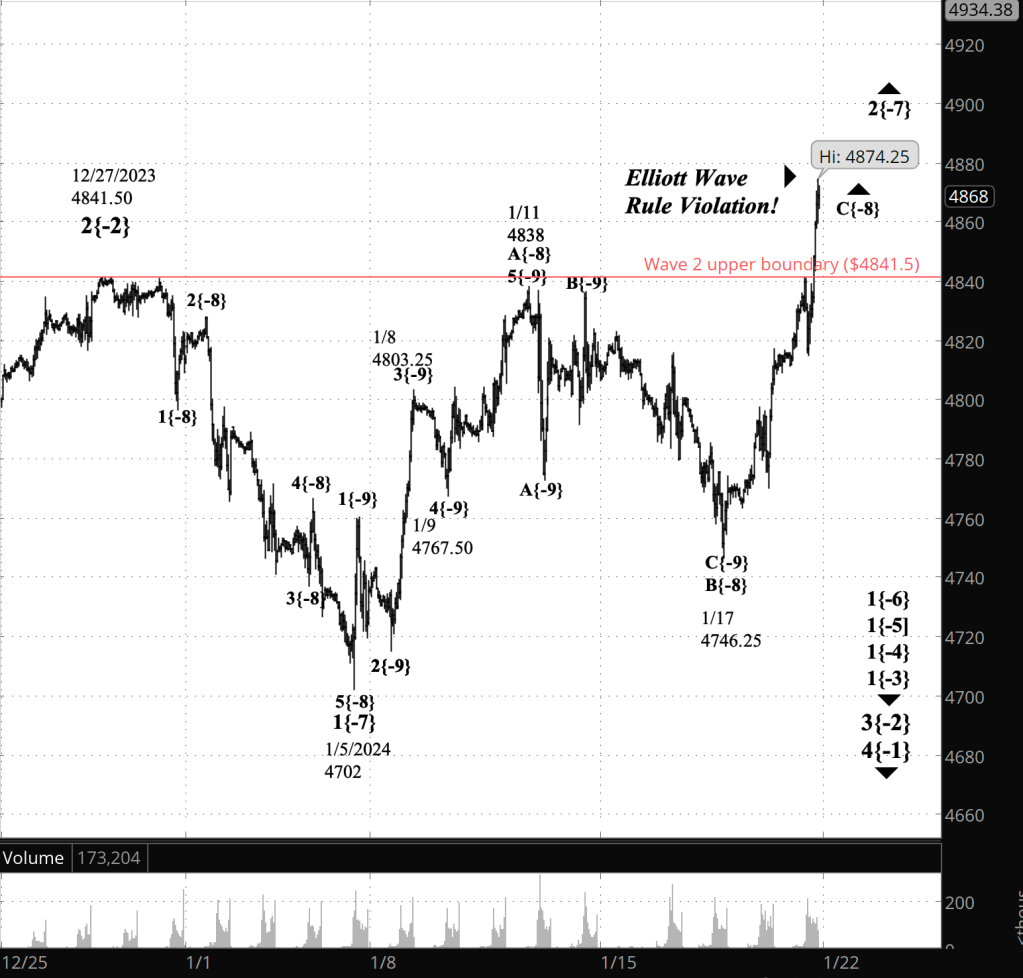
What are the alternatives? There is rarely clarity about the degrees in relation to a fixed level. For example, is wave 5{-3} really at degree {-3}, or should it be {-4}? There’s no way to know for sure.

[S&P 500 E-mini futures at 3:30 p.m., 30-minute bars, with volume]
What does Elliott wave theory say? Here are the waves that underly the analyses.
Principal Analysis:
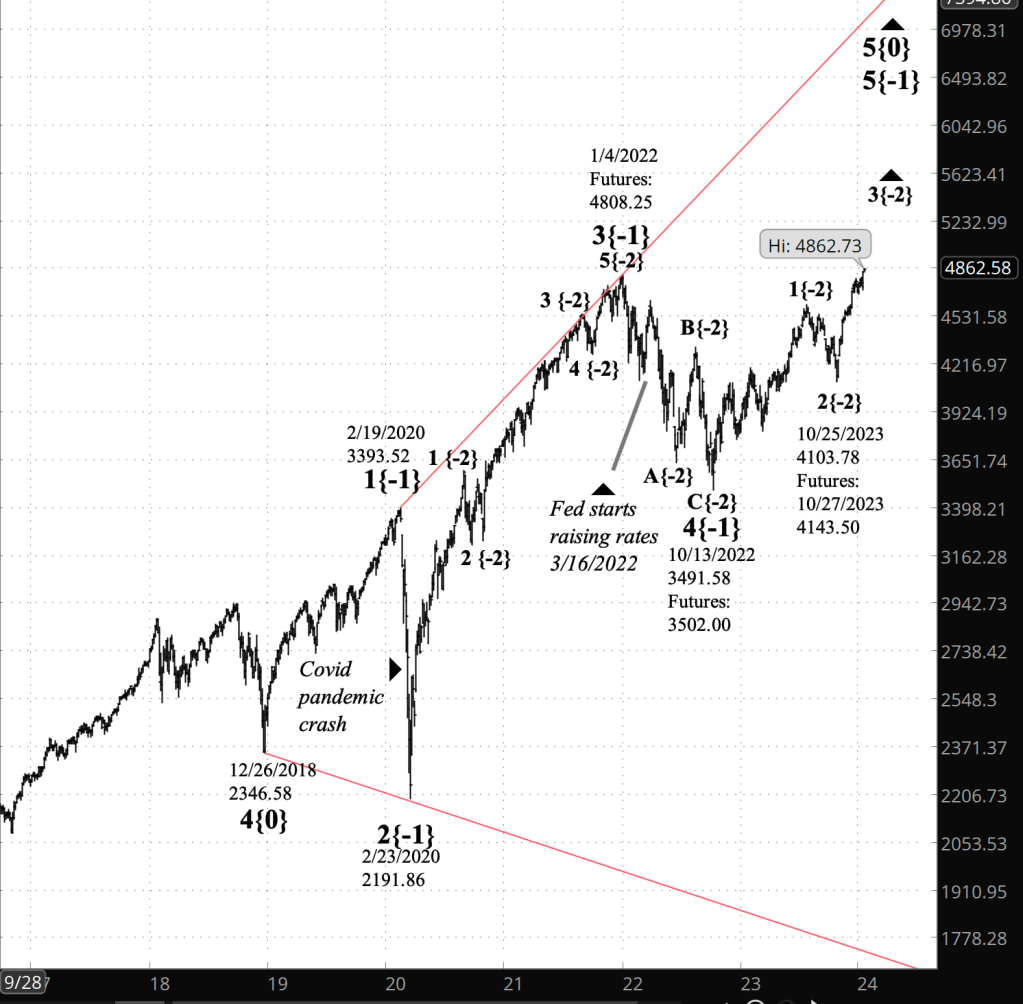
- Wave 5{0}, an expanding Diagonal Triangle, began on December 26, 2018.
- Within it, an uptrend, wave 5{-1}, began on October 13, 2022 and is underway.
- Wave 5{-1} is the parent wave of a uptrend, wave 3{-2}, that began on October 25, 2023 and is in wave 5{-3}, the last of five subwaves.
- Wave 5{-3} is in turn in its last subwave, wave 5{-4}. When wave 5{-4} is complete, it will also be the end of waves 5{-3} and 3{-2}, and a downward correction, wave 4{-4}, will begin.
We Are Here.
These are the waves currently in progress under my principal analysis. Each line on the list shows the wave number, with the subscript in curly brackets, the traditional degree name, the starting date, the starting price of the S&P 500 E-mini futures, and the direction of the wave.
- S&P 500 Index:
- 5{+3} Supercycle, 7/8/1932, 4.40 (up)
- 5{+2} Cycle, 12/9/1974, 60.96 (up)
- 5{+1} Primary, 3/6/2009, 666.79 (up)
- 5{0} Intermediate, 12/26/2018, 2346.58 (up)
- S&P 500 Futures and index:
- 5{-1} Minor, 10/13/2022, 3502 (up) (futures), 3491.58 (up) (index)
- S&P 500 Futures:
- 3{-2} Minute, 10/27/2023, 4143.50 (up)
Reading the chart. Price movements — waves – – in Elliott wave analysis are labeled with numbers within trending waves and letters with corrective waves. The subscripts — numbers in curly brackets — designate the wave’s degree, which, in Elliott wave analysis, means the relative position of a wave within the larger and smaller structures that make up the chart. R.N. Elliott, who in the 1930s developed the form of analysis that bears his name, viewed the chart as a complex structure of smaller waves nested within larger waves, which in turn are nested within still larger waves. In mathematics it’s called a fractal structure, where at every scale the pattern is similar to the others.
Learning and other resources. Elliott wave analysis provides context, not prophecy. As the 20th century semanticist Alfred Korzybski put it in his book Science and Sanity (1933), “The map is not the territory … The only usefulness of a map depends on similarity of structure between the empirical world and the map.” And I would add, in the ever-changing markets, we can judge that similarity of structure only after the fact.
See the menu page Analytical Methods for a rundown on where to go for information on Elliott wave analysis.
By Tim Bovee, Portland, Oregon, January 24, 2024
Disclaimer
Tim Bovee, Private Trader tracks the analysis and trades of a private trader for his own accounts. Nothing in this blog constitutes a recommendation to buy or sell stocks, options or any other financial instrument. The only purpose of this blog is to provide education and entertainment.
No trader is ever 100 percent successful in his or her trades. Trading in the stock and option markets is risky and uncertain. Each trader must make trading decisions for his or her own account, and take responsibility for the consequences.
License
All content on Tim Bovee, Private Trader by Timothy K. Bovee is licensed under a Creative Commons Attribution-ShareAlike 4.0 International License.
Based on a work at www.timbovee.com.

You must be logged in to post a comment.