3:30 p.m. New York time
Half an hour before the closing bell. The S&P 500 futures has traded sideways during the session, ranging from the 4450s to the 4470s and then narrowing as it repeatedly crossed the lower boundary of the expanding Diagonal Triangle that has been underway since August 9.
As of the time I’m posting, the price dropped to new lows within the triangle, to 4151.25 when I produced the chart, and immediately thereafter down to 4448.25.
As was the case this morning, the triangle’s present rising subwave, wave 4{-7}, remains well below the upper boundary, it’s eventual target. The decline that began on August 14 hasn’t broken far enough below the lower boundary to justify declaring the August 9 peak to be the end of a truncated wave 4{-7} and the beginning of the final subwave, wave 5{-7}.
So for now, I’m sticking with this morning’s analysis. Wave 4{-7} continues. However, it is a close call between that scenario and this morning’s Alternative #1, the wave 5{-7} scenario.
I’ve updated the chart.
9:35 a.m. New York time
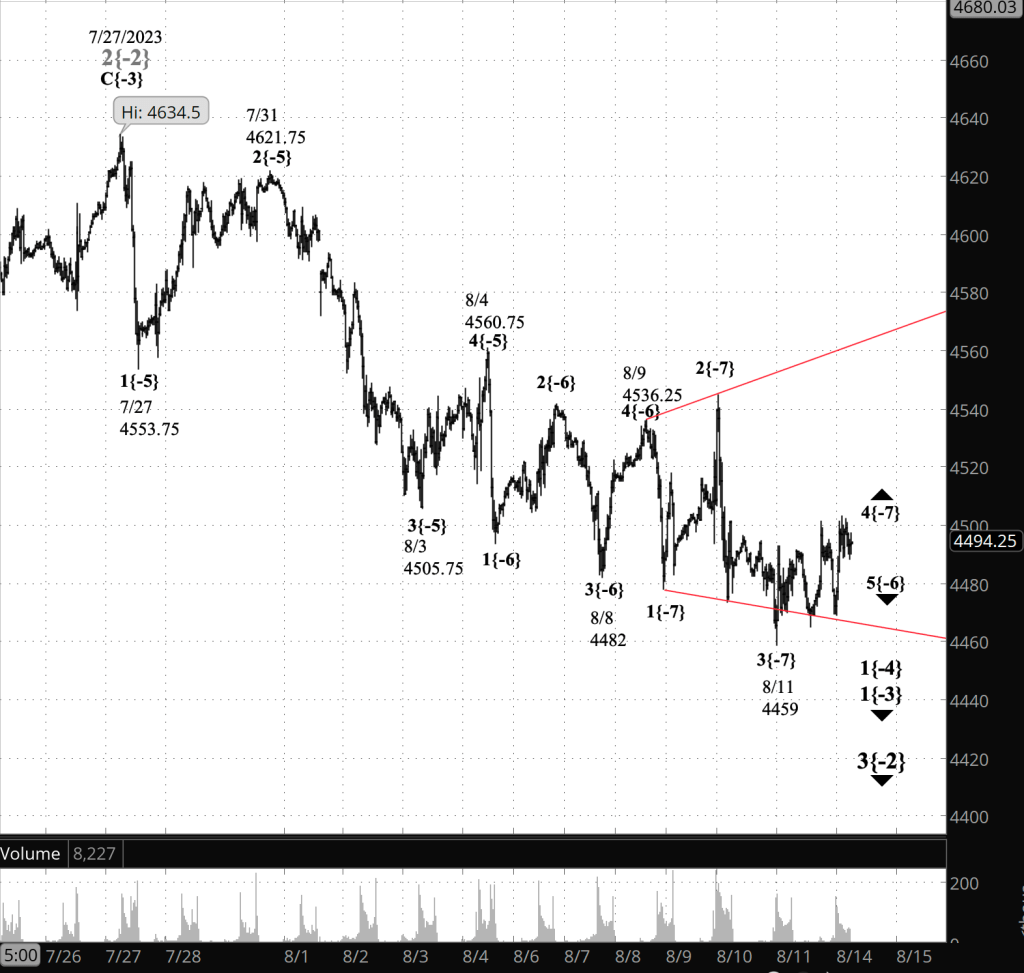
What’s happening now? The S&P 500 E-mini futures peaked overnight at 4517.85 and then fell back to the 4470s.
What does it mean? The rise carried the price about halfway to the upper boundary of an expanding Diagonal Triangle that began on August 9, and the subsequent decline has come close to the lower boundary. Based on the typical form taken by an expanding Diagonal Triangle, I expect a reversal with the rise carrying the price above the overnight high. (The triangle boundaries are marked on the chart n red.)
The rise that began on August 11 is the 4th of five subwaves of the Triangle, wave 4{-7}. Sometimes a 4th wave will fail to reach the triangle boundary, and if that is the case, then the overnight rise was the final leg of wave 4{-7} and the subsequent decline is part of the triangle’s final subwave, wave 5{-7}.
At this point I think it’s more likely that the 4th wave is still underway.
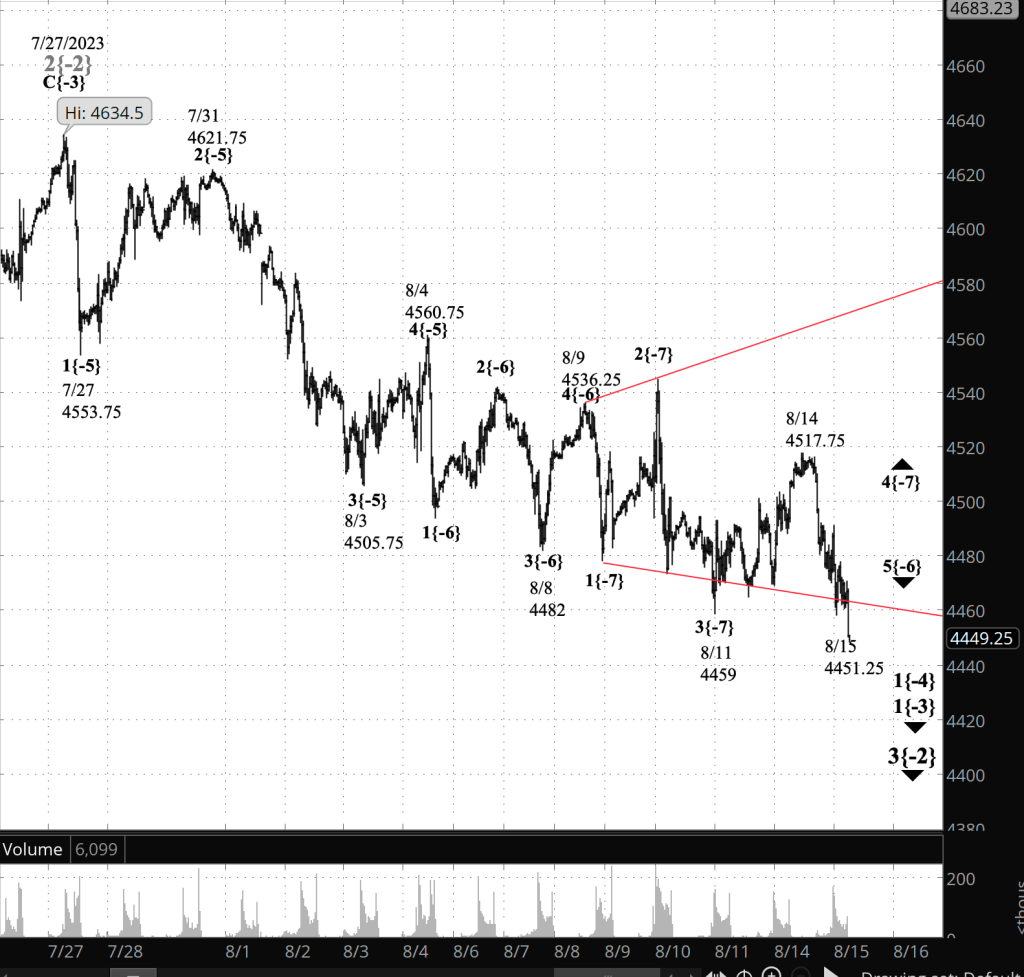
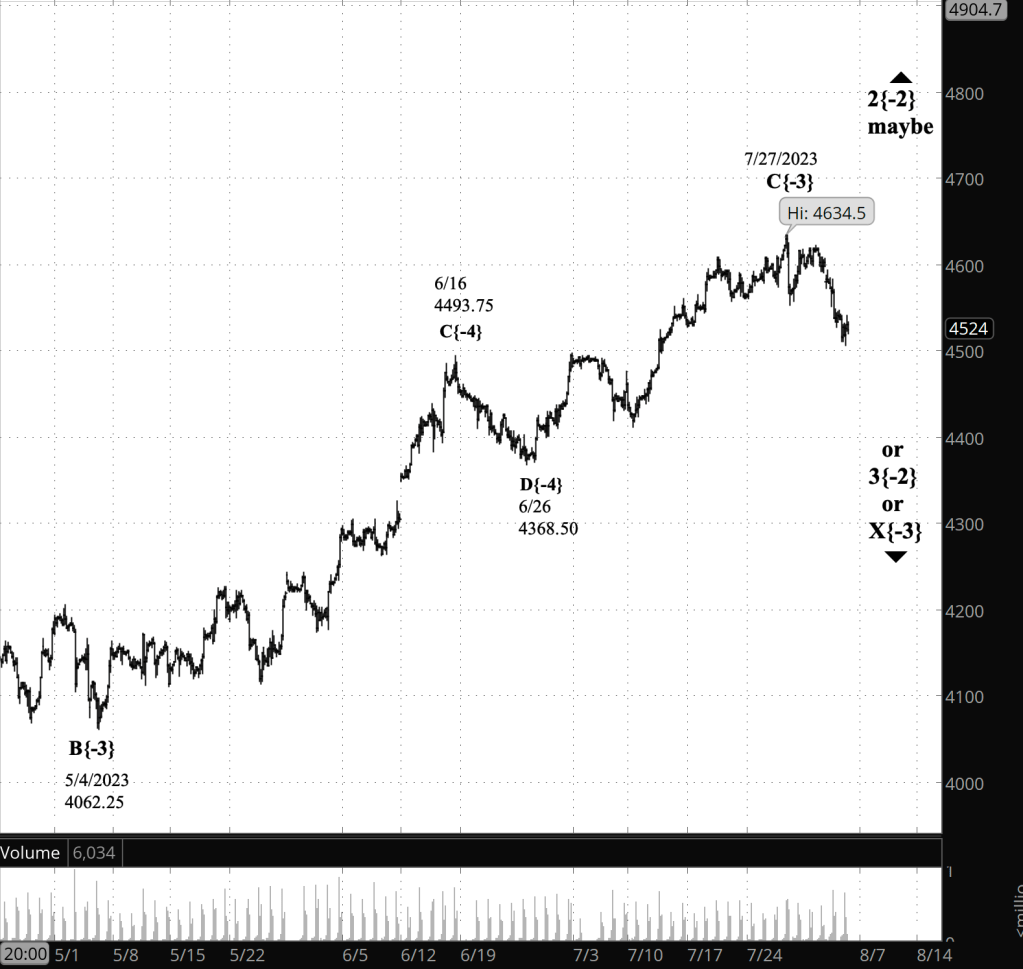
[S&P 500 E-mini futures at 3:30 p.m., 30-minute bars, with volume]
What are the alternatives? There are three:
Alternative #1: Final wave scenario
- Rising wave 4{-7}, a subwave of wave 5{-6}, an expanding Diagonal Triangle, ended today, August 16, at 4517.75. Declining wave 5{-7}, the final subwave of the triangle, began from that point.
Alternative #2: Connector wave scenario
The long-running upward correction, wave 2{-2}, that has dominated the chart since last autumn may still be underway. Wave 2{-2} ran from 3502 to 4634.50. The low so far in the subsequent decline is 4459. That means that the decline has retraced only 15.5% of the upward correction, meaning that the scenario seeing the present decline as connecting two corrective patterns within an ongoing upward correction remains plausible.
- Wave 2{-2}, an upward compound correction that began on October 13, 2022 completed a second corrective pattern on July 27.
- The subsequent decline is wave X{-3}, a downward connector between the second corrective pattern and the future third corrective pattern.
- Once the third corrective pattern within wave 2{-2} has ended, a powerful downtrend, wave 3{-2}, will follow.
Alternative #3:
- I have listed the Triangle as being the from of wave 5{-6}. It’s still early days in the decline from July 27, and that wave’s degree could be higher — wave 5{-5} or wave 5{-4}.
What does Elliott wave theory say? Here are the waves that underly the analyses.
Principal analysis:
- A downward correction, wave 3{-2}, began on July and is underway.
- Internally, the correction is in its first subwave, wave 1{-3}.
- Within wave 1{-3}, things become a bit more ambiguous, since the precise degree of the subwaves won’t become clear until the downtrend has progressed further.
- I’ve chosen, as a guess, to label the subwave of wave 1{-3} as being in its first wave, 1{-4}, which in turn is in its final subwave, wave 5{-5}.
- The final subwave within wave 5{-5} began overnight. Declining wave 5{-6} is now underway.
- Wave 5{-6} is its 2nd of five subwaves, an upward correction designated wave 2{-7}.
Alternative analysis:
- Wave 2{-2}, and upward compound correction that began on October 13, 2022 completed a second corrective pattern on July 27.
- The subsequent decline is wave X{-3}, a downward connector between the second corrective pattern and the future third corrective pattern.
- Once the third corrective pattern within wave 2{-2} has ended, a powerful downtrend, wave 3{-2}, will follow
We Are Here.
These are the waves currently in progress under my principal analysis. Each line on the list shows the wave number, with the subscript in curly brackets, the traditional degree name, the starting date, the starting price of the S&P 500 E-mini futures, and the direction of the wave.
- S&P 500 Index:
- 5{+3} Supercycle, 7/8/1932, 4.40 (up)
- 5{+2} Cycle, 12/9/1974, 60.96 (up)
- 5{+1} Primary, 3/6/2009, 666.79 (up)
- 5{0} Intermediate, 12/26/2018, 2346.58 (up)
- S&P 500 Futures and index:
- 4{-1} Minor, 1/4/2022, 4953.25 (down) (futures), 4818.62 (down) (index)
- S&P 500 Futures:
- 3{-2} Minute, 7/27/2023, 4634.50 (down) [The beginning price was in error and has been corrected.]
Reading the chart. Price movements — waves – – in Elliott wave analysis are labeled with numbers within trending waves and letters with corrective waves. The subscripts — numbers in curly brackets — designate the wave’s degree, which, in Elliott wave analysis, means the relative position of a wave within the larger and smaller structures that make up the chart. R.N. Elliott, who in the 1930s developed the form of analysis that bears his name, viewed the chart as a complex structure of smaller waves nested within larger waves, which in turn are nested within still larger waves. In mathematics it’s called a fractal structure, where at every scale the pattern is similar to the others.
Learning and other resources. Elliott wave analysis provides context, not prophecy. As the 20th century semanticist Alfred Korzybski put it in his book Science and Sanity (1933), “The map is not the territory … The only usefulness of a map depends on similarity of structure between the empirical world and the map.” And I would add, in the ever-changing markets, we can judge that similarity of structure only after the fact.
See the menu page Analytical Methods for a rundown on where to go for information on Elliott wave analysis.
By Tim Bovee, Portland, Oregon, August 15, 2023
Disclaimer
Tim Bovee, Private Trader tracks the analysis and trades of a private trader for his own accounts. Nothing in this blog constitutes a recommendation to buy or sell stocks, options or any other financial instrument. The only purpose of this blog is to provide education and entertainment.
No trader is ever 100 percent successful in his or her trades. Trading in the stock and option markets is risky and uncertain. Each trader must make trading decisions for his or her own account, and take responsibility for the consequences.
License
All content on Tim Bovee, Private Trader by Timothy K. Bovee is licensed under a Creative Commons Attribution-ShareAlike 4.0 International License.
Based on a work at www.timbovee.com.


You must be logged in to post a comment.