Trader’s Notebook

3:30 p.m.. New York time

Half an hour before the closing bell. The S&P 500 futures moved slightly higher during the session, reaching 4436.75, and continued to keep the 61.8% Fibonacci retracement level in a firm embrace as the optimists and the pessimists battle over the future course of the price.

I’ve updated the chart, keeping the wave labeling as it was this morning, showing the first subwave, wave A, nearing completion within the 4th wave upward correction that began in late October. It’s equally likely that the session high marked the end of wave A, and wave B is now underway.

9:35 a.m. New York time

What’s happening now? The S&P 500 E-mini futures stayed within a narrow range after trading resumed overnight, remaining below the 61.8% Fibonacci retracement level.

What does it mean?

The 4th wave upward correction that began on October 27 continues and is near the end of its first subwave, an A wave, or perhaps wave A ended at 4425.75, the November 10 high.

A 4th wave typically ends within the 4th subwave of the preceding 3rd wave. This A wave has already arrived at the upper boundary, which coincides with the 61.8% Fibonacci retracement level.

Here is the main question posed by the chart: Is wave A complete or not? If it is complete, then declining wave B is underway. If its not complete, then wave A still has some upside left.

A secondary question asks:, What form is the 4th wave correction taking? The preceding 2nd wave took the form of a Zigzag, with five subwaves within the A wave. According to the tendency toward alternation, the 4th wave should be a Flat, with three subwaves within the A wave.

The A wave so far can be counted as having three subwaves, but that first subwave is extraordinarily long in comparison with the two subwaves that have followed. It’s not unheard of for waves to be somewhat sloppy in their construction, especially at a turning point, but it’s something to take note of.

In any case, when wave A is over, wave B begins, and the B wave always retraces 90% or more of the preceding A wave, and usually retraces 100% to 138%. So the correction has some serious downside ahead of it.

Changes in the analysis. Over the weekend I continued to analyze the chart, refining the rather hurried reworking of the Elliott Wave analysis I had done late in the session on Friday.

The main revision was to raise the degrees by two levels, so that degree {-5} became degree {-3}, and degree {-6} became degree {-4}. These are the highest degrees possible that are consistent with my long-standing {-2} degree label for the July 27 peak. The higher degrees also are more in line with the same degrees in earlier movements.

Otherwise, no changes. The relationship between subwaves of the ongoing downtrend, wave 3{-2}, remain unchanged from Friday’s analysis.

What are the alternatives? None at present, beyond the main question posed by this chart: Is wave A complete or not?

[S&P 500 E-mini futures at 3:30 p.m., 210-minute bars, with volume]

What does Elliott wave theory say? Here are the waves that underly the analyses.

Principal Analysis:

  • A downtrend, wave 3{-2}, began on July 27 and is underway.
  • Within wave 3{-2}, an upward correction, wave 4{-3}, began on October 27.
  • Wave 4{-3} internally has two possibilities, each of equal likelihood:
    • Either rising wave A{-4} continues and is nearing it’s end.
    • Or wave A{-4} ended on November 10 at 4425.75 and wave B{-4} began from that point.

We Are Here.

These are the waves currently in progress under my principal analysis. Each line on the list shows the wave number, with the subscript in curly brackets, the traditional degree name, the starting date, the starting price of the S&P 500 E-mini futures, and the direction of the wave.

  • S&P 500 Index:
  • 5{+3} Supercycle, 7/8/1932, 4.40 (up)
  • 5{+2} Cycle, 12/9/1974, 60.96 (up)
  • 5{+1} Primary, 3/6/2009, 666.79 (up)
  • 5{0} Intermediate, 12/26/2018, 2346.58 (up)
  • S&P 500 Futures and index:
  • 4{-1} Minor, 1/4/2022, 4953.25 (down) (futures), 4818.62 (down) (index)
  • S&P 500 Futures:
  • 3{-2} Minute, 7/27/2023, 4634.50 (down)
  • 4{-3} Minuette, 10/27/2023, 4122.25 (up)
  • A{-4} Subminuette, 10/27/2023, 4122.25 (up)

Reading the chart. Price movements — waves – – in Elliott wave analysis are labeled with numbers within trending waves and letters with corrective waves. The subscripts — numbers in curly brackets — designate the wave’s degree, which, in Elliott wave analysis, means the relative position of a wave within the larger and smaller structures that make up the chart. R.N. Elliott, who in the 1930s developed the form of analysis that bears his name, viewed the chart as a complex structure of smaller waves nested within larger waves, which in turn are nested within still larger waves. In mathematics it’s called a fractal structure, where at every scale the pattern is similar to the others.

Learning and other resources. Elliott wave analysis provides context, not prophecy. As the 20th century semanticist Alfred Korzybski put it in his book Science and Sanity (1933), “The map is not the territory … The only usefulness of a map depends on similarity of structure between the empirical world and the map.” And I would add, in the ever-changing markets, we can judge that similarity of structure only after the fact.

See the menu page Analytical Methods for a rundown on where to go for information on Elliott wave analysis.

By Tim Bovee, Portland, Oregon, November 13, 2023

Disclaimer

Tim Bovee, Private Trader tracks the analysis and trades of a private trader for his own accounts. Nothing in this blog constitutes a recommendation to buy or sell stocks, options or any other financial instrument. The only purpose of this blog is to provide education and entertainment.

No trader is ever 100 percent successful in his or her trades. Trading in the stock and option markets is risky and uncertain. Each trader must make trading decisions for his or her own account, and take responsibility for the consequences.

License
Creative Commons License

All content on Tim Bovee, Private Trader by Timothy K. Bovee is licensed under a Creative Commons Attribution-ShareAlike 4.0 International License.

Based on a work at www.timbovee.com.

Options Trades 11/10/2023: IWM

Symbols traded today: IWM (10DTE)

I explored BMY, MCD and DUK as potential bear plays and couldn’t get any to work, based on either the Elliott wave status or the inability to get a reasonable return for the risk. I finally settled for one of my regulars…

IWM short Bear Call Vertical Spread

I’ve entered a position on IWM, 10 days to expiration, based on Elliott Wave analysis that shows it entering a downtrending 5th wave.

LOT:3ENTRY DATE:11/10/2023

Entry and Exit

CREDIT (ENTRY)
Options premium$ 1.10
ENTRY
Stock price$ 169.21
Implied Volatility Rate24.6
Days to expiration10

The structure of the position

STRUCTURESTRIKEODDS EXPIRE OTMDELTA
Calls
Long176.0090.0%10
Break-even172.0676.0%24
Short171.0062.0%38

Risk and Reward

Per contract:
Reward110.00
Risk390.00
R/R Ratio (n:1)3.5

By Tim Bovee, Portland, Oregon, November 10, 2023

Disclaimer

Tim Bovee, Private Trader tracks the analysis and trades of a private trader for his own accounts. Nothing in this blog constitutes a recommendation to buy or sell stocks, options or any other financial instrument. The only purpose of this blog is to provide education and entertainment.

No trader is ever 100 percent successful in his or her trades. Trading in the stock and option markets is risky and uncertain. Each trader must make trading decisions for his or her own account, and take responsibility for the consequences.

License
Creative Commons License

All content on Tim Bovee, Private Trader by Timothy K. Bovee is licensed under a Creative Commons Attribution-ShareAlike 4.0 International License.

Based on a work at www.timbovee.com.

Trader’s Notebook

3:30 p.m. New York time

Half an hour before the closing bell. The S&P 500 futures, the S&P 500 index and the S&P 500 exchange traded fund, SPY, all moved above the mid-October that was the beginning point of a 1st wave. The rise above that level was labeled as a 2nd wave, and in moving above the 1st-wave starting point, wave 2 broke a firm rule of Elliott Wave Theory: No 2nd wave can move beyond the start of the preceding 1st wave. If it does, then something else is going on.

As the semanticist Alfred Korzybski put it in his book Science and Sanity (1933), “The map is not the territory … The only usefulness of a map depends on similarity of structure between the empirical world and the map.”

When the map no longer matches the territory, then the map must change. When the analysis no longer matches the chart, it’s back to the Elliott Wave drawing board.

Which is how I’ve spent my time since about 2 p.m. New York time today.

The following discussion will make use of wave numbers and their degree subscripts (the number in curly brackets). The degree subscript shows the number of degrees removed from what classical Elliott Wave Theory calls the Intermediate degree. Since the numbers are negative on this chart, we know that the waves are subwaves of wave 4{0}, which began in January 2022.

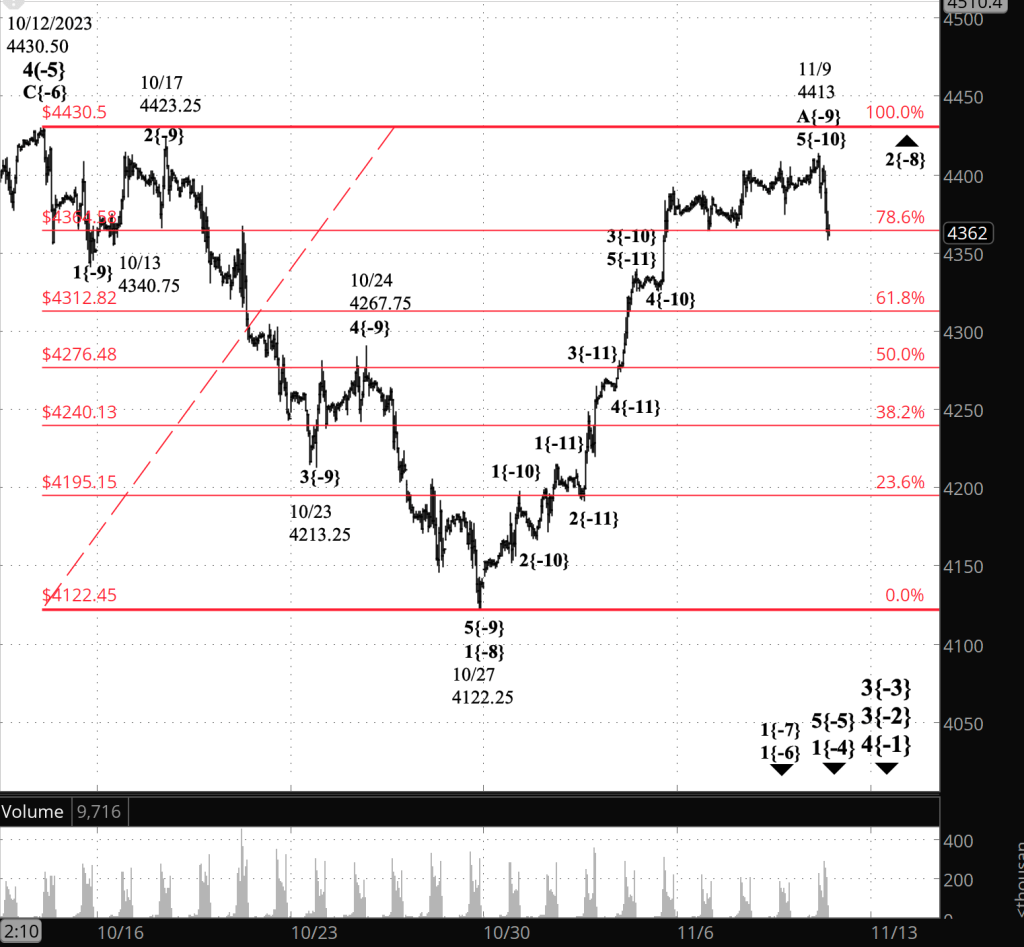
Under the new chart: Rising wave 4{-5} is underway and is in its first subwave, also rising, wave A{-6}.

Wave 4{-5} replaces what had been, under the former analysis, wave 2{-8} and its 1st subwave, wave A{-9}.

The Elliott Wave Theory rule for 4th waves is that they never move beyond the endpoint of the preceding 1st wave of the same degree. Wave 1{-5}.

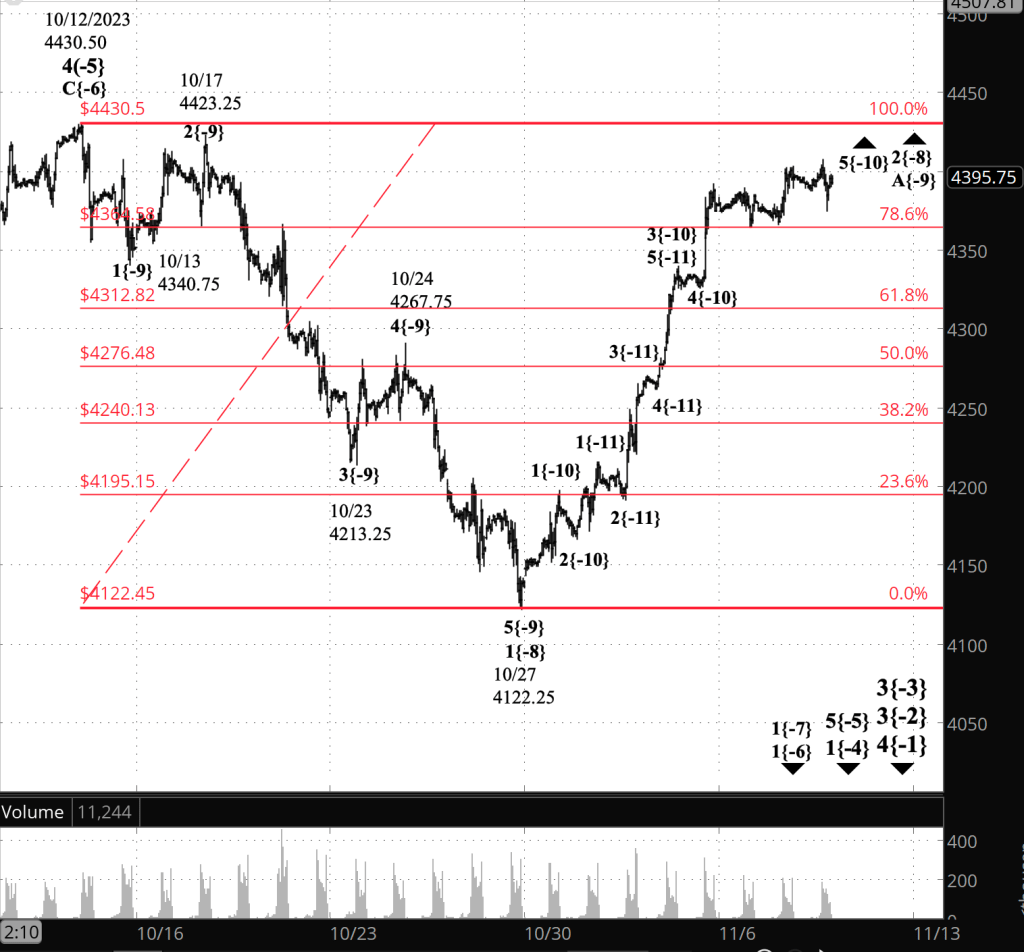
Here a chart showing the new analysis. I’ve retained this morning’s old analysis below for comparison. This is definitely a work in progress, and I’ll be working further on the analysis over the weekend.

[S&P 500 E-mini futures after the closing bell., 210-minute bars, with volume]

One thing that is likely to happen with the new analysis is that the degree labels will be changed. As always, the degree of wave is more a guess than a certainty.

2 p.m. New York time

Entered IWM 10-day position. I’ve entered a short Bear Call Vertical Spread on IWM, 10 days to expiration, based on Elliott wave analysis, and have posted an analysis of the trade.

11:40 a.m. New York time

A look ahead to next week. Two market-moving economic reports will be released next week, The Consumer Price Index on Tuesday and the Producer Price Index on Wednesday, each at 8:30 a.m., an hour before the U.S. markets open. I’ll be avoiding entry of any 1DTE (one day to expiration) trades the day before each report is published. That means no 1DTE in-trades on Monday and Tuesday.

My longer positions, such as the 9DTEs, will be trades as usual.

11:15 a.m. New York time

Exited SPY, XLE 1-day positions. I’ve exited my short Iron Fly positions on SPY and XLE, on expiration day, and have updated their trade analyses with results. Both were profitable.

9:35 a.m. New York time

What’s happening now? The S&P 500 E-mini futures traded sideways overnight, staying close to the 78.6% Fibonacci retracement level, which is in the 4360s . The Fibonacci ladder is shown on the chart in red. As the opening bell approached, the price rose into the 4380s.

What does it mean? If the price breaks sharply below that Fibonacci level, then it becomes more likely that the first subwave, rising wave A, of the 2nd-wave upward correction that began in late October is complete, and the second subwave, declining wave B, has begun.

If the price rises noticeably above the Fibonacci level, then the likelihood increases that wave A is not yet complete and will almost certainly move above the correction high so far, 4413.

A wave B tends to retrace 38% to 79% of the preceding A wave. If the B wave is truly underway then typically it would end more or less between 4302 and 4182. That’s a tendency, not a rule.

If the A wave is truly still underway, under a rule of Elliott Wave Theory a 2nd wave cannot move beyond starting point of the preceding 1st wave. That limits the A wave on the upside to 4430.50 and below.

What are the alternatives? Different day, same verse. Under the principal analysis, the whole degree structure on the chart may be larger than the underlying reality. Elliott Wave Theory contains no robust way of determining which degree a wave belongs to. So the wave I’ve labeled as wave 2{-8} may well be larger or smaller than degree {-8}. The only indication is to compare the size of the wave in question to the size of prior waves in the same position tend to be proportional to other waves in the same position. Sussing that out will be a project for the weekend.

[Outdated. See the new chart above. S&P 500 E-mini futures at 9:35 a.m., hourly bars, with volume]

What does Elliott wave theory say? Here are the waves that underly this afternoon’s analyses.

  • A downtrend, wave 3{-2}, began on July 27 and is underway.
  • Within wave 3{-2}, an upward correction, wave 4{-5}, began on October 27 and is in its initial subwave, wave A{-6}.

We Are Here.

These are the waves currently in progress under my principal analysis. Each line on the list shows the wave number, with the subscript in curly brackets, the traditional degree name, the starting date, the starting price of the S&P 500 E-mini futures, and the direction of the wave.

  • S&P 500 Index:
  • 5{+3} Supercycle, 7/8/1932, 4.40 (up)
  • 5{+2} Cycle, 12/9/1974, 60.96 (up)
  • 5{+1} Primary, 3/6/2009, 666.79 (up)
  • 5{0} Intermediate, 12/26/2018, 2346.58 (up)
  • S&P 500 Futures and index:
  • 4{-1} Minor, 1/4/2022, 4953.25 (down) (futures), 4818.62 (down) (index)
  • S&P 500 Futures:
  • 4{-5} Minute, 10/27/2023, 4122.25 (up)

Reading the chart. Price movements — waves – – in Elliott wave analysis are labeled with numbers within trending waves and letters with corrective waves. The subscripts — numbers in curly brackets — designate the wave’s degree, which, in Elliott wave analysis, means the relative position of a wave within the larger and smaller structures that make up the chart. R.N. Elliott, who in the 1930s developed the form of analysis that bears his name, viewed the chart as a complex structure of smaller waves nested within larger waves, which in turn are nested within still larger waves. In mathematics it’s called a fractal structure, where at every scale the pattern is similar to the others.

Learning and other resources. Elliott wave analysis provides context, not prophecy. As the 20th century semanticist Alfred Korzybski put it in his book Science and Sanity (1933), “The map is not the territory … The only usefulness of a map depends on similarity of structure between the empirical world and the map.” And I would add, in the ever-changing markets, we can judge that similarity of structure only after the fact.

See the menu page Analytical Methods for a rundown on where to go for information on Elliott wave analysis.

By Tim Bovee, Portland, Oregon, November 10, 2023

Disclaimer

Tim Bovee, Private Trader tracks the analysis and trades of a private trader for his own accounts. Nothing in this blog constitutes a recommendation to buy or sell stocks, options or any other financial instrument. The only purpose of this blog is to provide education and entertainment.

No trader is ever 100 percent successful in his or her trades. Trading in the stock and option markets is risky and uncertain. Each trader must make trading decisions for his or her own account, and take responsibility for the consequences.

License
Creative Commons License

All content on Tim Bovee, Private Trader by Timothy K. Bovee is licensed under a Creative Commons Attribution-ShareAlike 4.0 International License.

Based on a work at www.timbovee.com.
Options Trades 11/9/2023: SPY XLE

Symbols traded today: SPY, XLE

SPY Entry short Iron Fly

LOT:12ENTRY DATE:11/9/2023
EXIT DATE:11/10/2023

Entry and Exit

METRICCREDITDEBITCHANGECHANGE %
Options premium$ 2.03$ 1.84$ 0.1910.3%
METRICENTRYEXITCHANGECHANGE %
Stock price$ 435.07$ 435.59$ (0.52)$0.52
Impllied Volatility Rate21.616.74.9-4.9
Days to expiration10

The structure of the position

STRUCTURESTRIKEODDS EXPIRE OTMDELTA
Calls
Long438.0082.0%18
Break-even437.0366.5%34.5
Short435.0051.0%51
Puts
Short435.0050.0%49
Break-even434.0364.5%35.5
Long432.0079.0%22

Risk and Reward

Per contract:
Reward203.00
Risk97.00
R/R Ratio (n:1)0.5

XLE Entry short Iron Fly

LOT:1ENTRY DATE:11/9/2023
EXIT DATE:11/10/2023

Entry and Exit

METRICCREDITDEBITCHANGECHANGE %
Options premium$ 0.80$ 0.73$ 0.079.6%
METRICENTRYEXITCHANGECHANGE %
Stock price$ 82.55$ 83.43$ (0.88)$0.88
Impllied Volatility Rate18.416.71.7-1.7
Days to expiration10

The structure of the position

STRUCTURESTRIKEODDS EXPIRE OTMDELTA
Calls
Long84.5092.0%5
Break-even83.8079.0%20
Short83.0066.0%35
Puts
Short83.0034.0%66
Break-even81.8064.5%37
Long81.0095.0%8

Risk and Reward

Per contract:
Reward80.00
Risk95.00
R/R Ratio (n:1)1.2

By Tim Bovee, Portland, Oregon, November 9, 2023

Disclaimer

Tim Bovee, Private Trader tracks the analysis and trades of a private trader for his own accounts. Nothing in this blog constitutes a recommendation to buy or sell stocks, options or any other financial instrument. The only purpose of this blog is to provide education and entertainment.

No trader is ever 100 percent successful in his or her trades. Trading in the stock and option markets is risky and uncertain. Each trader must make trading decisions for his or her own account, and take responsibility for the consequences.

License
Creative Commons License

All content on Tim Bovee, Private Trader by Timothy K. Bovee is licensed under a Creative Commons Attribution-ShareAlike 4.0 International License.

Based on a work at www.timbovee.com.
Trader’s Notebook

3:30 p.m. New York time

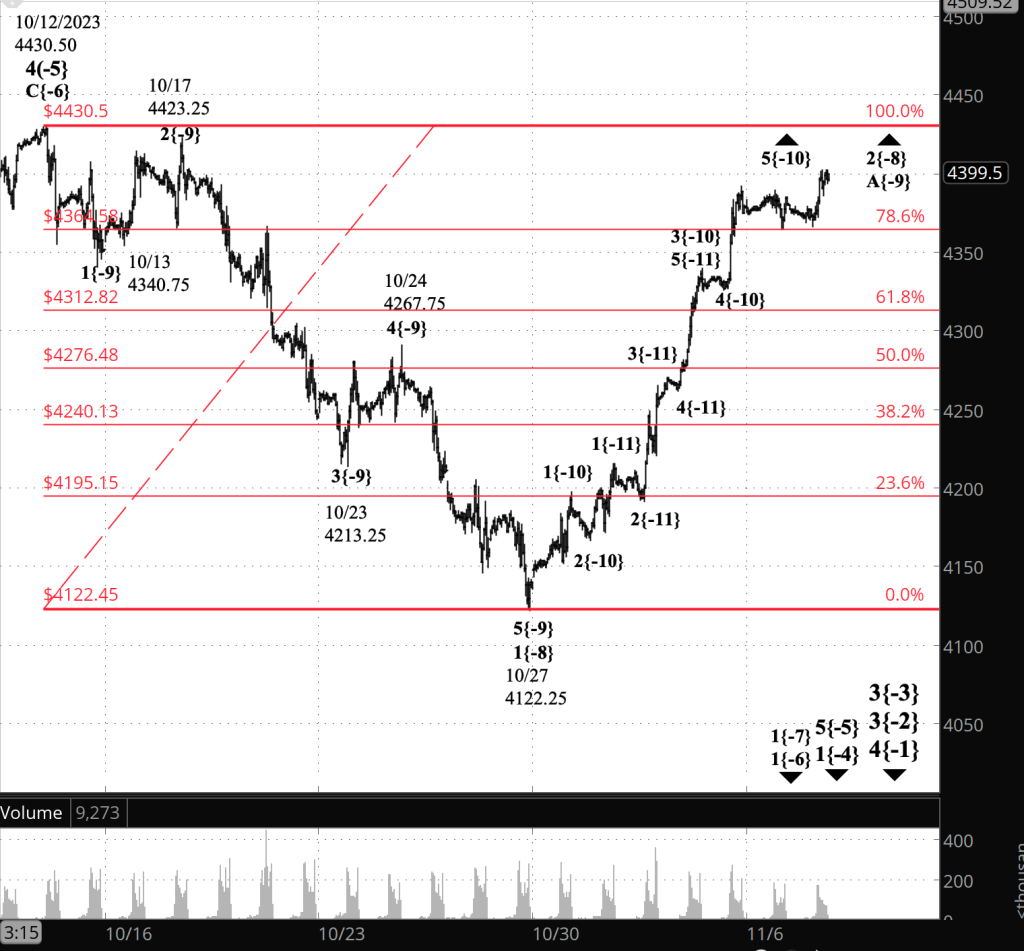
Half an hour before the closing bell. The S&P 500 futures fell during the session, reaching below the 78.6% Fibonacci retracement level as the closing bell approached.

The breach of that support point persuaded me to relabel the chart: The first subwave, wave A, within the present 2nd-wave upward correction ended today at 4413, and declining wave B has begun.

Having done that, the two scenarios of almost equal likelihood are still in play. The price could reverse to the upside and return to the level of today’s high. That could mean that wave A has not yet ended.

I’ve updated the chart and am awaiting further indications that the B wave is truly underway.

3:15 p.m. New York time

Entry SPY, XLE. I’ve posted an analysis of today’s two trades, short Iron Fly positions on SPY and XLE, each expiring the next day.

2:50 p.m. New York time

Exited short Bear Call Vertical Spread IWM. I’ve exited my position on IWM for a profit and have updated yesterday’s options trade analysis with results.

11:55 a.m. New York time

Exited short Iron Fly position on QQQ. I’ve updated yesterday’s options trades post with results of my short Iron Fly position on QQQ, entered one day before expiration and exited on expiration day for a profit.

9:35 a.m. New York time

What’s happening now? The S&P 500 E-mini futures rose overnight, reaching 4413, and then pulled back slightly at the opening bell.

What does it mean? The rise brought the first subwave of a 2nd wave upward correction to yet another peak. The correction began on October 22 from 4122.25.

The first subwave is an A wave, and will be followed by a declining B wave and then a rising C wave, which will complete the corrective pattern.

The 2nd wave was, of course, preceded by a downtrending 1st wave. The new high brings the A wave to fewer than 20 points of the start the 1st have. That’s important because one of the few firm rules of Elliott Wave Theory says that a 2nd wave never moves above the start of the 1st wave that came before it. See the “Reading the Chart” section below for more on the subject.

This 2nd wave, is cutting it very close. The 1st wave began from 4430.50.

If the 2nd wave does in fact move above that level, then the analysis doesn’t match the reality on the chart. The 2nd wave isn’t really a second wave. Something else is going on.

For what follows, I’ll need to use the degree indicators, which place each wave in relation to other waves within the complex fractal structure of the chart. The degree is labeled by a subscript, in curly brackets, that shows its relationship to a larger wave, called the Intermediate degree by R.N. Elliott, the developer of Elliott Wave Theory. The Intermediate wave is wave {0}. A degree of {-3} would be three degrees smaller than wave {0}.

Tentatively, the most likely scenario, if 4430.50 should be breached, goes like this:

  • The 1st wave began from 4566 on September 14, presently labeled as the start of wave 3{-3}.
  • The low on October 27, presently labeled the end of wave 1{-8} and the start of wave 2{-8}, is the end of wave 3{-4}.
  • The subsequent rise, rather than being a 2nd wave, is a 4th wave, wave 4{-4}

Under the rules of Elliott Wave Analysis, a 4th wave can move beyond the start of the preceding 1st wave — no rules broken, no harm, no foul.

But that’s all hypothetical. The A wave for now remains below the start of the preceding 1st wave, then the present principal analysis is intact. The 2nd wave is underway and is in its A subwave.

What are the alternatives? Under the principal analysis, the whole degree structure on the chart may be larger than the underlying reality. I’ll be giving that a closer look, in light of the 2nd wave’s close approach to the start of the 1st wave, and may renumber the subwaves.

[S&P 500 E-mini futures at 3:30 p.m., 50-minute bars, with volume]

What does Elliott wave theory say? Here are the waves that underly the analyses.

Principal Analysis:

  • A downtrend, wave 3{-2}, began on July 27 and is underway.
  • Within wave 3{-2}, a smaller downtrend, wave 3{-3}, began on September 14 and is in its initial subwave, wave 1{-4}.
  • With wave 1{-4}, subwave 5{-5}, an downtrend, is underway, having begun on October 12.
  • Wave 5{-5} is in its first subwave, wave 1{-6}.
  • Within waves 1{-6} and 1{-7} are underway.
  • Wave 1{-7} is in its 2nd subwave, an upward correction, wave 2{-8}.
  • Internally, wave 2{-8} is in its first subwave, rising wave A{-9}.
  • Within wave 2{-8} I see two possibilities of equal likelihood:
    • Wave A{-9} continues and is its 5th and final subwave.
    • Wave A{-9} ended on November 7 at 4403.25 and wave B{-9} began.

Alternative Analysis

  • The upward correction, wave 2{-8}, is a higher degree or a lower degree than is shown on the chart.

We Are Here.

These are the waves currently in progress under my principal analysis. Each line on the list shows the wave number, with the subscript in curly brackets, the traditional degree name, the starting date, the starting price of the S&P 500 E-mini futures, and the direction of the wave.

  • S&P 500 Index:
  • 5{+3} Supercycle, 7/8/1932, 4.40 (up)
  • 5{+2} Cycle, 12/9/1974, 60.96 (up)
  • 5{+1} Primary, 3/6/2009, 666.79 (up)
  • 5{0} Intermediate, 12/26/2018, 2346.58 (up)
  • S&P 500 Futures and index:
  • 4{-1} Minor, 1/4/2022, 4953.25 (down) (futures), 4818.62 (down) (index)
  • S&P 500 Futures:
  • 3{-2} Minute, 7/27/2023, 3502 (down)

Reading the chart. Price movements — waves – – in Elliott wave analysis are labeled with numbers within trending waves and letters with corrective waves. The subscripts — numbers in curly brackets — designate the wave’s degree, which, in Elliott wave analysis, means the relative position of a wave within the larger and smaller structures that make up the chart. R.N. Elliott, who in the 1930s developed the form of analysis that bears his name, viewed the chart as a complex structure of smaller waves nested within larger waves, which in turn are nested within still larger waves. In mathematics it’s called a fractal structure, where at every scale the pattern is similar to the others.

Learning and other resources. Elliott wave analysis provides context, not prophecy. As the 20th century semanticist Alfred Korzybski put it in his book Science and Sanity (1933), “The map is not the territory … The only usefulness of a map depends on similarity of structure between the empirical world and the map.” And I would add, in the ever-changing markets, we can judge that similarity of structure only after the fact.

See the menu page Analytical Methods for a rundown on where to go for information on Elliott wave analysis.

By Tim Bovee, Portland, Oregon, November 9, 2023

Disclaimer

Tim Bovee, Private Trader tracks the analysis and trades of a private trader for his own accounts. Nothing in this blog constitutes a recommendation to buy or sell stocks, options or any other financial instrument. The only purpose of this blog is to provide education and entertainment.

No trader is ever 100 percent successful in his or her trades. Trading in the stock and option markets is risky and uncertain. Each trader must make trading decisions for his or her own account, and take responsibility for the consequences.

License
Creative Commons License

All content on Tim Bovee, Private Trader by Timothy K. Bovee is licensed under a Creative Commons Attribution-ShareAlike 4.0 International License.

Based on a work at www.timbovee.com.
Options Trades 11/8/2023: IWM QQQ

Symbols traded today: IWM, QQQ

IWM short Bear Call Vertical Spread (9DTE)

LOT:3ENTRY DATE:11/8/2023
EXIT DATE:11/9/2023

Entry and Exit

CREDIT (ENTRY)DEBIT (EXIT)CHANGECHANGE %
Options premium$ 0.78$ 0.39$ 0.39100.0%
ENTRYEXITCHANGECHANGE %
Stock price$ 169.95$ 167.50$ (2.45)-1.4%
Implied Volatility Rate28.430.82.4
Days to expiration98-1

The structure of the position

STRUCTURESTRIKEODDS EXPIRE OTMDELTA
Calls
Long175.0081.0%19
Break-even172.7872.0%27.5
Short172.0063.0%36

Risk and Reward

Per contract:
Reward78.00
Risk222.00
R/R Ratio (n:1)2.8

QQQ short Iron Fly (1DTE)

LOT:4ENTRY DATE:11/8/2023
EXIT DATE:11/9/2023

Entry and Exit

METRICCREDITDEBITCHANGECHANGE %
Options premium$ 2.00$ 1.91$ 0.094.7%
METRICENTRYEXITCHANGECHANGE %
Stock price$ 372.85$ 373.56$ (0.71)$0.71
Impllied Volatility Rate8.58.6-0.10.1
Days to expiration10

The structure of the position

STRUCTURESTRIKEODDS EXPIRE OTMDELTA
Calls
Long376.0082.0%19
Break-even375.0067.0%33.5
Short373.0052.0%48
Puts
Short373.0048.0%52
Break-even372.0063.0%37
Long370.0078.0%22

Risk and Reward

Per contract:
Reward200.00
Risk100.00
R/R Ratio (n:1)0.5

By Tim Bovee, Portland, Oregon, November 8, 2023

Disclaimer

Tim Bovee, Private Trader tracks the analysis and trades of a private trader for his own accounts. Nothing in this blog constitutes a recommendation to buy or sell stocks, options or any other financial instrument. The only purpose of this blog is to provide education and entertainment.

No trader is ever 100 percent successful in his or her trades. Trading in the stock and option markets is risky and uncertain. Each trader must make trading decisions for his or her own account, and take responsibility for the consequences.

License
Creative Commons License

All content on Tim Bovee, Private Trader by Timothy K. Bovee is licensed under a Creative Commons Attribution-ShareAlike 4.0 International License.

Based on a work at www.timbovee.com.

Trader’s Notebook

3:30 p.m. New York time

Half an hour before the market close. The S&P 500 futures fell to the 4370s during the session and then rose, remaining below the 2nd wave upward correction’s peak so far of 4407.75. This morning’s principal analysis continues with it’s uncertainty: Either the 4407.75 peak is a stopping point in the ongoing late stage of the initial subwave, the rising A wave, within the correction, or the correction ended at the peak and the falling B wave is underway.

I’ve updated the chart.

2:40 p.m. New York time

Entered SPY short Iron Fly, IWM short Bear Call Spread. I’ve entered two options positions today, one on IWM, at 9 days to expiration (DTE), and the other on SPY, at 1DTE, and have posted analyses of the trades.

11:05 a.m. New York time

Exited SPY short Iron Fly. I’ve exited the short Iron Fly options position on SPY, entered yesterday, and have updated the November 7 trades analysis with full results.

9:35 a.m. New York time

What’s happening now? The S&P 500 E-mini futures traded sideways overnight, rising above 4405 at the opening bell.

What does it mean? The first subwave, wave A, of the 2nd-wave upward correction that began on October 27 continues trying to find its endpoint. The price has moved decisively above a major Fibonacci turning point, a 78.6% retracement, and has come within 30 points of the start of the preceding 1st wave, 4430.50.

Under the rules of Elliott Wave Analysis, no 2nd wave can move above the 1st wave starting point.

All of that means that wave A within wave 2 is almost complete, according to one of two equally likely scenarios. Under the other scenario, wave A ended at yesterday’s peak.

Whenever wave A ends, it will be followed by a downtrending B wave, and then a C wave that will push up to complete the 2nd wave. An energetic 3rd wave downtrend will following, carrying the below the start of the 2nd wave correction, 4122.25, and likely a significant distance below that level.

On the chart, I’ve chosen to use the scenario that has wave A still underway.

What are the alternatives? There is one, unchanged from the past few days. The alternative scenario is this: The degree of the subwaves within the rise so far from October 27 are a bit up in the air. What we see is certainly part of wave 2{-8}. But is it really of the {-8} degree, or something lower or higher? It’s not yet clear on the chart. If the degree differs from what I have on the chart, then the subwaves would also be adjusted accordingly.

[S&P 500 E-mini futures at 3:30 p.m., 50-minute bars, with volume]

What does Elliott wave theory say? Here are the waves that underly the analyses.

Principal Analysis:

  • A downtrend, wave 3{-2}, began on July 27 and is underway.
  • Within wave 3{-2}, a smaller downtrend, wave 3{-3}, began on September 14 and is in its initial subwave, wave 1{-4}.
  • With wave 1{-4}, subwave 5{-5}, an downtrend, is underway, having begun on October 12.
  • Wave 5{-5} is in its first subwave, wave 1{-6}.
  • Within waves 1{-6} and 1{-7} are underway.
  • Wave 1{-7} is in its 2nd subwave, an upward correction, wave 2{-8}.
  • Internally, wave 2{-8} is in its first subwave, rising wave A{-9}.
  • Within wave 2{-8} I see two possibilities of equal likelihood:
    • Wave A{-9} continues and is its 5th and final subwave.
    • Wave A{-9} ended on November 7 at 4403.25 and wave B{-9} began.

Alternative Analysis

  • The upward correction, wave 2{-8}, is a higher degree or a lower degree than is shown on the chart.

We Are Here.

These are the waves currently in progress under my principal analysis. Each line on the list shows the wave number, with the subscript in curly brackets, the traditional degree name, the starting date, the starting price of the S&P 500 E-mini futures, and the direction of the wave.

  • S&P 500 Index:
  • 5{+3} Supercycle, 7/8/1932, 4.40 (up)
  • 5{+2} Cycle, 12/9/1974, 60.96 (up)
  • 5{+1} Primary, 3/6/2009, 666.79 (up)
  • 5{0} Intermediate, 12/26/2018, 2346.58 (up)
  • S&P 500 Futures and index:
  • 4{-1} Minor, 1/4/2022, 4953.25 (down) (futures), 4818.62 (down) (index)
  • S&P 500 Futures:
  • 3{-2} Minute, 7/27/2023, 3502 (down)

Reading the chart. Price movements — waves – – in Elliott wave analysis are labeled with numbers within trending waves and letters with corrective waves. The subscripts — numbers in curly brackets — designate the wave’s degree, which, in Elliott wave analysis, means the relative position of a wave within the larger and smaller structures that make up the chart. R.N. Elliott, who in the 1930s developed the form of analysis that bears his name, viewed the chart as a complex structure of smaller waves nested within larger waves, which in turn are nested within still larger waves. In mathematics it’s called a fractal structure, where at every scale the pattern is similar to the others.

Learning and other resources. Elliott wave analysis provides context, not prophecy. As the 20th century semanticist Alfred Korzybski put it in his book Science and Sanity (1933), “The map is not the territory … The only usefulness of a map depends on similarity of structure between the empirical world and the map.” And I would add, in the ever-changing markets, we can judge that similarity of structure only after the fact.

See the menu page Analytical Methods for a rundown on where to go for information on Elliott wave analysis.

By Tim Bovee, Portland, Oregon, November 8, 2023

Disclaimer

Tim Bovee, Private Trader tracks the analysis and trades of a private trader for his own accounts. Nothing in this blog constitutes a recommendation to buy or sell stocks, options or any other financial instrument. The only purpose of this blog is to provide education and entertainment.

No trader is ever 100 percent successful in his or her trades. Trading in the stock and option markets is risky and uncertain. Each trader must make trading decisions for his or her own account, and take responsibility for the consequences.

License
Creative Commons License

All content on Tim Bovee, Private Trader by Timothy K. Bovee is licensed under a Creative Commons Attribution-ShareAlike 4.0 International License.

Based on a work at www.timbovee.com.

Options Trades 11/7/2023: SPY

Symbol traded today: SPY (1DTE)

SPY Entry short Iron Fly

LOT:11ENTRY DATE:11/7/2023
EXIT DATE:11/8/2023

Entry and Exit

METRICCREDITDEBITCHANGECHANGE %
Options premium$ 1.61$ 1.44$ 0.1711.8%
METRICENTRYEXITCHANGECHANGE %
Stock price$ 437.22$ 437.43$ (0.21)$0.21
Impllied Volatility Rate18.116.71.4-1.4
Days to expiration10

The structure of the position

STRUCTURESTRIKEODDS EXPIRE OTMDELTA
Calls
Long439.0073.0%26
Break-even438.6160.0%39
Short437.0047.0%52
Puts
Short437.0054.0%47
Break-even435.6170.0%31
Long434.0086.0%15

Risk and Reward

Per contract:
Reward161.00
Risk89.00
R/R Ratio0.6:1

By Tim Bovee, Portland, Oregon, November 7, 2023

Disclaimer

Tim Bovee, Private Trader tracks the analysis and trades of a private trader for his own accounts. Nothing in this blog constitutes a recommendation to buy or sell stocks, options or any other financial instrument. The only purpose of this blog is to provide education and entertainment.

No trader is ever 100 percent successful in his or her trades. Trading in the stock and option markets is risky and uncertain. Each trader must make trading decisions for his or her own account, and take responsibility for the consequences.

License
Creative Commons License

All content on Tim Bovee, Private Trader by Timothy K. Bovee is licensed under a Creative Commons Attribution-ShareAlike 4.0 International License.

Based on a work at www.timbovee.com.

Trader’s Notebook

3:30 p.m. New York time

Half an hour before the closing bell. The S&P 500 futures rose above the overnight high during the session, reaching 4402.50.

The move resolved this morning’s choice between two scenarios in favor of wave A being underway, and wave B still lying in the future. This dilemma involves subwaves of the 2nd wave upward correction that began on October 27.

Nonetheless, the price is still near a peak, and any higher high triggers the same question: Is wave A over and wave B begun, or is wave A still underway.

A B wave typically retraces 38% to 79% of the preceding A wave. Based on the session high, the typical B wave would fall to between 4343.75 and 4228.75.

I’ve updated the chart, showing the A wave as still underway.

3:05 p.m. New York time

Today’s trade. I’ve entered a short iron fly position on SPY that expires tomorrow and have posted a trade analysis.

11:55 a.m. New York time

11/6 Trades Results. I’ve exited my positions on IWM and QQQ, and have updated the trade analyses with results.

9:35 a.m. New York time

What’s happening now? The S&P 500 E-mini futures traded narrowly overnight, largely sticking to the region of the 78.6% Fibonacci retracement level. (The Fibonacci ladder is shown on the chart in red.)

What does it mean? The 2nd wave upward correction that began on October 27 continues. There are two possibilities of equal likelihood interpreting how far it has traveled in its three-subwave journey.

By one interpretation, the 1st subwave of the correction, the A wave, was completed by the November 3 high, 4391.75. That is the interpretation I’ve chosen for the chart. By the other interpretation, there is more upside left in the A wave and the shallow decline that followed the November 3 peak is just a pause to gather energy for a final upward push.

Elliott Wave Theory says that a 2nd wave can’t move beyond the starting point of the preceding 1st wave — 4430.50 in this case. If the A wave is in fact not yet complete, a final push upward can only have about 62 points remaining above the October 3 peak.

Under the scenario I chose for the chart, the second subwave of the correction, declining wave B, is now underway. The 2nd wave correction is taking the form of a Zigzag — Five subwaves in the A wave, three in the B and five in the C.

The B wave within a Zigzag typically retraces between 38% and 79% of the preceding A wave. As I calculated the Monday, November 6 post, that suggests the end point of wave B will be between 4289 and 4179.

What are the alternatives? There is one alternative. It has been with us for awhile and likely will stick around a while longer.

The alternative scenario is this: The degree of the subwaves within the rise so far from October 27 are a bit up in the air. What we see is certainly part of wave 2{-8}. But is it really of the {-8} degree, or something lower or higher? It’s not yet clear on the chart. If the degree differs from what I have on the chart, then the subwaves would also be adjusted accordingly.

[S&P 500 E-mini futures at 3:30.m., 45-minute bars, with volume]

What does Elliott wave theory say? Here are the waves that underly the analyses.

Principal Analysis:

  • A downtrend, wave 3{-2}, began on July 27 and is underway.
  • Within wave 3{-2}, a smaller downtrend, wave 3{-3}, began on September 14 and is in its initial subwave, wave 1{-4}.
  • With wave 1{-4}, subwave 5{-5}, an downtrend, is underway, having begun on October 12.
  • Wave 5{-5} is in its first subwave, wave 1{-6}.
  • Within waves 1{-6} and 1{-7} are underway.
  • Wave 1{-7} is in its 2nd subwave, an upward correction, wave 2{-8}.
  • Internally, wave 2{-8} is in its first subwave, rising wave A{-9}.
  • Within wave 2{-8} I see two possibilities of equal likelihood:
    • Wave A{-9} ended on November 3 at 4391.75 and wave B{-9} began
    • Wave A{-9} continues and is its 5th and final subwave.

Alternative Analysis

  • The upward correction, wave 2{-8}, is actually a higher degree or a lower degree than is shown on the chart.

We Are Here.

These are the waves currently in progress under my principal analysis. Each line on the list shows the wave number, with the subscript in curly brackets, the traditional degree name, the starting date, the starting price of the S&P 500 E-mini futures, and the direction of the wave.

  • S&P 500 Index:
  • 5{+3} Supercycle, 7/8/1932, 4.40 (up)
  • 5{+2} Cycle, 12/9/1974, 60.96 (up)
  • 5{+1} Primary, 3/6/2009, 666.79 (up)
  • 5{0} Intermediate, 12/26/2018, 2346.58 (up)
  • S&P 500 Futures and index:
  • 4{-1} Minor, 1/4/2022, 4953.25 (down) (futures), 4818.62 (down) (index)
  • S&P 500 Futures:
  • 3{-2} Minute, 7/27/2023, 3502 (down)

Reading the chart. Price movements — waves – – in Elliott wave analysis are labeled with numbers within trending waves and letters with corrective waves. The subscripts — numbers in curly brackets — designate the wave’s degree, which, in Elliott wave analysis, means the relative position of a wave within the larger and smaller structures that make up the chart. R.N. Elliott, who in the 1930s developed the form of analysis that bears his name, viewed the chart as a complex structure of smaller waves nested within larger waves, which in turn are nested within still larger waves. In mathematics it’s called a fractal structure, where at every scale the pattern is similar to the others.

Learning and other resources. Elliott wave analysis provides context, not prophecy. As the 20th century semanticist Alfred Korzybski put it in his book Science and Sanity (1933), “The map is not the territory … The only usefulness of a map depends on similarity of structure between the empirical world and the map.” And I would add, in the ever-changing markets, we can judge that similarity of structure only after the fact.

See the menu page Analytical Methods for a rundown on where to go for information on Elliott wave analysis.

By Tim Bovee, Portland, Oregon, November 7, 2023

Disclaimer

Tim Bovee, Private Trader tracks the analysis and trades of a private trader for his own accounts. Nothing in this blog constitutes a recommendation to buy or sell stocks, options or any other financial instrument. The only purpose of this blog is to provide education and entertainment.

No trader is ever 100 percent successful in his or her trades. Trading in the stock and option markets is risky and uncertain. Each trader must make trading decisions for his or her own account, and take responsibility for the consequences.

License
Creative Commons License

All content on Tim Bovee, Private Trader by Timothy K. Bovee is licensed under a Creative Commons Attribution-ShareAlike 4.0 International License.

Based on a work at www.timbovee.com.

Options Trades 11/6/2023: IWM QQQ

Symbols traded today: 1DTE: QQQ, 4DTE: IWM

IWM and QQQ have been updated with results.

IWM short Bear Call Vertical Spread 4DTE

IWM has higher volatility, defined as an IVR of 25% or higher, and I chose to use longer DTE (days to expiration) options. I had intended that it be a 9DTE trade, but I erred, and let’s see how it goes.

And the results. The IWM position produced a 63.6% profit before fees. So despite the DTE error, the position did quite well.

LOT:2ENTRY DATE:11/6/2023
EXIT DATE:11/7/2023

Entry and Exit

CREDIT (ENTRY)DEBIT (EXIT)CHANGECHANGE %
Options premium$ 0.54$ 0.33$ 0.2163.6%
ENTRYEXITCHANGECHANGE %
Stock price$ 172.45$ 171.10$ (1.35)-0.8%
Implied Volatility Rate31.230.1-1.1
Days to expiration43-1

The structure of the position

CALLS/PUTSSTRIKEODDS EXPIRE OTMDELTA
Long176.0079.0%22
Break-even174.5471.5%29.5
Short174.0064.0%37

Risk and Reward

PER CONTRACT
Reward54.00
Risk146.00
R/R Ratio (n:1)2.7

QQQ short Iron Fly

QQQ has meets my criteria for lower volatility, with an Implied Volatility Rank (IVR) of less than 25%, and so qualifies for a 1DTE trade.

The underlying share price rose by 0.8%, and that was enough to turn the position unprofitable.

LOT:3ENTRY DATE:11/6/2023
EXIT DATE:11/7/2023

Entry and Exit

CREDIT (ENTRY)DEBIT (EXIT)CHANGECHANGE %
Options premium$ 2.16$ 2.46$ (0.30)-12.2%
ENTRYEXITCHANGECHANGE %
Stock price$ 367.50$ 370.26$ 2.760.8%
Implied Volatility Rate16.012.1-3.9
Days to expiration10-1

The structure of the position

STRUCTURESTRIKEODDS EXPIRE OTMDELTA
Calls
Long370.0078.0%22
Break-even369.1667.0%33.5
Short367.0056.0%45
Puts
Short367.0054.0%46
Break-even365.1650.0%50
Long363.0046.0%54

Risk and Reward

Per contract:
Reward216.00
Risk134.00
R/R Ratio (n:1)0.6

By Tim Bovee, Portland, Oregon, November 6, 2023

Disclaimer

Tim Bovee, Private Trader tracks the analysis and trades of a private trader for his own accounts. Nothing in this blog constitutes a recommendation to buy or sell stocks, options or any other financial instrument. The only purpose of this blog is to provide education and entertainment.

No trader is ever 100 percent successful in his or her trades. Trading in the stock and option markets is risky and uncertain. Each trader must make trading decisions for his or her own account, and take responsibility for the consequences.

License
Creative Commons License

All content on Tim Bovee, Private Trader by Timothy K. Bovee is licensed under a Creative Commons Attribution-ShareAlike 4.0 International License.

Based on a work at www.timbovee.com.