2:35 p.m. New York time
Today’s decline in the markets — the Dow had dropped more than 300 points within the final two hours of grading — is a confirmation that the whimsical wandering market top has indeed dropped anchor, and we are now, at long last, in what Elliott wave analysis calls the 3rd wave down in the Intermediate degree.
And if the WWMT (whimsical wandering market top) again picks up anchor and drifts to a later date, i may blush slightly but will still feel satisfied with my analysis. A rapid decline of this magnitude almost always means that a change has occurred at one of the higher Elliott wave degrees.
The SPY chart covers one year with daily bars.
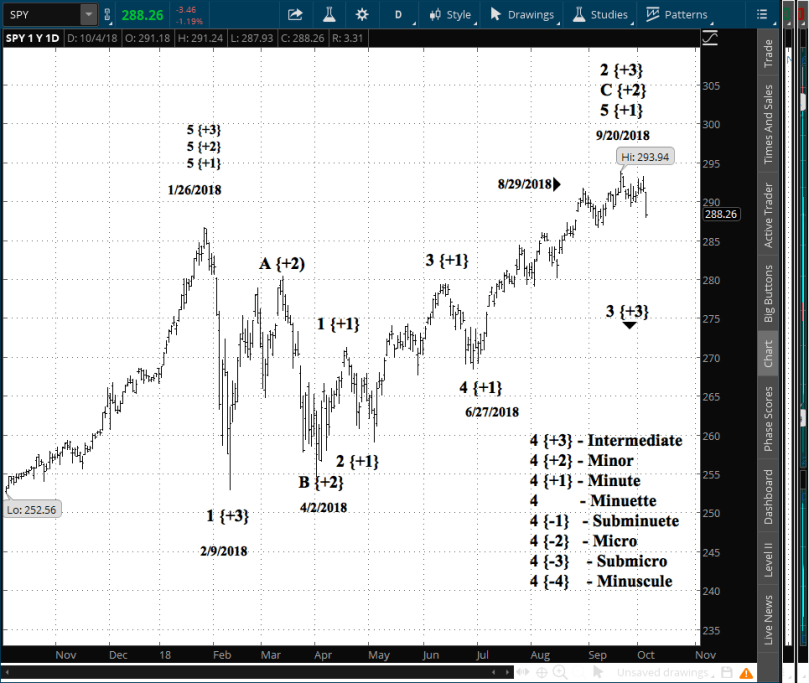
The peak was reached on Sept. 20. SPY traced a 1st wave to the downside at one of the much lower degrees. Today’s decline appears to me to be a 3rd wave within an impulse movement.
Implied volatility rose from 13% to 16%. Volume, though higher, had not spiked up by an amount comparable to the Sept. 20 peak, although today’s market day is not yet over, so any conclusion from volume — and IV — must be tentative.
From an options trading strategy standpoint, I shall follow my position management rules — at 50% of maximum potential profit for short iron condors and vertical spreads, and at 25% of max for iron flies. Otherwise, everything has pre-defined risk, so there’s no temptation for me to go blundering out at what proves to a turning point.
2:20 p.m. New York time
Here is how my options positions stand this afternoon. As is apparent, SPY was the only position impacted in a major way by today’s decline of the broad indexes.
| sym | option debit | share price | curr % max profit | net prft/shr $ | option days left |
| EWZ | 0.86 | 35.85 | 0.0 | 0.00 | 43 |
| JBL | 1.98 | 26.22 | (44.5) | (0.61) | 15 |
| LEN | 3.28 | 44.62 | (1.5) | (0.05) | 43 |
| SPY | 2.55 | 288.22 | 16.9 | 0.52 | 43 |
| STZ | 8.45 | 219.40 | (0.6) | (0.05) | 43 |
And this is how my shares positions stand.
| sym | share price | net result % | net profit $ | days held |
| AAPL | 227.99 | 1.8% | 4.03 | 20 |
| CHK | 4.58 | 14.5% | 0.58 | 20 |
| FXI | 40.56 | -1.6% | (0.65) | 20 |
| SPXU | 33.03 | -18.6% | (7.53) | 142 |
| TSLA | 278.86 | -8.6% | (26.13) | 3 |
| VNQI | 53.99 | -5.0% | (2.82) | 21 |
2:15 p.m. New York time
The major market indexes kept a steady decline beginning with the opening bell. My exposure to the S&P 500 is an options position in SPY and a shares position in SPXU.
The SPY position is presently at about 17% of maximum potential profit. My goal for the position, a short bear call vertical spread, is to manage it at 50% of max. The SPXU was fairly deep in loss and remains in loss, although shallower.
Bottom line: No action needed at this point. I shall be posting a SPY chart shortly with an Elliott wave analysis and discussion of today’s move.
10:25 a.m. New York time
I plan no exits from current positions today. Also, there are no potential earnings plays on the calendar. Bottom line: I anticipate no trades.
Today’s Book
Mastering the Market Cycle, by Howard Marks
We are more than nine years into the economic recovery, making this one of the longest recoveries ever. Today, every thoughtful trade must ask: Is it time for the next recession? Marks parses the cycle that is writing the markets’ future and our future net worth to gain a sense of what lies ahead and to help us get the odds on our side.
Here’s the status of my options positions:
| sym | option debit | share price | curr % max profit | net prft/shr $ | option days left |
| EWZ | 0.96 | 36.28 | (11.6) | (0.10) | 43 |
| JBL | 1.98 | 26.43 | (44.5) | (0.61) | 15 |
| LEN | 3.10 | 45.22 | 4.0 | 0.13 | 43 |
| SPY | 3.11 | 290.39 | (1.3) | (0.04) | 43 |
| STZ | 8.93 | 220.74 | (6.3) | (0.53) | 43 |
And my shares holdings:
| sym | share price | net result % | net profit $ | days held |
| AAPL | 229.81 | 2.6% | 5.85 | 20 |
| CHK | 4.70 | 17.5% | 0.70 | 20 |
| FXI | 41.03 | -0.4% | (0.18) | 20 |
| SPXU | 32.35 | -20.2% | (8.21) | 142 |
| TSLA | 288.48 | -5.4% | (16.51) | 3 |
| VNQI | 54.34 | -4.3% | (2.47) | 21 |
By Tim Bovee, Portland, Oregon, Oct. 4, 2018
Tim Bovee, Private Trader tracks the analysis and trades of a private trader for his own accounts. Nothing in this blog constitutes a recommendation to buy or sell stocks, options or any other financial instrument. The only purpose of this blog is to provide education and entertainment.
No trader is ever 100 percent successful in his or her trades. Trading in the stock and option markets is risky and uncertain. Each trader must make trading decisions for his or her own account, and take responsibility for the consequences.
License

All content on Tim Bovee, Private Trader by Timothy K. Bovee is licensed under a Creative Commons Attribution-ShareAlike 4.0 International License.
Based on a work at www.timbovee.com.L

You must be logged in to post a comment.