Live: Thursday, April 16, 2020

10:55 a.m. New York time

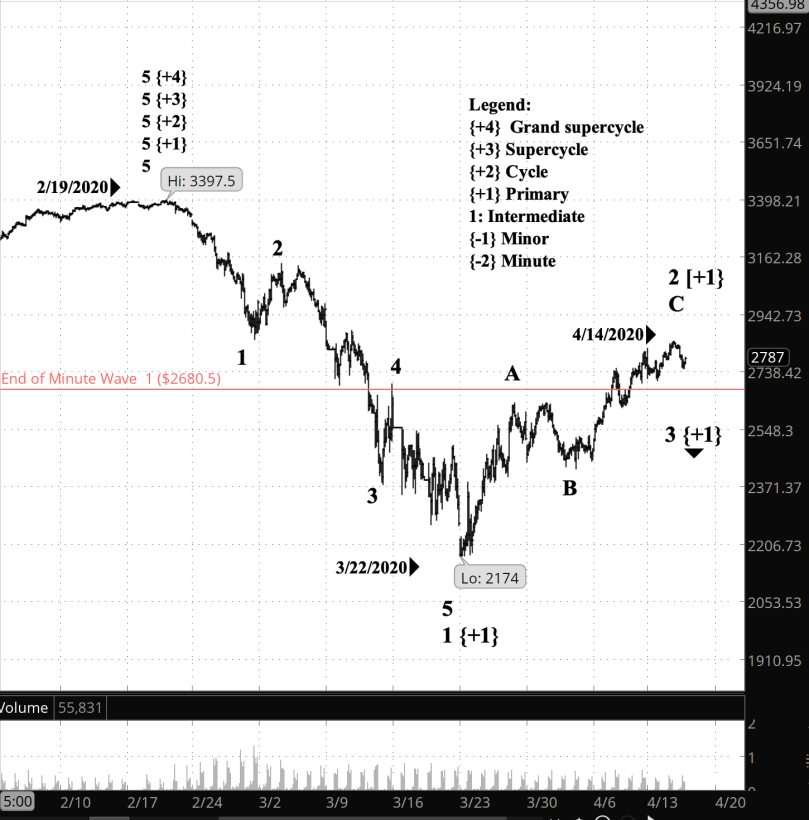
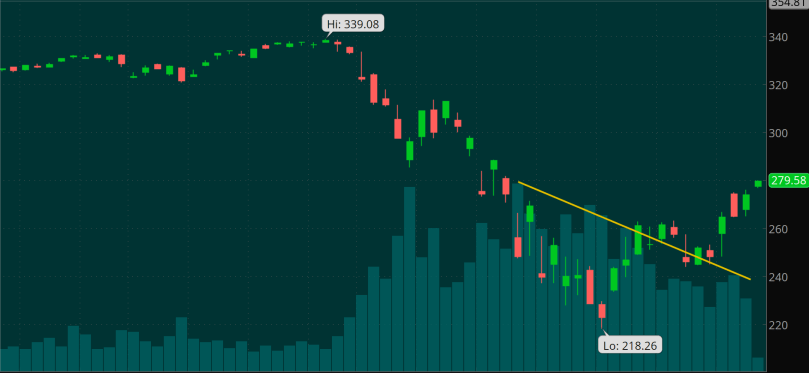
What’s happening now? The S&P 500 is in an upward correction of a larger downtrend. The correction appears to be taking a zigzag pattern — up, down, up more — and to be in the middle part of the pattern.

What does it mean? Corrections are a normal part of any trend, as the number of bids and asks varies over time. This counter-trend upward correction doesn’t change my assessment that the market remains in the downtrend that began February 19.

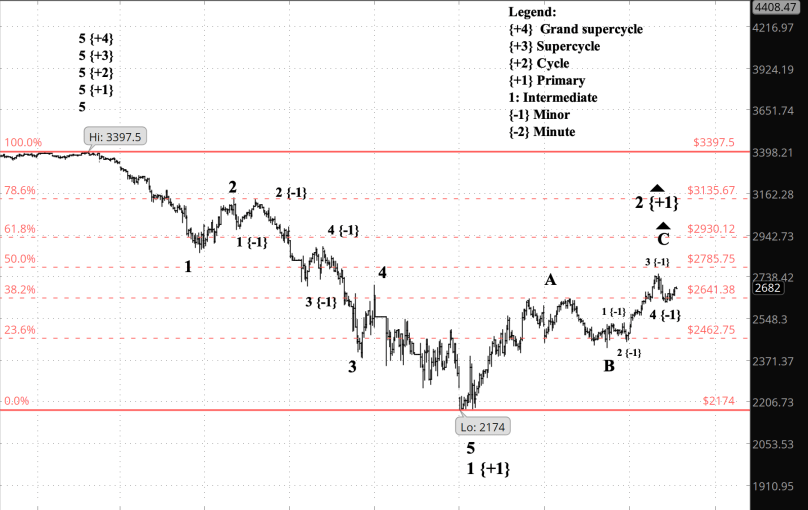
What does Elliott wave theory say? The S&P 500 is in the 3rd wave of Primary degree

Screen Shot 2020-04-16 at 7.01.26 AM

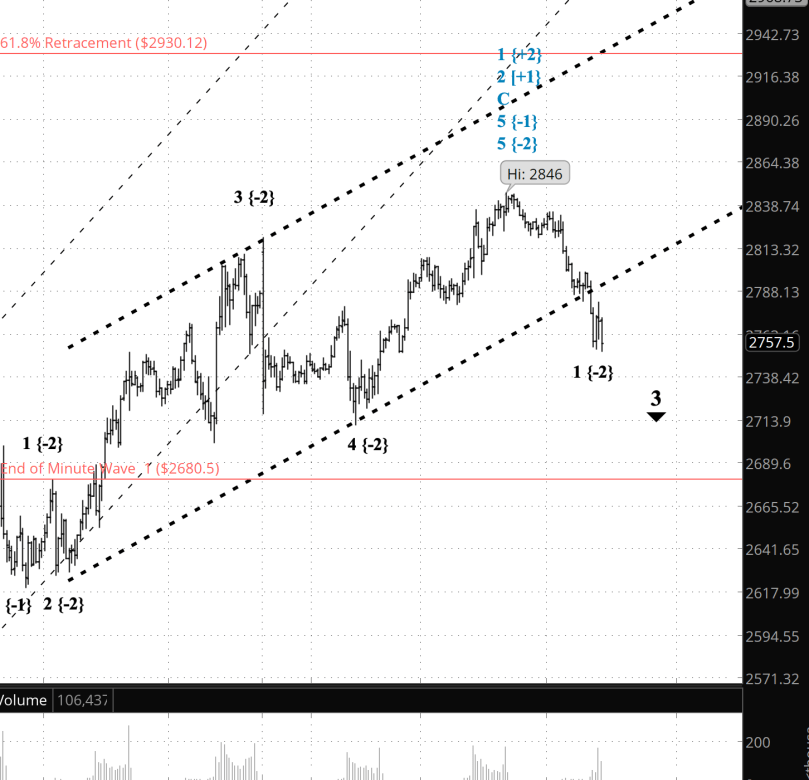
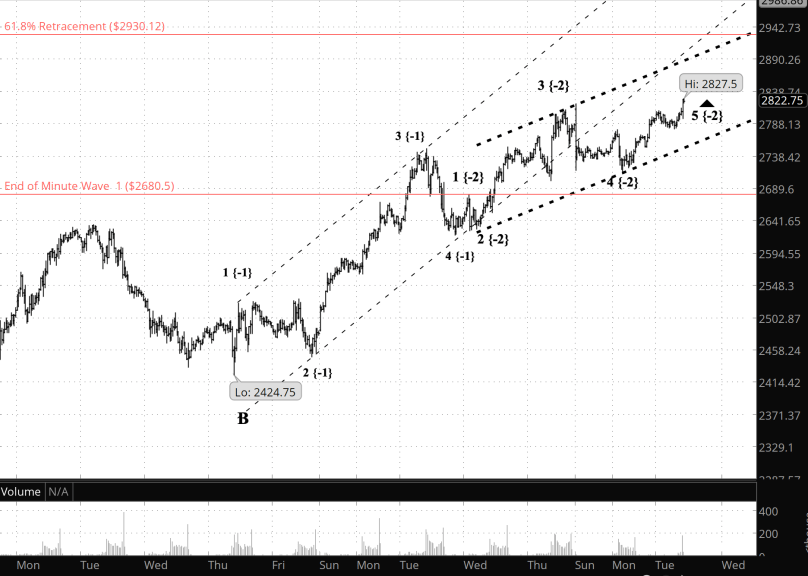
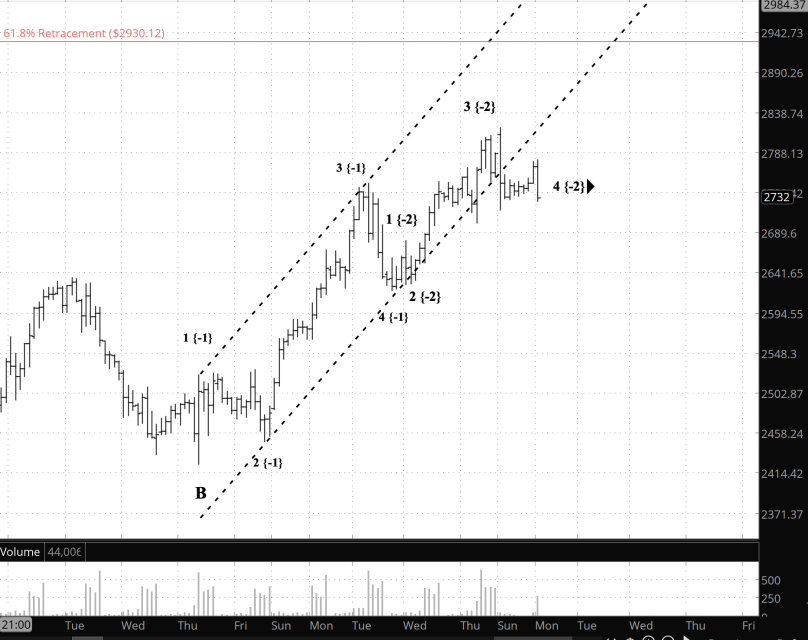
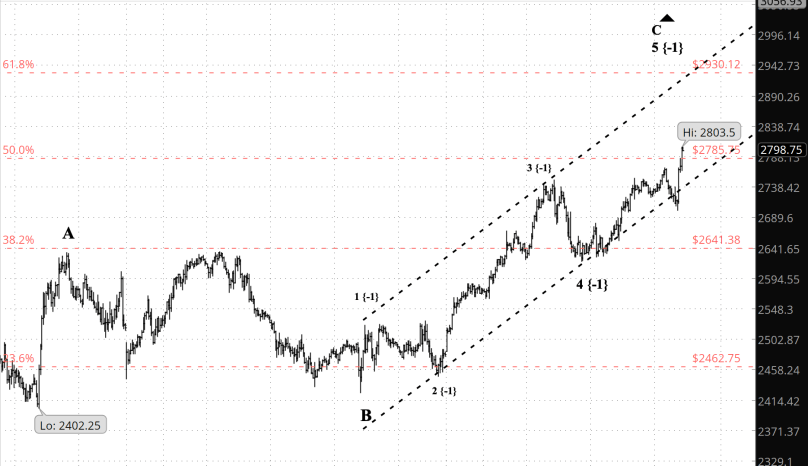
as it comes off the 2nd wave peak of 2846 attained April 14. It ended a 1st wave at 2746 yesterday in after-hours trading, within the Primary 3rd. It was followed by the beginning of a correction, a pattern composed of three waves internally, labeled A through C. Since the larger trend is down, the A wave is an upward movement, B wave down and C wave up, the reversal of what we see in bull markets.

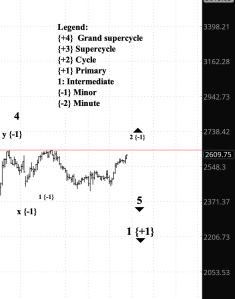
The S&P 500 is presently in the B wave of Minuette degree {B -2} within the 2nd wave of Minor degree (2 {-1}.

What is the alternative? The 2nd wave of Intermediate degree (2 {+1}) may in fact still be underway rather than having ended on April 14. That possibility will be eliminated if the price crosses below 2680.50, the end of the wave 1 internal to the Intermediate 2nd, since it would violate one of the rules of Elliott wave analysis.

What about my trades? As before, I’m continuing to hold my three short bear call options spreads on SPY: Lots 1213 and 14, all expiring May 15. (The lot numbers link to the entry analyses.)

By Tim Bovee, Portland, Oregon, April 16, 2020

Read More »

Live: Wednesday, April 15, 2020

2:55 p.m. New York time

Some stats of Primary waves 1 and 2 within Cycle wave 1, and their Intermediate wave components. And a broad view chart.

  • Primary degree
    • Wave 1, down 1,223.50, or -36.0
      • Intermediate degree
        • Wave 1, down 544.25, or -16.0%
        • Wave 2, up 283.75, or 9.9%
        • Wave 3, down 730.75, or -23.3%
        • Wave 4, up 439.75, or 18.3%
        • Wave 5, down 148.75, or -5.5%
    • Wave 2, up 672.00, or 30.9%
      • Intermediate degree
        • Wave A, up 672.00, or 30.9%
        • Wave B, down 209.75, or -8.0%
        • Wave C, up 421.25, or 17.4%

The red line shows the end of wave 1 of the Minute degree. When the price moves below that level, it will confirm that we are indeed in Primary wave 3.

Screen Shot 2020-04-15 at 11.46.45 AM

10:30 a.m. New York time

What’s happening now? The S&P 500 fell below its lower channel line in a five-wave move that appears to be ending with a triangle pattern.

What does it mean? It appears that a significant decline has resumed after an upward correction that lasted a bit more than a month.

What does Elliott wave theory say? By my count, primary wave 2 to the upside ended yesterday at 2846. The decline that followed breaks into five waves, the final one being a 5th wave triangle. I place that initial decline as being at the Minor degree, although that labelling could change as I gain greater knowledge of the unfolding structure.

The 1st wave decline is fairly tentative, as 1st waves often are. There has been no significant increase in volume nor a price gap.

Screen Shot 2020-04-15 at 7.24.11 AM

The initial decline will be followed by a retreat upward, the 2nd wave of Minor degree, and after the 2nd will come a 3rd wave most likely longer than the 1st wave, all part of the initial building blocks of the larger degree declines.

What is the alternative? Wave 4 of Primary degree might still be unfolding. A decline beyond the end of wave 1, at 2680.50, would invalidate this alternative. As of this moment the index futures are trading at 2759.00.

What about my trades? Unchanged. I’m continuing to hold my three short bear call options spreads on SPY: Lots 1213 and 14, all expiring May 15. (The lot numbers link to the entry analyses.)

By Tim Bovee, Portland, Oregon, April 15, 2020

Read More »

Live: Tuesday, April 14, 2020

10:15 a.m. New York time

What’s happening now? The S&P 500 has resumed its rise after several days within a sideways range. It has exceeded its high of April 12 and as I write has set a high so far today of 2823.

What does it mean? The resumption of the rise is the final movement of the upward correction that began March 22. Once it is complete, then the S&P 500 will decline below 2174.

What does Elliott wave theory say? The rise signals the beginning of the 5th wave of Minuette degree within the Minor 5th wave within the Intermediate C wave. When the Minuette 5th is complete, that will also end the Minor 5th and the Intermediate C. With the completion of the 3rd wave have redone the channel, and the result suggests an upward target of 2900. However, the Minuette 5th wave has met all of the requirements in Elliott wave theory and so could reverse to the downside at any time.

Screen Shot 2020-04-14 at 7.09.01 AM

What is the alternative? The reversal to the upside could be a continuation of wave 4 of Minuette degree as it traces a complex correction, such as a double zigzag, although there are other alternative correction patterns. A reversal to the downside with a gap would give this interpretation less credence.

What about my trades? I’m continuing to hold my three short bear call options spreads on SPY: Lots 12, 13 and 14, all expiring May 15. (The lot numbers link to the entry analyses.)

By Tim Bovee, Portland, Oregon, April 14, 2020

Read More »

Live: Monday, April 13, 2020

10:30 a.m. New York time

What’s happening now? The S&P 500 in trading before the opening bell last night dropped by a bit more than 100 points within a 5-minute span, and since then has been meandering sideways.

What does it mean? The upward correction has not yet run its course. My target for its highest mark remains in the 2900s, with 2930 more or less being the most likely end point. But that’s an informed guess, not an analytical necessity.

What does Elliott wave theory say? When the S&P 500 price spiked overnight I was ready to mark that peak as the end of the Minute 5th wave within the Minor 5th within the Intermediate C wave within the Primary 2nd wave. The end of the Minute 5th would mean the end of the Minor, Intermediate and Primary waves as well, launching the Primary 3rds wave.

Screen Shot 2020-04-13 at 7.24.17 AM

But, after falling the price began meandering sideways, a typical pattern for a 4th wave. And the early spike was higher than where I had previously placed the Minute 3rd wave top. So I moved the top of the 3rd on my chart to the new high, and numbered the decline and meandering as a Minute 4th wave, setting up for the 5th wave up to the 2900s.

What is the alternative? There is ambiguity on this chart. If the price moves beyond the end of wave 1, at 2680.50, then I would mark last night’s high as the end of the minor 5th and the decline and meandering as the beginning of the Primary 3rd wave down. The rule in Elliott wave analysis is that a 4th wave cannot move beyond the end of the 1st wave of the same degree. If it rises from its sideways meanderings, then I would accept my count as correct.

What about my trades? I shall continue to hold on to my short bear call options spreads, waiting for the fall.

By Tim Bovee, Portland, Oregon, April 13, 2020

Read More »

Live: Thursday, April 9, 2020

10:10 a.m. New York time

What’s happening now? The S&P 500 continues to rise in an upward correction within the larger downtrend. The price shortly after the opening bell moved above the 50% retracement, a Fibonacci level.

What does it mean? Completion of the correction will signal a powerful resumption of the downtrend. In retrospect, the present movement to the upside will be seen as a sucker play that drew people back into the market too early. One tip-off to the weakness of the rise is the volume of SPY, the exchange-traded fund that tracks the S&P 500. Volume has been declining through the price rise that began March 23. (Each bar represents one day in the chart below. The yellow line shows the volume trend.)

Screen Shot 2020-04-09 at 6.53.15 AM

What does Elliott wave theory say? The S&P 500 remains in a Minor 5th wave to the upside within an Intermediate C wave to the upside, part of a Primary 2nd wave correction to the upside within a downtrending Cycle 1st wave. The channel suggests that the 5th wave could reach above 2900, although there is no guarantee. (Each bar in the chart is 30 minutes.)

Screen Shot 2020-04-09 at 7.00.24 AM

The end of the Minor 5th within Intermediate C will mark the end of the Primary 2nd wave and the beginning of the Primary 3rd wave down, which will carry the price below 2174, and most likely quite a distance below, although there’s no way to set a target yet.

What is the alternative? A 2nd wave can never move beyond the start of wave 1. In this case, Primary wave 1 on February 19 began the crash, from 3397.50. If the price were to move above that level, then the chart would demand a re-analysis of everything that has happened in the market since mid-February. I don’t expect this to happen, but it could.

What about my trades? I shall continue to hold my short bear call options spreads on SPY. The short call strike prices are $261 and $263.

By Tim Bovee, Portland, Oregon, April 9, 2020

Read More »

Live: Wednesday, April 8, 2020

3:54 p.m. New York time

And, six minutes before the closing bell, the S&P 500 futures move above 2744, confirming that Intermediate wave C of Primary wave 2 is still in effect. There’s more upside to to come before the Primary wave 3 decline begins.

11:25 a.m. New York Time

What’s happening now? The S&P 500 futures declined by 129.25, or 4.7%, from yesterday’s peak and then bounced slightly. The peak fell short of a 50% retracement, and the pullback brought the price to a Fibonacci 31.8% retracement.

What does it mean? The market is either pausing before resuming its upward correction, or has completed its rise and is resuming its downward course.

What does Elliott wave theory say? The peak came in an Intermediate C wave, a subwave of a Primary 2nd wave. The question is how many subwaves does the C wave have?

Screen Shot 2020-04-08 at 8.06.56 AM

As is often the case in Elliott, the internals of wave C can be interpreted several different ways. my best count is four waves, as shown in the chart above, which shows S&P 500 futures back to the beginning of the crash with two-hour bars.

How high will it go? If my interpretation is correct, then prices will resume the rise in wave 5 {-1} within C within wave 2 {+1}. A target level often seen in 2nd waves is the 61.8% Fibonaccci level, which would be 2930.12. That would be a 6.6% rise, or 180.12 points, from the beginning of wave 5 {-1} at 2750. Under the rules of Elliott wave theory, the price cannot move above the start of the 1st wave, 3397.50.

What’s the alternative? If my count within wave C is incorrect and the wave has reached its peak, then the present decline is the start of wave 1 within wave 3 {+1} to the downside. Third waves are powerful beasts, and this one will carry below the start of the 2nd wave correction, 2174, and perhaps a long distance below.

How will we know which is right? If the S&P 500 futures price moves above 2750, the peak of wave 3 {-1}, then wave 2 is still underway to the upside. If the price drops below 2449, the start of wave 3 {-1}, then wave 3 of the Intermediate degree is underway and the price will decline rapidly thereafter.

What about my trades? My short bear call options spreads, with strike prices at 261 and 263, make money when the market goes down. I shall continue to hold in the expectation that wave 3 to the downside will begin before the options expire on May 15.

By Tim Bovee, Portland, Oregon, April 8, 2020

Read More »

Live: Tuesday, April 7, 2020

12:10 a.m. New York time

I mentioned early in my switch to a bear market strategy, in a run-through of how Elliott wave analysis works, that the method is often ambiguous. And that’s where we are today.

We’ve been in a major downtrend from 3397.50 on the S&P 500 futures since February 19, and we hit a low, 2744, in the downtrend on March 22. Of those two facts I have no doubts. At that point, it gets difficult.

We’re clearly in an upward correction. The main question is, what is being corrected?

  1. In the first scenario, the low at 2744 represents the end of wave 1 of the Primary degree and the correction is the 2nd Primary wave . If that’s the case, then we are presently in the 3rd wave of Intermediate degree within the A wave of the correction. The price is approaching a 50% retracement (2785.75). Generally a 2nd wave can be expected to end near the 61.8% Fibonacci point, which would be 2930.12. It’s a tendency, not a requirement. If the correction form is a zig-zag — common in 2nd waves — the A wave is followed by a B wave to the downside, and then a powerful C wave to a higher level that marks the end of the correction.
  2. The second scenario, which was my count until very recently, is that the low at 2744 represents the end of wave 3 of the Intermediate degree, and that the 1st Primary wave is still in force. The third wave would then have begun on March 13 at 2697.25. This scenario was proven false on Monday when the price moved above the end of wave 1 of the same degree, which is not allowed in Elliott wave analysis.

So the 1st scenario is correct, and as I count Primary wave 2 to the upside, we are now in the final section of its progress, Minor wave C.

It is possible that wave A is still in progress, and what I’m counting as waves B and the start of C are subwaves of A. If that proves to be true, then we’re not as far along in the process as I thought. By that count, we’re already 28 days into A, so it seems to me that the C-wave hypothesis is more likely to be correct.

What about my short bear call spread options positions, which are now at more than 80% of maximum potential loss? Well, the positions have 38 days to go before they expire. At this point, I hang on to them. They are entirely in the money — which is loss-making — but a lot an happen in 38 days.

If that’s the case, then the question is how long will that C wave take to complete its work. Within the entire decline from February 19, the longest minor wave was the 4th wave correction to the upside, which took 26 days to run, and the second longest was the 5th wave, which took 23 days. The shortest was the 2nd wave correction, which took only four days.

So I judge that I have time. The worst case scenario is that  the options get assigned and I have stock placed in my account. That hassle doesn’t outweigh the losses I would take if I exited now.

That’s where things stand: Keep cool, keep an eye on the chart, and watch the market work its will without taking action until Intermediate wave 3 has brought the price down.

By Tim Bovee, Portland, Oregon, April 7, 2020

Read More »

Live: Monday, April 6, 2020

3:50 p.m. New York time

A short time ago the S&P 500 broke above its March 26 high, which means my count must be revised. So it may be that the 5th wave down has not yet begun and instead the 4th wave, a combination of corrective patterns, is continuing to run its course. Or, conceivably, the 5th wave down is complete, and we are witnessing the beginning of the larger Primary degree’s 2nd degree to the upside. More tomorrow.

12:20 p.m. New York time

The S&P 500 continued its rise today. I shall hold on to my short bear call spread options positions, which expire May 15, in the expectation of a decline that will carry the index down by at least 200 points.

Based on Elliott wave analysis, I count the rise today as a 2nd wave upward correction at the Minor degree of a 5th wave downtrend of the Intermediate degree that began on March 26, at 2634.50 on the S&P 500 index futures. As of this moment the price is 2606.00, and a move above 2634.50 would invalidate my 5th wave count. Instead, I would count this rise as part of an Intermediate 4th wave to the upside, a composite structure that began March 22.

Screen Shot 2020-04-06 at 9.10.53 AM

All of this is happening within a larger 1st wave to the downside of Primary degree that began on February 19, and perhaps of higher degree waves as well. The markets’ wave structures are fractal, so that a wave of smaller degree can be correcting to the upside while its parent and grandparent degrees are moving in a downtrend.

Bottom line: The markets are a complex beast. Therein lies the fascination.

An interesting week ahead: The Federal Open Market Committee release minutes on Wednesday, a detailed glimpse at what went into their stimulus decisions in relation to the crash, and the Consumer Price Index on Friday, a look at one aspect of the impact on the economy of our coronavirus mitigations efforts.

By Tim Bovee, Portland, Oregon, April 6, 2020

Read More »

Live: Friday, April 3, 2020

2:15 p.m. New York time

My go-to recession indicator is the Sahm Rule, which was developed a year ago by a Federal Reserve economist, Claudia Sahm. It is tracked by the Federal Reserve’s charting system, FRED. I’ve set the chart to show how the Rule responded to the last three recessions, in 1991, 2002 and the big one, the Great Recession of 2008 to 2010.

Screen Shot 2020-04-03 at 11.25.43 AM

(Click here for a fully interactive chart.)

The goal of Sahm’s rule is to give the government early warning that it would need to start pumping money into the economy. It is a leading indicator compared to the official declaration of a recession, which normally comes a year after the downturn began.

Under Sahm’s rule, a reading 0.5 means the recession is underway. The reading for March was 0.3, and data gathering for the Rule’s underlying report, the Employment Situation, began before the coronavirus layoffs had become widespread.

As the chart shows, the reading we had for March is unusually high and corresponds to just before the Great Recession kicked in.

So Sahm’s Rule says, No recession yet, but we’re heading that way. And I say, We’re in a recession already, and next month’s indicator will clearly show that.

1:55 p.m. New York time

We’re nearing the end of the fourth hour of decline in the S&P 500 today, and my inclination, using Elliott wave analysis, is to interpret it as a continuation of the 5th wave down  in the Intermediate degree decline that began this morning. A move below 2174.00 would confirm that interpretation. Under the Elliott wave model, it need not move below that level to count as a valid 5th wave.

My short bear call options spread position from 51% down to 45% of their maximum potential loss. They are well out of the money — where the profit is — with 42 days to go before expiration, on May 15. So this represents a return to more normal trading, for the moment at least, compared to the rapid panic selling of later February and early March, when I was rolling positions forward within a week, sometimes after only a day.

Management day, when I exit all profitable positions, is April 24, which is 21 days before expiration.

By Tim Bovee, Portland, Oregon, April 3, 2020

Read More »

Live: Thursday, April 2, 2020

10:25 a.m. New York time

The S&P 500 futures continue to stair-step their way down, and I shall continue to hold my short bear call options spreads on SPY, which expire May 15.

Elliott wave analysis: With Intermediate wave 5 to the downside, Minor wave 1 ended yesterday (April 1) at 2434.25, a wave 2 correction to the upside ended this morning, in pre-market trading, at 2502.00, and the price has subsequently dropped in a Minor 3rd wave to below the end of the Minor 1st.

My strategy is to hold through Minor wave 3 and exit in Minor wave 5, if the timing of things permits it. Otherwise, I shall exit in Minor wave 3.

The first strategy, a Minor 5th exit, is also what I’ll use for my shares of SDS, an inverse exchange traded fund that moves the opposite of the SPY and at double the size of its movements.

By Tim Bovee, Portland, Oregon, April 2, 2020

Read More »