11:20 a.m. New York time
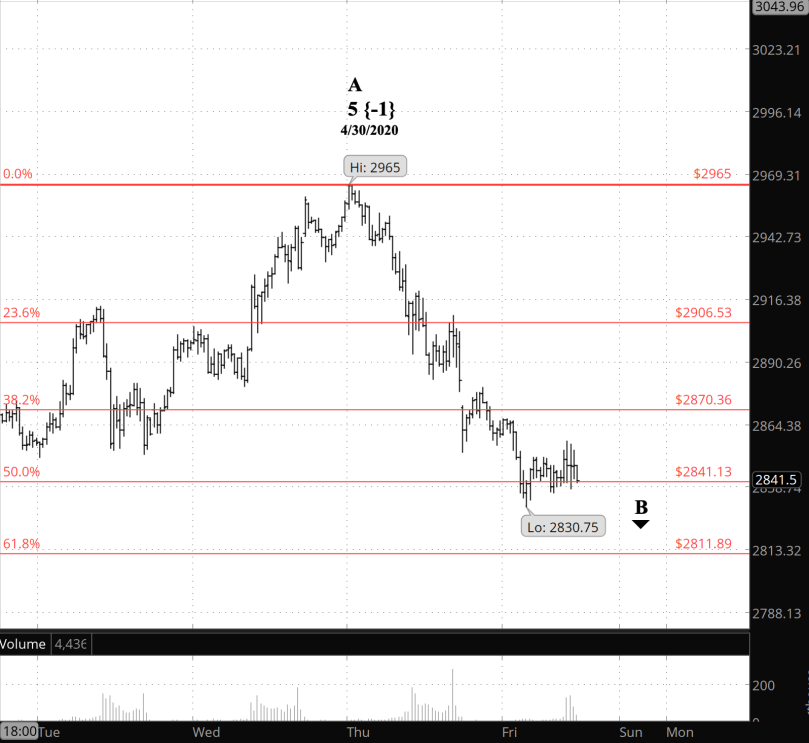
What’s happening now? The S&P 500 price decline that began April 30 so far has reached -4.5%, attaining its low point of 2830.75 in the early morning hours before the opening bell. It has since moved sideways in a very small intraday movement.
What does it mean? The decline is a correction to the downside within a correction to the upside. I expect the decline, when it reverses upward, to return to the 2965 level or beyond.
What does Elliott wave theory say?
The decline has retraced 50% of wave A, within the 38% to 79% retracement range that is common among B waves within Zigzag corrections. The decline could end where it without violating any rules, swinging up again into a C wave that will complete Primary wave 2. A 79% retracement would bring the price down to around 2770. If it goes further, then we’re more likely looking at a Flat, which tends to retrace at least 90% of the A wave.
The B wave down so far, to my eye, has more than three waves, which violates a rule of Elliott wave analysis. I’ll wait for some clarity before reaching a decision about what’s next.
What is the alternative? I have no alternative at this point.
What about my trades? With my three short bear call options spread positions on SPY, Lots 12, 13 and 14, all expiring May 15, I’ve reached the point where the Elliott wave analysis is fairly irrelevant. The positions presently have a range of 6% to 11% above maximum potential loss, so I hold them, since at expiration my loss will be less than I would have if I exited now. If the price dips down to the 2600s before expiration, I could get out with a small profit. So, in terms of trading, it’s very binary: Either the S&P 500 drops enough to allow me a profit, or it doesn’t, and I have a loss. A very simple analysis.
Learning and other resources. Elliott Wave International has long been the leading analytical house based on Elliott wave theory. They make available a number of free educational materials and other resources, in addition to their for-pay subscriptions.
Terminology. Here are some links to information about some of the technical jargon I use.
Charts. On my charts, waves have a subscript showing the degree above or below the Intermediate degree. Here are the subscripts and the degree each represents:
- {+3} Supercycle
- {+2} Cycle
- {+1} Primary
- No subscript: Intermediate
- {-1} Minor
- {-2} Minute
- {-3} Minuette
By Tim Bovee, Portland, Oregon, May 1, 2020
Disclaimer
Tim Bovee, Private Trader tracks the analysis and trades of a private trader for his own accounts. Nothing in this blog constitutes a recommendation to buy or sell stocks, options or any other financial instrument. The only purpose of this blog is to provide education and entertainment.
No trader is ever 100 percent successful in his or her trades. Trading in the stock and option markets is risky and uncertain. Each trader must make trading decisions for his or her own account, and take responsibility for the consequences.
License

All content on Tim Bovee, Private Trader by Timothy K. Bovee is licensed under a Creative Commons Attribution-ShareAlike 4.0 International License.
Based on a work at www.timbovee.com.

You must be logged in to post a comment.