9:55 a.m. New York time
What’s happening now? The S&P 500 dropped below 2885.25, signaling that correction that began on March 22 has reached an end and that a major long-term decline has resumed. The first leg down will carry the price to the 1900s at the least, based on the price channel.
What does it mean? The resumption of the decline that began February 19 is in its early stages. Ultimately, the decline will be with us for months, punctuated by the usual downs and ups.
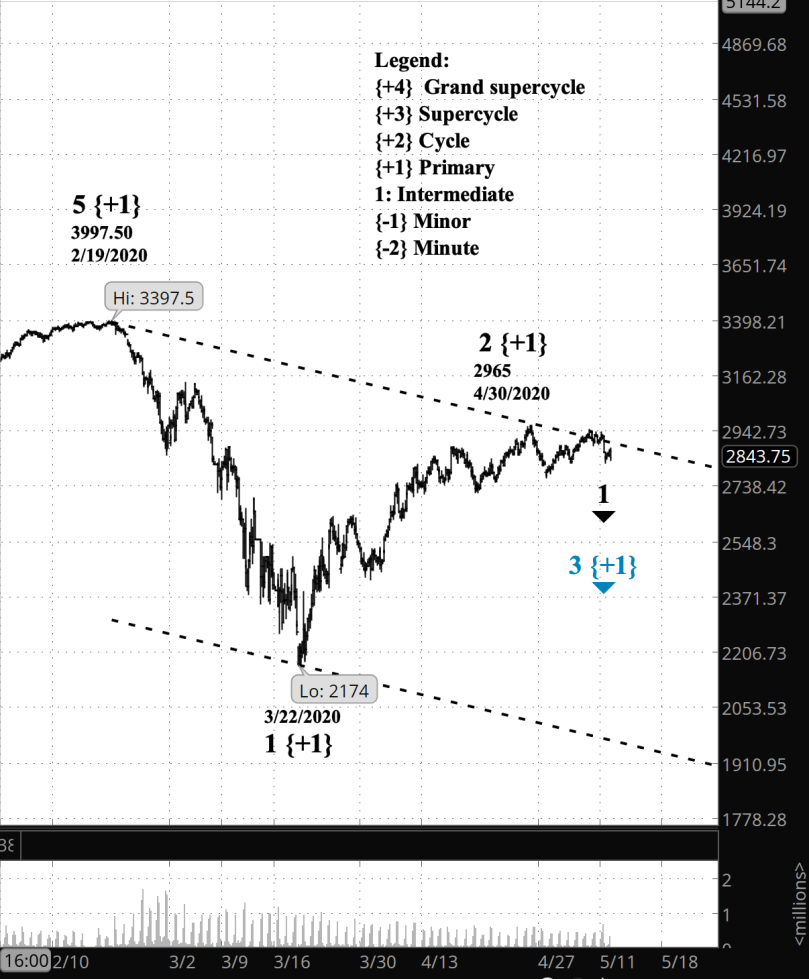
What does Elliott wave theory say? The S&P 500 is in Minor wave 3 of Intermediate wave 3 of Primary wave 1, all downtrending.
By my count the 2885.25 level was the end of Minor wave 1 in the present Intermediate wave of the correction. When that level was pierced on May 12, that signaled that wave 2 of Primary degree — an upward correction within wave 1 of Cycle degree — had ended on April 30 at 2965, thus confirming the alternative count, which became the preferred count.
Here’s are the waves of Minor degree so far within Intermediate wave 1:
- Wave 1, began 4/30/2020 at 2965, length down 194 points, or -6.5%.
- Wave 2, began 5/3/2020 at 2771, length up 176 points, or 6.4%.
- Wave 3, began 5/6/2020 at 2947, at this moment down 121.75 points, or 4.1%, and certain to go down further
What is the alternative? None in sight at this point. I’m sure ambiguities will develop later and the market with disentangle them in its own time.
What about my trades? The present downtrend has three more days to bring my three short bear call options spread positions on SPY back into profitability. Lots 12, 13 and 14 all expiring on Friday, May 15. A 200 point or so drop in the S&P 500 would bring those positions back into profitability.
Learning and other resources. Elliott Wave International has long been the leading analytical house based on Elliott wave theory. They make available a number of free educational materials and other resources, in addition to their for-pay subscriptions.
Terminology. Here are some links to information about some of the technical jargon I use.
Charts. On my charts, waves have a subscript showing the degree above or below the Intermediate degree. Here are the subscripts and the degree each represents:
- {+3} Supercycle
- {+2} Cycle
- {+1} Primary
- No subscript: Intermediate
- {-1} Minor
- {-2} Minute
- {-3} Minuette
By Tim Bovee, Portland, Oregon, May 13, 2020
Disclaimer
Tim Bovee, Private Trader tracks the analysis and trades of a private trader for his own accounts. Nothing in this blog constitutes a recommendation to buy or sell stocks, options or any other financial instrument. The only purpose of this blog is to provide education and entertainment.
No trader is ever 100 percent successful in his or her trades. Trading in the stock and option markets is risky and uncertain. Each trader must make trading decisions for his or her own account, and take responsibility for the consequences.
License

All content on Tim Bovee, Private Trader by Timothy K. Bovee is licensed under a Creative Commons Attribution-ShareAlike 4.0 International License.
Based on a work at www.timbovee.com.

You must be logged in to post a comment.