2 p.m. New York time
I’ve repositioned some of the funds freed by the exit of my options positions into share positions in SDS, an exchange-traded fund that does the opposite of the S&P 500, and then multiplies each movement by two. The prices were $23.66, $23.67 and $23.69 for the three lots.
11:55 a.m. New York time
I’ve exited my short bear call spread options positions on SPY, for significant losses. The Subminuette B wave turned up without moving below the end of Subminuette A, greatly reducing the likelihood that the price would collapse into my zone of profit on the options. C waves, like that I count as beginning from 2809.50, have a lot of energy, and that would have raised the cost of exiting prior to expiration after the bell. The alternative would have been to allow the positions to expire, which would have put shares of stock in my account, and any significant moves over the weekend would have had a potentially devastating impact on my holdings. The odds of a significant move are totally unknown, so in common with the saying, “Risk as good, as long you know the odds”, I avoided the risk in favor of a slightly more expensive cost of existing. I hate not knowing the odds, so I consider to be a good decision.
Record-keeping: I shall up the analyses for the three lots of options — lots 12, 13 and 14 — over the weekend, along with an analysis of lessons learned from the loss. My long shares of the inverse S&P 500 fund SDS, which are of course have no expiration, remain in my accounts, and I shall hold them until Primary wave 3 nears its end, exit for the 4th wave correction, and then assess my next move once Primary wave 5 begins.
10:55 a.m. New York time
What’s happening now? The May monthly options expire after the closing bell. For bear traders who opened positions in late March, the normal schedule, before the upward movement, the timing is terrible. On the chart, the low-level upward correction of the S&P 500 that began May 1 continues, or perhaps is complete, having peaked at 2350 in the wee hours of the morning before the opening bell. It’s impossible to say which happening at this point.
What does it mean? The rise is a normal low-level correction that I would ignore, were it not for the fact that the May monthly options expire after the closing bell today.
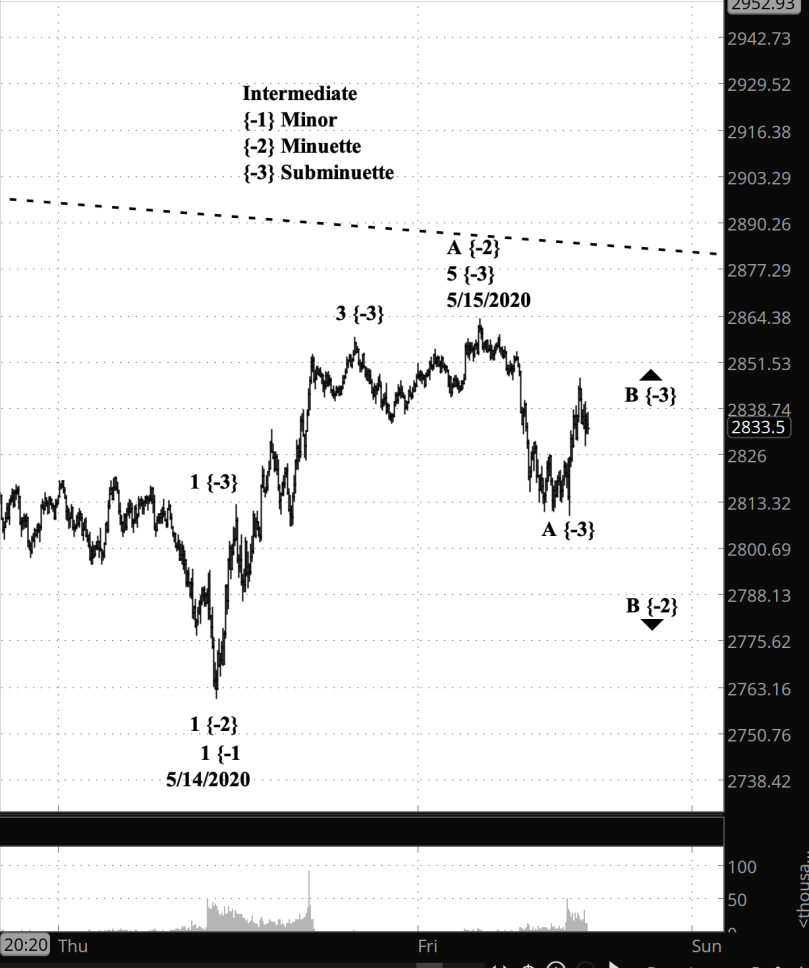
What does Elliott wave theory say? At the macro level, the index is in wave 3 of Minor degree within Intermediate wave 1 within Primary wave 3, all to the downside.
At the micro level, within Minor 3, the index is in an upward correction at the Minuette degree. At the Subminuette degree, it has completed wave A to the upside in a probable Zigzag pattern and is now in Subminuette B. The B wave will have three legs at the Micro degree as it works its way down and is presently beginning the middle (B) leg. If what I’m counting as Subminuette wave B drops below the start of the wave A, at 2809.50, then it is in fact not wave B to the upside but wave C to the downside.
What is the alternative? The upward 2nd wave correction at the Primary degree could still be underway. We have yet to see a decisive commitment on the chart to the downside so the possibly remains, although I don’t consider it to be a likelihood.
My Trades, a day of reckoning: All of my short bear call spread options positions on SPY, lots 12, 13 and 14, expire with losses after the closing bell today, and I’ve got to decide what to do with them: 1) Exit the positions for a premium over my maximum loss exit, thereby getting out of further harm’s way, or 2) let them expire for maximum loss, at the cost of some work on Monday getting out of share positions, and perhaps incurring loss if there’s a big move over the weekend. My options positions need to see a price in the 2600s in order to produce a last-minute save. Not happening.
Learning and other resources. Elliott Wave International has long been the leading analytical house based on Elliott wave theory. They make available a number of free educational materials and other resources, in addition to their for-pay subscriptions.
I recommend two books, both by people associated with EWI.
First, Elliott Wave Principle by Robert Prechter and A.J. Frost is the book that, along with Prechter’s analyses, that created the revival of Elliott wave theory. I first read it in 1984, and it has had a profound influenced on my thinking about markets ever since.
Second, I’ve found Visual Guide to Elliott Wave Trading by Wayne Gorman and Jeffrey Kennedy, both of EWI, to be a useful book that relates Elliott wave theory to practical trading. The authors are hands-on Elliotticians, and for an active trader, that’s exactly what’s needed — less theory and more how-to. The first chapter of the book gives a very nice thumbnail run down of what Elliott wave theory is all about.
Terminology. Here are some links to information about some of the technical jargon I use.
Charts. On my charts, waves have a subscript showing the degree above or below the Intermediate degree. Here are the subscripts and the degree each represents:
- {+3} Supercycle
- {+2} Cycle
- {+1} Primary
- No subscript: Intermediate
- {-1} Minor
- {-2} Minute
- {-3} Minuette
By Tim Bovee, Portland, Oregon, May 15, 2020
Disclaimer
Tim Bovee, Private Trader tracks the analysis and trades of a private trader for his own accounts. Nothing in this blog constitutes a recommendation to buy or sell stocks, options or any other financial instrument. The only purpose of this blog is to provide education and entertainment.
No trader is ever 100 percent successful in his or her trades. Trading in the stock and option markets is risky and uncertain. Each trader must make trading decisions for his or her own account, and take responsibility for the consequences.
License

All content on Tim Bovee, Private Trader by Timothy K. Bovee is licensed under a Creative Commons Attribution-ShareAlike 4.0 International License.
Based on a work at www.timbovee.com.

You must be logged in to post a comment.