1:20 p.m. New York time
Looking forward. My next options vehicle will be the monthlies expiring July 17. The entry date, 45 days prior to expiration, is June 2. In line with my decision to space entries within a two-week period centered on that date, I’ll be looking to open new positions between May 26 and June 9. The JUL20 series has a management date, 21 days prior to expiration, on June 26. That’s the day that I exit all profitable positions.
Buying in will require a clear decline into the early stages of the S&P 500 into Intermediate wave 1. At present, there is no clarity. I shall wait until Tuesday before doing an analysis, but suffice it to say that today’s price rise, peaking at 2952.75 so far, strongly suggests at Minor wave 4 within Intermediate 1 is still underway, which was my alternative reading of the chart.
9:40 a.m. New York time
Two Futures. Before looking at today’s chart, I’d like to take a step back to put our present decline in context.
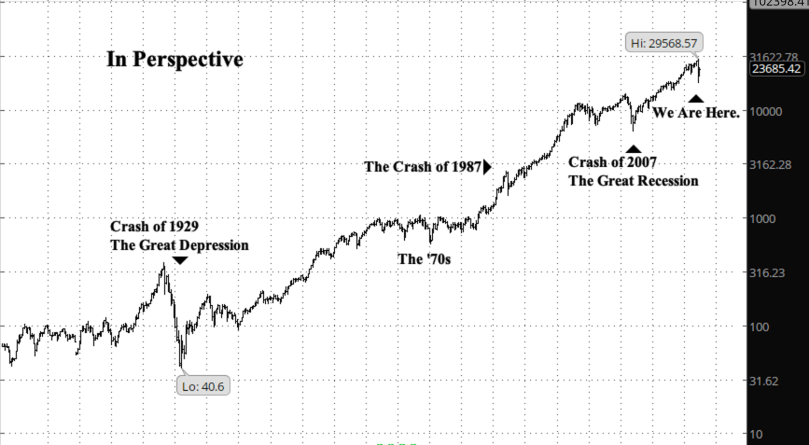
The furthest back I can go with my charting of the market blue chips is the Dow Jones Industrial average back 118 years, to 1902. The chart uses quarterly bars.
Two takeaways:
- No other market crash comes close to equalling the Crash of ’29, which announced the start of the Great Depression and hit bottom in 1932. Remember the crash of 1987? When the Dow went down 25% one day? Chickenfeed. Even our present Coronavirus Crash is fairly insignificant in comparison.
- On the chart, we’ve been in a bull market since 1932. The market fluctuates, but the trend has been up. In terms of Elliott wave theory, I can count five waves up: wave 1 from 1932 to 1937; wave 2, 1937 to 1942; wave 3, 1942 to 1966; wave 4, 1966 to 1974; and an extended wave 5 from 1974 to the present.
So two futures: If the Coronavirus Crash signals the end of wave 5, then our present decline will correct the rise from 1932. That’s a very large decline. Or, if our present crash turns out to be a lower level correction within an ongoing wave 5, then the bull market will return, tentatively at first, and then with a great deal of energy.
It will be quite some time before anyone can say with confidence which of those two futures we’ll experience.
What’s happening now? A short term correction continues on the S&P 500 chart, for a second breaking above the channel of the decline that began February 19.
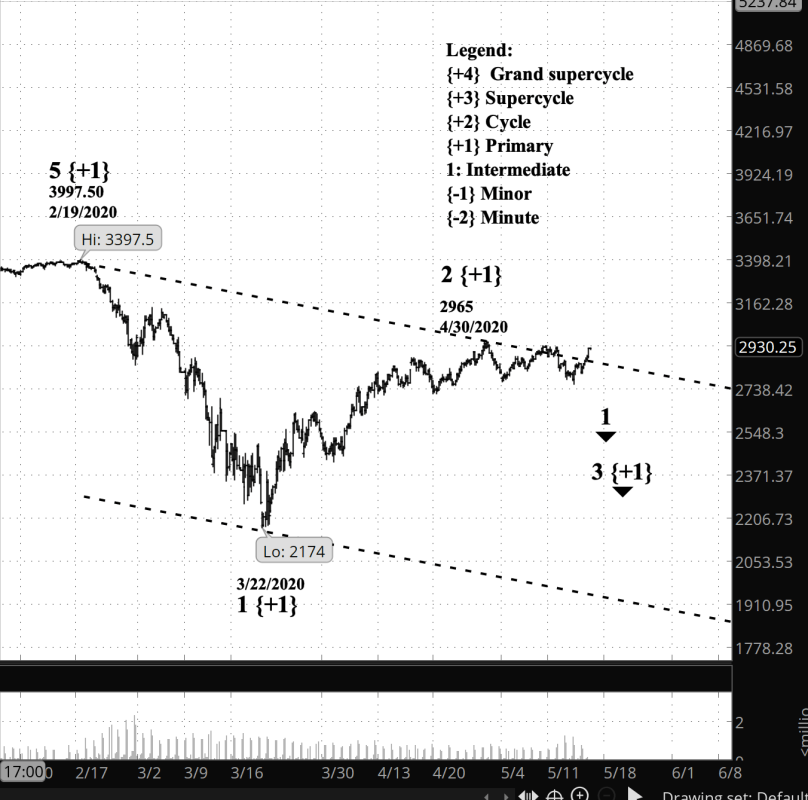
What does it mean? Bear markets have their downs and ups, and we are presently in one of the ups. My trading tends to rely on movements of larger scale. The present upward correction will be followed by a powerful downtrend.
What does Elliott wave theory say? I count the index as being in Minor wave 4 correction to the upside, within a declining Intermediate wave 1 within Primary wave 3, also declining.
What is the alternative? Wave 2 of the Primary degree could still be ongoing.
What about my trades? I am entirely in stocks at this point — SDS, an inverse 2x fund based on the S&P 500. I’ll work out my next options schedule later today.
Learning and other resources. Elliott Wave International has long been the leading analytical house based on Elliott wave theory. They make available a number of free educational materials and other resources, in addition to their for-pay subscriptions.
I recommend two books, both by people associated with EWI.
First, Elliott Wave Principle by Robert Prechter and A.J. Frost is the book that, along with Prechter’s analyses, that created the revival of Elliott wave theory. I first read it in 1984, and it has had a profound influenced on my thinking about markets ever since.
Second, I’ve found Visual Guide to Elliott Wave Trading by Wayne Gorman and Jeffrey Kennedy, both of EWI, to be a useful book that relates Elliott wave theory to practical trading. The authors are hands-on Elliotticians, and for an active trader, that’s exactly what’s needed — less theory and more how-to. The first chapter of the book gives a very nice thumbnail run down of what Elliott wave theory is all about.
Terminology. Here are some links to information about some of the technical jargon I use.
Charts. On my charts, waves have a subscript showing the degree above or below the Intermediate degree. Here are the subscripts and the degree each represents:
- {+3} Supercycle
- {+2} Cycle
- {+1} Primary
- No subscript: Intermediate
- {-1} Minor
- {-2} Minute
- {-3} Minuette
By Tim Bovee, Portland, Oregon, May 16, 2020
Disclaimer
Tim Bovee, Private Trader tracks the analysis and trades of a private trader for his own accounts. Nothing in this blog constitutes a recommendation to buy or sell stocks, options or any other financial instrument. The only purpose of this blog is to provide education and entertainment.
No trader is ever 100 percent successful in his or her trades. Trading in the stock and option markets is risky and uncertain. Each trader must make trading decisions for his or her own account, and take responsibility for the consequences.
License

All content on Tim Bovee, Private Trader by Timothy K. Bovee is licensed under a Creative Commons Attribution-ShareAlike 4.0 International License.
Based on a work at www.timbovee.com.

You must be logged in to post a comment.