9:45 a.m. New York time
What’s happening now? The S&P 500 E-mini futures remain below the May 28 peak of 3065.50.
What does it mean? The lack of a new high leaves open the possibility that the rise from March 22 is complete.
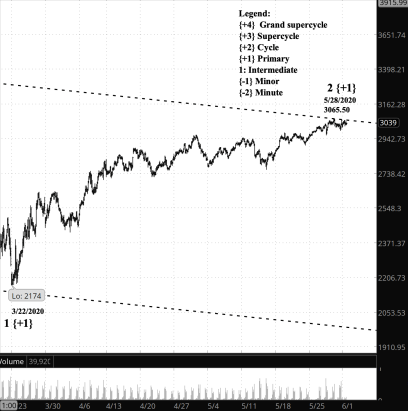
What does Elliott wave theory say? I’ve marked today’s chart showing a channel that assumes that the Primary wave 2 correction to the upside is complete. The price remains very close to the upper boundary of the channel but remans below it. If the correction is indeed over, the price will begin to fall down toward the lower boundary of the channel, which at present stands at 2000, more than 1,000 points below the present price.
What is the alternative? The channel’s upper boundary now stands at 3057, which is 24 points above the present price. So it’s a very short rise to the boundary, and if it is pierced, then it strengthens the case that Primary wave 2 is still in force, and there will be another movement to the upside before it reaches its conclusion.
What about my trades? No options are in my account at present. My shares in SDS profit when the S&P 500 goes down and lose when it rises. Now? Losing.
Learning and other resources. Elliott Wave International has long been the leading analytical house based on Elliott wave theory. They make available a number of free educational materials and other resources, in addition to their for-pay subscriptions.
I recommend two books, both by people associated with EWI.
First, Elliott Wave Principle by Robert Prechter and A.J. Frost is the book that, along with Prechter’s analyses, that created the revival of Elliott wave theory. I first read it in 1984, and it has had a profound influenced on my thinking about markets ever since.
Second, I’ve found Visual Guide to Elliott Wave Trading by Wayne Gorman and Jeffrey Kennedy, both of EWI, to be a useful book that relates Elliott wave theory to practical trading. The authors are hands-on Elliotticians, and for an active trader, that’s exactly what’s needed — less theory and more how-to. The first chapter of the book gives a very nice thumbnail run down of what Elliott wave theory is all about.
Terminology. Here are some links to information about some of the technical jargon I use.
Charts. On my charts, waves have a subscript showing the degree above or below the Intermediate degree. Here are the subscripts and the degree each represents:
- {+3} Supercycle
- {+2} Cycle
- {+1} Primary
- No subscript: Intermediate
- {-1} Minor
- {-2} Minute
- {-3} Minuette
By Tim Bovee, Portland, Oregon, June 1, 2020
Disclaimer
Tim Bovee, Private Trader tracks the analysis and trades of a private trader for his own accounts. Nothing in this blog constitutes a recommendation to buy or sell stocks, options or any other financial instrument. The only purpose of this blog is to provide education and entertainment.
No trader is ever 100 percent successful in his or her trades. Trading in the stock and option markets is risky and uncertain. Each trader must make trading decisions for his or her own account, and take responsibility for the consequences.
License

All content on Tim Bovee, Private Trader by Timothy K. Bovee is licensed under a Creative Commons Attribution-ShareAlike 4.0 International License.
Based on a work at www.timbovee.com.


You must be logged in to post a comment.