10:15 a.m. New York time
What’s happening now? Basically, little has changed since yesterday. The S&P 500 E-mini futures continue to rise in an upward correction.
What does it mean? The rise will be followed by a significant decline.
What does Elliott wave theory say? At the smaller degrees, the index in a rising 4th wave of Minor degree. In ascending order by size, the rise is happening within a 1st wave of Intermediate degree, which in turn is within a 3rd wave of Primary degree.
What is the alternative? I don’t see a clear alternative at this point.
The view from 20 years. Someday our grandchildren, now in college, will ask, “What was it like during the Great Pandemic?” If we’re honest, we’ll reply, “It felt like our world was coming an end, collapsing into chaos.” And we’ll say, “It felt as though any future we could imagine would be worse than what we knew before the Great Pandemic began.”
And our grandkids will say, “Gee, Grandpa. Things aren’t that bad. People don’t get sick anymore. We’re going to beach with our friends next weekend. When we graduate, we’re guaranteed to get a great job. And if we decide we’d rather become poets or artists rather than office ‘bots, we can live off of our national universal dividend and do whatever we like to do. What’s awful about that?”
Wise grandchildren. We went through bad times and we adapted.
One of my current projects, is to write a history of ancestors on the British Isles side of my family, and I just finished writing about some English multi-great-grandparents who went through the Black Death of 1348, a horrible global pandemic that is said to have killed 40% to 60% of the population in England. And the English endured, my multi-greats included, and made things better than they were before the plague. We’ll respond to this adversity the way they did, with more and better resources to speed the recovery.
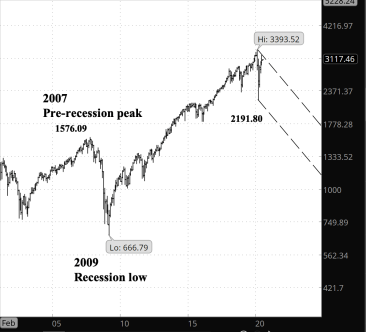
Back in the Great Recession of 2009-2010, it also felt like our world was coming to an end. But it didn’t. Indeed, the 20-year chart of the S&P 500 shows that the index had regained its pre-election peak by 2013, and then continued to rise, more than doubling by February 19, 2020, the day the markets faced the reality of the Great Pandemic and crashed.
The S&P 500 fell by 58% during Great Recession a decade ago. So far during the Great Pandemic Crash of 2020, the index has fallen by 35%.
Does that mean happy days are here again? Not as I analyze it. The Great Recession was a downward correction within a larger rise In Elliott wave terminology, it was a Primary wave 4 correction within Cycle wave 5 to the upside, which in turn was within a rising Supercycle wave 5, the final upwave of Grand Supercycle wave 3.
And where are we today? I place us at Primary wave 3, descending, within Cycle wave 1 to the downside, which in turn is within a declining Supercycle wave 1, the first down wave of Grand Supercycle wave A.
So the downward trend is far more serious than what happened in 2009-2010, arguably at the Grand Supercycle level the largest decline we’ve had for three centuries. And trends of that magnitude are always accompanied by a great deal of chaos and unrest, and historically, by plagues and pandemics. In this instance, we’ve barely scratched the surface. The difficult times will continue for years, as I analyze the chart.
But it’s not in human nature to give up. Evolution and our genes have made us superb problem solvers, and as things collapse around us, we’ll be planning for the renaissance that lies ahead. Of that I have no doubt.
What about my trades? Unchanged from yesterday. I’m waiting for Intermediate wave 3 to kick off.
Learning and other resources. Elliott Wave International has long been the leading analytical house based on Elliott wave theory. They make available a number of free educational materials and other resources, in addition to their for-pay subscriptions.
I recommend two books, both by people associated with EWI.
First, Elliott Wave Principle by Robert Prechter and A.J. Frost is the book that, along with Prechter’s analyses, that created the revival of Elliott wave theory. I first read it in 1984, and it has had a profound influenced on my thinking about markets ever since.
Second, I’ve found Visual Guide to Elliott Wave Trading by Wayne Gorman and Jeffrey Kennedy, both of EWI, to be a useful book that relates Elliott wave theory to practical trading. The authors are hands-on Elliotticians, and for an active trader, that’s exactly what’s needed — less theory and more how-to. The first chapter of the book gives a very nice thumbnail run down of what Elliott wave theory is all about.
Terminology. Here are some links to information about some of the technical jargon I use.
Charts. On my charts, waves have a subscript showing the degree above or below the Intermediate degree. Here are the subscripts and the degree each represents:
- {+3} Supercycle
- {+2} Cycle
- {+1} Primary
- No subscript: Intermediate
- {-1} Minor
- {-2} Minute
- {-3} Minuette
By Tim Bovee, Portland, Oregon, July 1, 2020
Disclaimer
Tim Bovee, Private Trader tracks the analysis and trades of a private trader for his own accounts. Nothing in this blog constitutes a recommendation to buy or sell stocks, options or any other financial instrument. The only purpose of this blog is to provide education and entertainment.
No trader is ever 100 percent successful in his or her trades. Trading in the stock and option markets is risky and uncertain. Each trader must make trading decisions for his or her own account, and take responsibility for the consequences.
License

All content on Tim Bovee, Private Trader by Timothy K. Bovee is licensed under a Creative Commons Attribution-ShareAlike 4.0 International License.
Based on a work at www.timbovee.com.

You must be logged in to post a comment.