10:20 a.m. New York time
What’s happening now? The S&P 500 E-mini futures continued its sideways movement.
What does it mean? The chart’s “You Are Here” marker is ambiguous at this point.
What does Elliott wave theory say? Let’s try to reduce the ambiguity by reducing the problem to a series of alternatives, expressed as If…then statements.
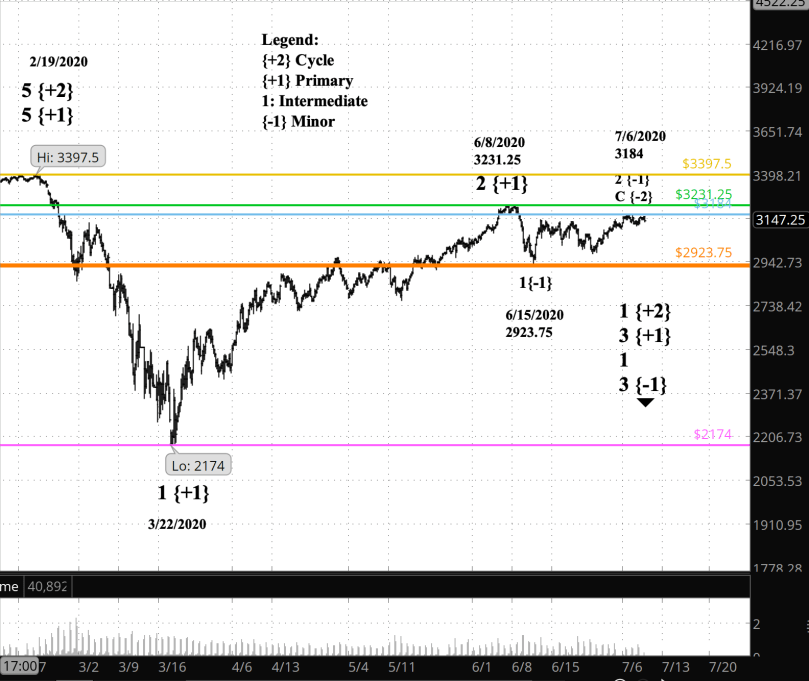
- If the price moves above 3397.50 (tan line), the beginning of Primary wave 1, then the decline from February 19 is complete and the upward trend that began in December 1974 is continuing: Cycle wave 5 within Supercycle wave 5 within Supercycle wave 3. I consider this to be a very low probability outcome, but the odds of it happening are greater zero.
- If the price moves above 3231.25 (green line), the end of Primary wave 2, then Primary 2 is still underway.
- If the price moves above 3184 (blue line), the end of Minor wave 2, then Minor wave 2 is still underway.
- If the price moves below 2923.75 (red line), the beginning of Minor wave 2, then Minor wave 3 within Intermediate wave 1 within Primary wave 3 is underway and the drop below that price confirms it.
- If the price moves below 2174 (purple line), the beginning of Primary wave 2, then Primary wave 3 is definitely underway and drop below that price confirms it. I consider this to be, eventually, a very high probability.
What about my trades? My shares in SDS gain as the S&P 500 drops. I’m waiting on options trades until Intermediate
Learning and other resources. Elliott Wave International has long been the leading analytical house based on Elliott wave theory. They make available a number of free educational materials and other resources, in addition to their for-pay subscriptions.
I recommend two books, both by people associated with EWI.
First, Elliott Wave Principle by Robert Prechter and A.J. Frost is the book that, along with Prechter’s analyses, that created the revival of Elliott wave theory. I first read it in 1984, and it has had a profound influenced on my thinking about markets ever since.
Second, I’ve found Visual Guide to Elliott Wave Trading by Wayne Gorman and Jeffrey Kennedy, both of EWI, to be a useful book that relates Elliott wave theory to practical trading. The authors are hands-on Elliotticians, and for an active trader, that’s exactly what’s needed — less theory and more how-to. The first chapter of the book gives a very nice thumbnail run down of what Elliott wave theory is all about.
Terminology. Here are some links to information about some of the technical jargon I use.
Charts. On my charts, waves have a subscript showing the degree above or below the Intermediate degree. Here are the subscripts and the degree each represents:
- {+3} Supercycle
- {+2} Cycle
- {+1} Primary
- No subscript: Intermediate
- {-1} Minor
- {-2} Minute
- {-3} Minuette
By Tim Bovee, Portland, Oregon, July 9, 2020
Disclaimer
Tim Bovee, Private Trader tracks the analysis and trades of a private trader for his own accounts. Nothing in this blog constitutes a recommendation to buy or sell stocks, options or any other financial instrument. The only purpose of this blog is to provide education and entertainment.
No trader is ever 100 percent successful in his or her trades. Trading in the stock and option markets is risky and uncertain. Each trader must make trading decisions for his or her own account, and take responsibility for the consequences.
License

All content on Tim Bovee, Private Trader by Timothy K. Bovee is licensed under a Creative Commons Attribution-ShareAlike 4.0 International License.
Based on a work at www.timbovee.com.

You must be logged in to post a comment.