10:20 a.m. New York time
What’s happening now? The S&P 500 E-mini futures are continuing the decline that began on Thursday from 3284.50.
What does it mean? It means either a continuation of the correction that began March 22 from 2174 or the beginning of a new, significant decline that will carry the price well below 2174.
What does Elliott wave theory say? The significance of the declines hinges on whether Thursday’s peak was the end of Minor wave 3 or of Minor wave 5. I count it as the end of the 3rd Minor wave, but there are some ambiguities in the structure of the rise from July 9. It can also be counted as the 5th Minor.
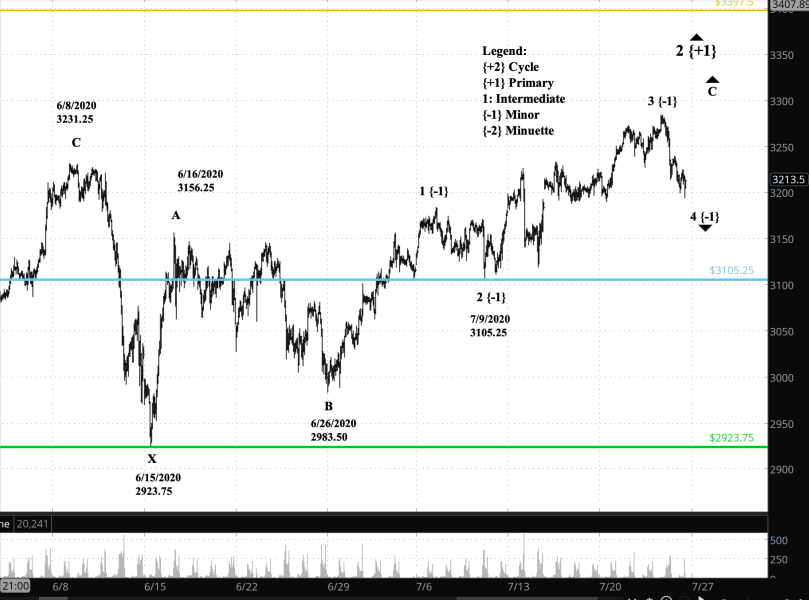
If the peak ended Minor wave 3, then we’ll see decline, although not a large one, and then a new rise to a higher high. If the peak ended Minor wave 5, then the Primary wave 2 correction may be complete and the price will show a more significant decline.
As I noted in Thursday’s Live post, there are milestones that, when passed, increase the odds that Primary 3 is underway. One is 3105.25 (blue line), the beginning of the 3rd (or 5th) wave of Minor degree. The second is 2923.75 (green line), the beginning of the three wave correction of Intermediate degree, one up from minor, that began June 15.
What is the alternative? Primary wave 2 has taken the form of a compound correction: It completed a three-wave Zigzag on June 8, and then after an X-wave reset, launched into a second three-wave Zigzag. It is possible that there will be a third correction pattern added on when the second Zigzag is complete. That would stretch the correction out for months, perhaps even into the autumn.
What about my trades? I intend no new trades until Primary wave 2 is over.
Learning and other resources. Elliott Wave International has long been the leading analytical house based on Elliott wave theory. They make available a number of free educational materials and other resources, in addition to their for-pay subscriptions.
I recommend two books, both by people associated with EWI.
First, Elliott Wave Principle by Robert Prechter and A.J. Frost is the book that, along with Prechter’s analyses, that created the revival of Elliott wave theory. I first read it in 1984, and it has had a profound influenced on my thinking about markets ever since.
Second, I’ve found Visual Guide to Elliott Wave Trading by Wayne Gorman and Jeffrey Kennedy, both of EWI, to be a useful book that relates Elliott wave theory to practical trading. The authors are hands-on Elliotticians, and for an active trader, that’s exactly what’s needed — less theory and more how-to. The first chapter of the book gives a very nice thumbnail run down of what Elliott wave theory is all about.
Terminology. Here are some links to information about some of the technical jargon I use.
Charts. On my charts, waves have a subscript showing the degree above or below the Intermediate degree. Here are the subscripts and the degree each represents:
- {+3} Supercycle
- {+2} Cycle
- {+1} Primary
- No subscript: Intermediate
- {-1} Minor
- {-2} Minute
- {-3} Minuette
By Tim Bovee, Portland, Oregon, July 24, 2020
Disclaimer
Tim Bovee, Private Trader tracks the analysis and trades of a private trader for his own accounts. Nothing in this blog constitutes a recommendation to buy or sell stocks, options or any other financial instrument. The only purpose of this blog is to provide education and entertainment.
No trader is ever 100 percent successful in his or her trades. Trading in the stock and option markets is risky and uncertain. Each trader must make trading decisions for his or her own account, and take responsibility for the consequences.
License

All content on Tim Bovee, Private Trader by Timothy K. Bovee is licensed under a Creative Commons Attribution-ShareAlike 4.0 International License.
Based on a work at www.timbovee.com.

You must be logged in to post a comment.