10 a.m. New York time
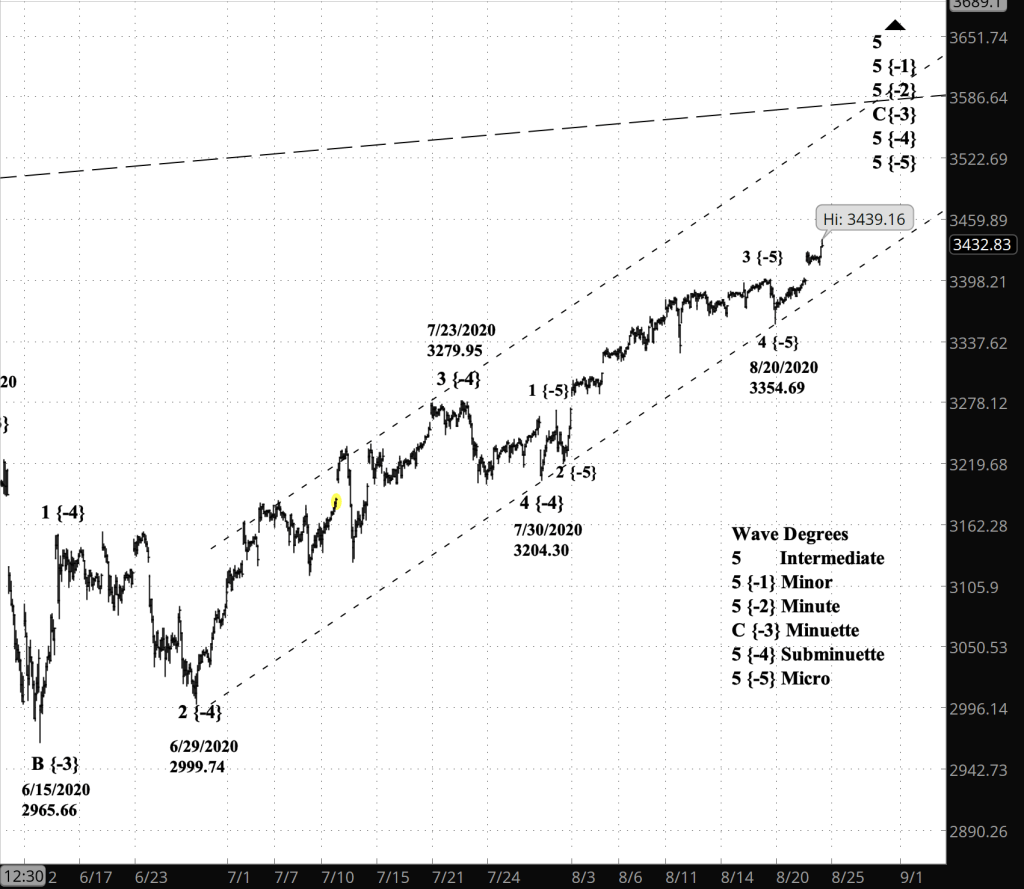
What’s happening now? The S&P 500 index moved slightly lower at mid-day Thursday, to 3,328.82, tentatively marking the end of the decline that began the day before.
What does it mean? The index has begun an upward correction within the downward move that began on Thursday. The correction will remain below 3,428.92, the starting point of the decline.
What is the alternative? It is still possible for the price to reverse and extend the correction that began September 11 from 3,310.47. I find it to be unlikely but can’t rule it out entirely.
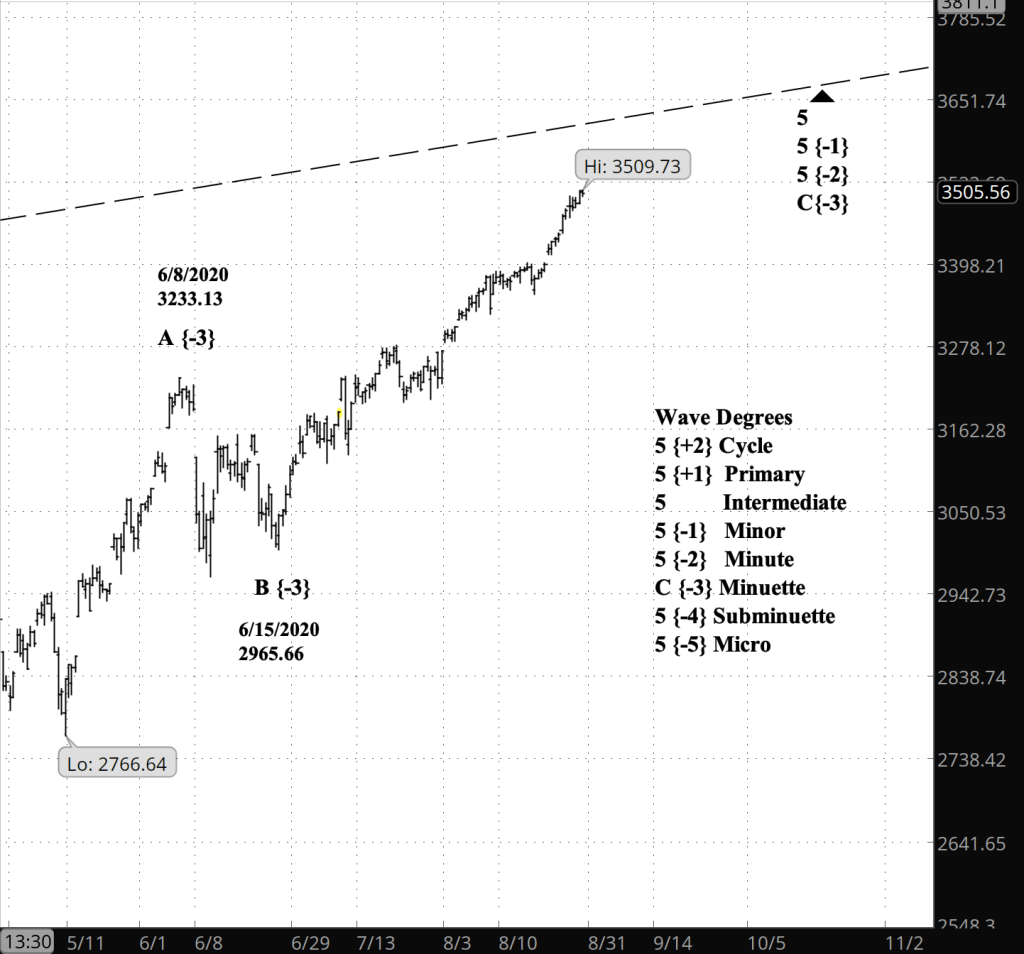
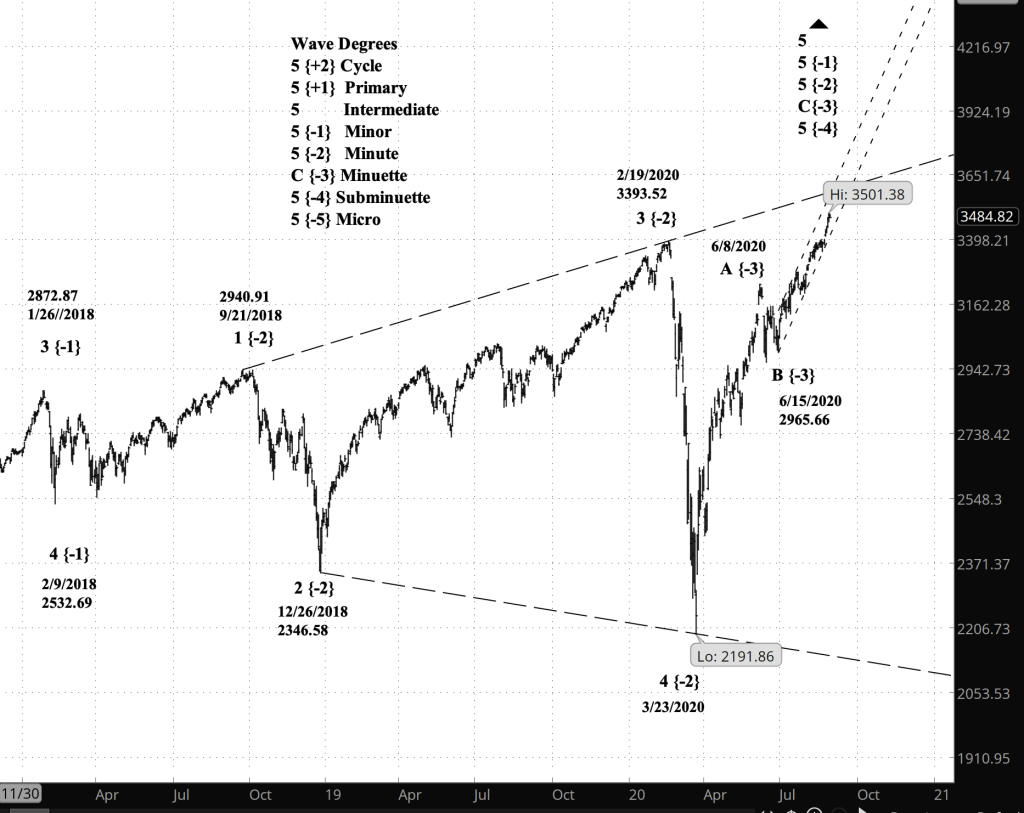
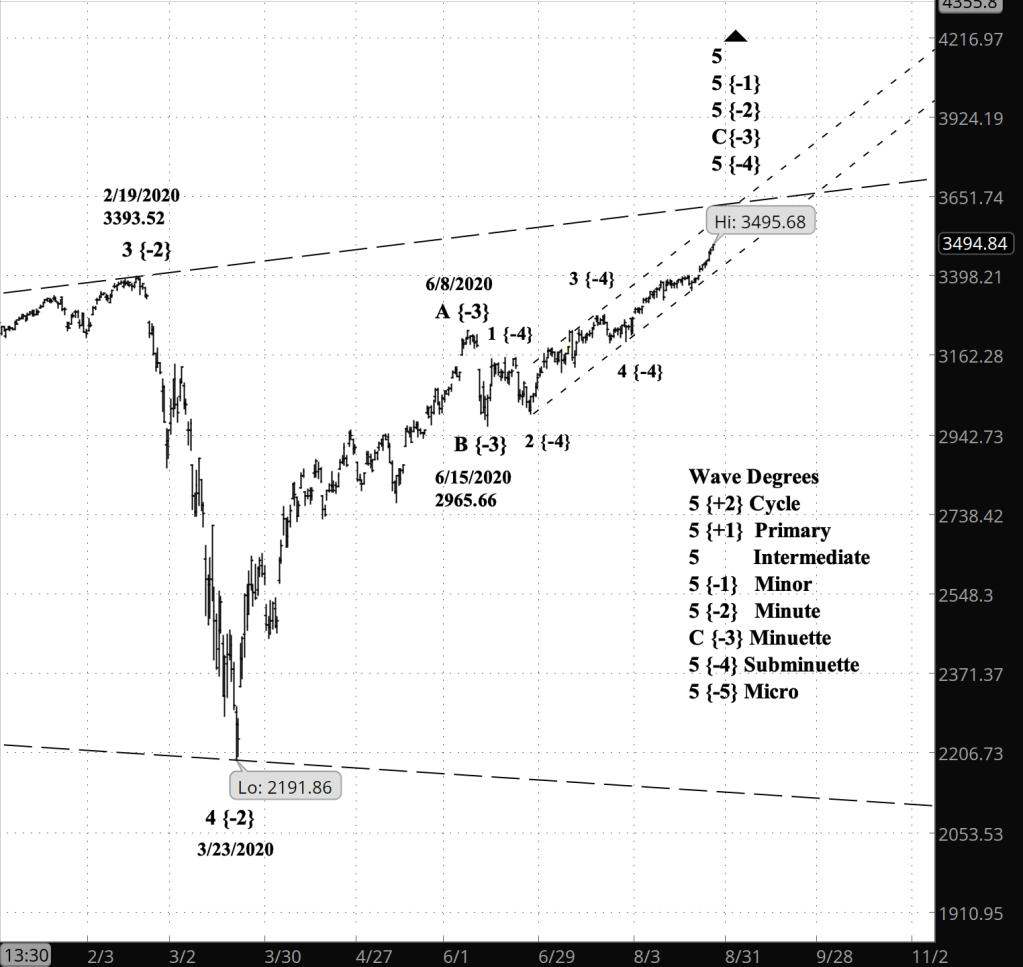
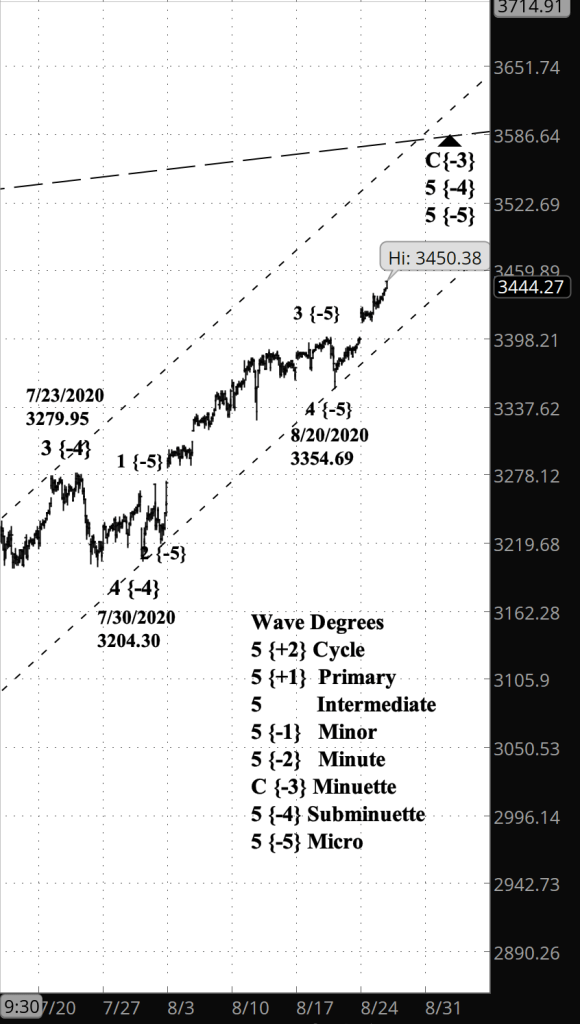
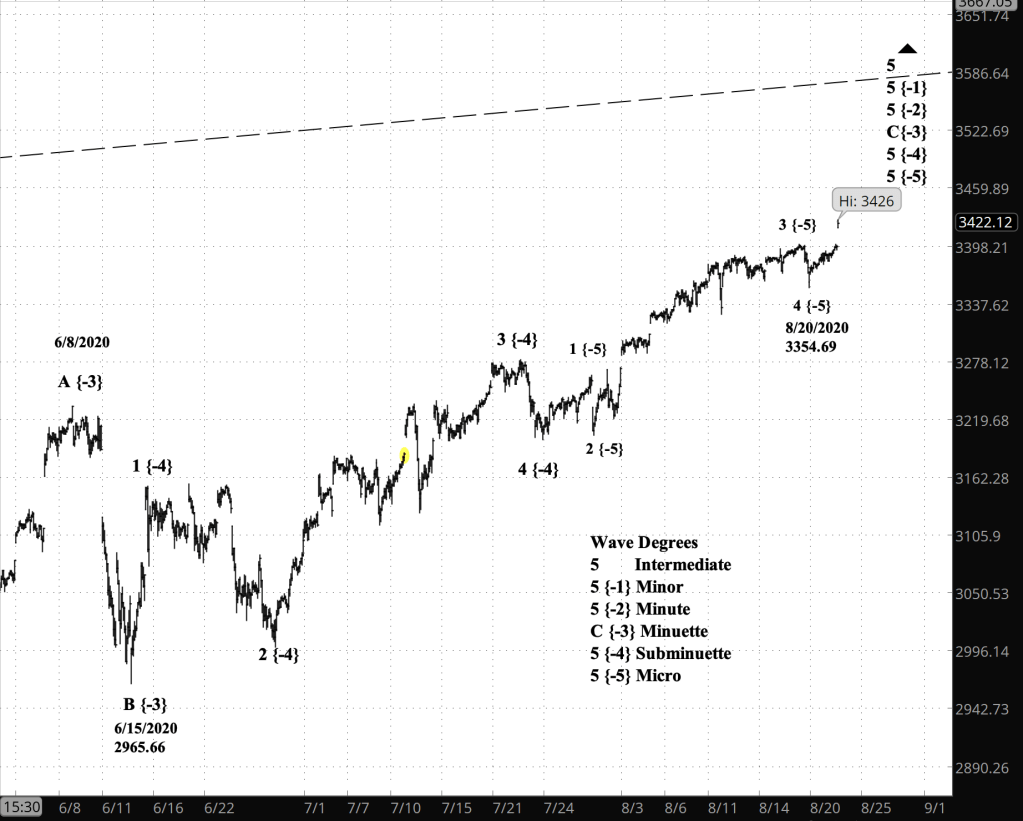
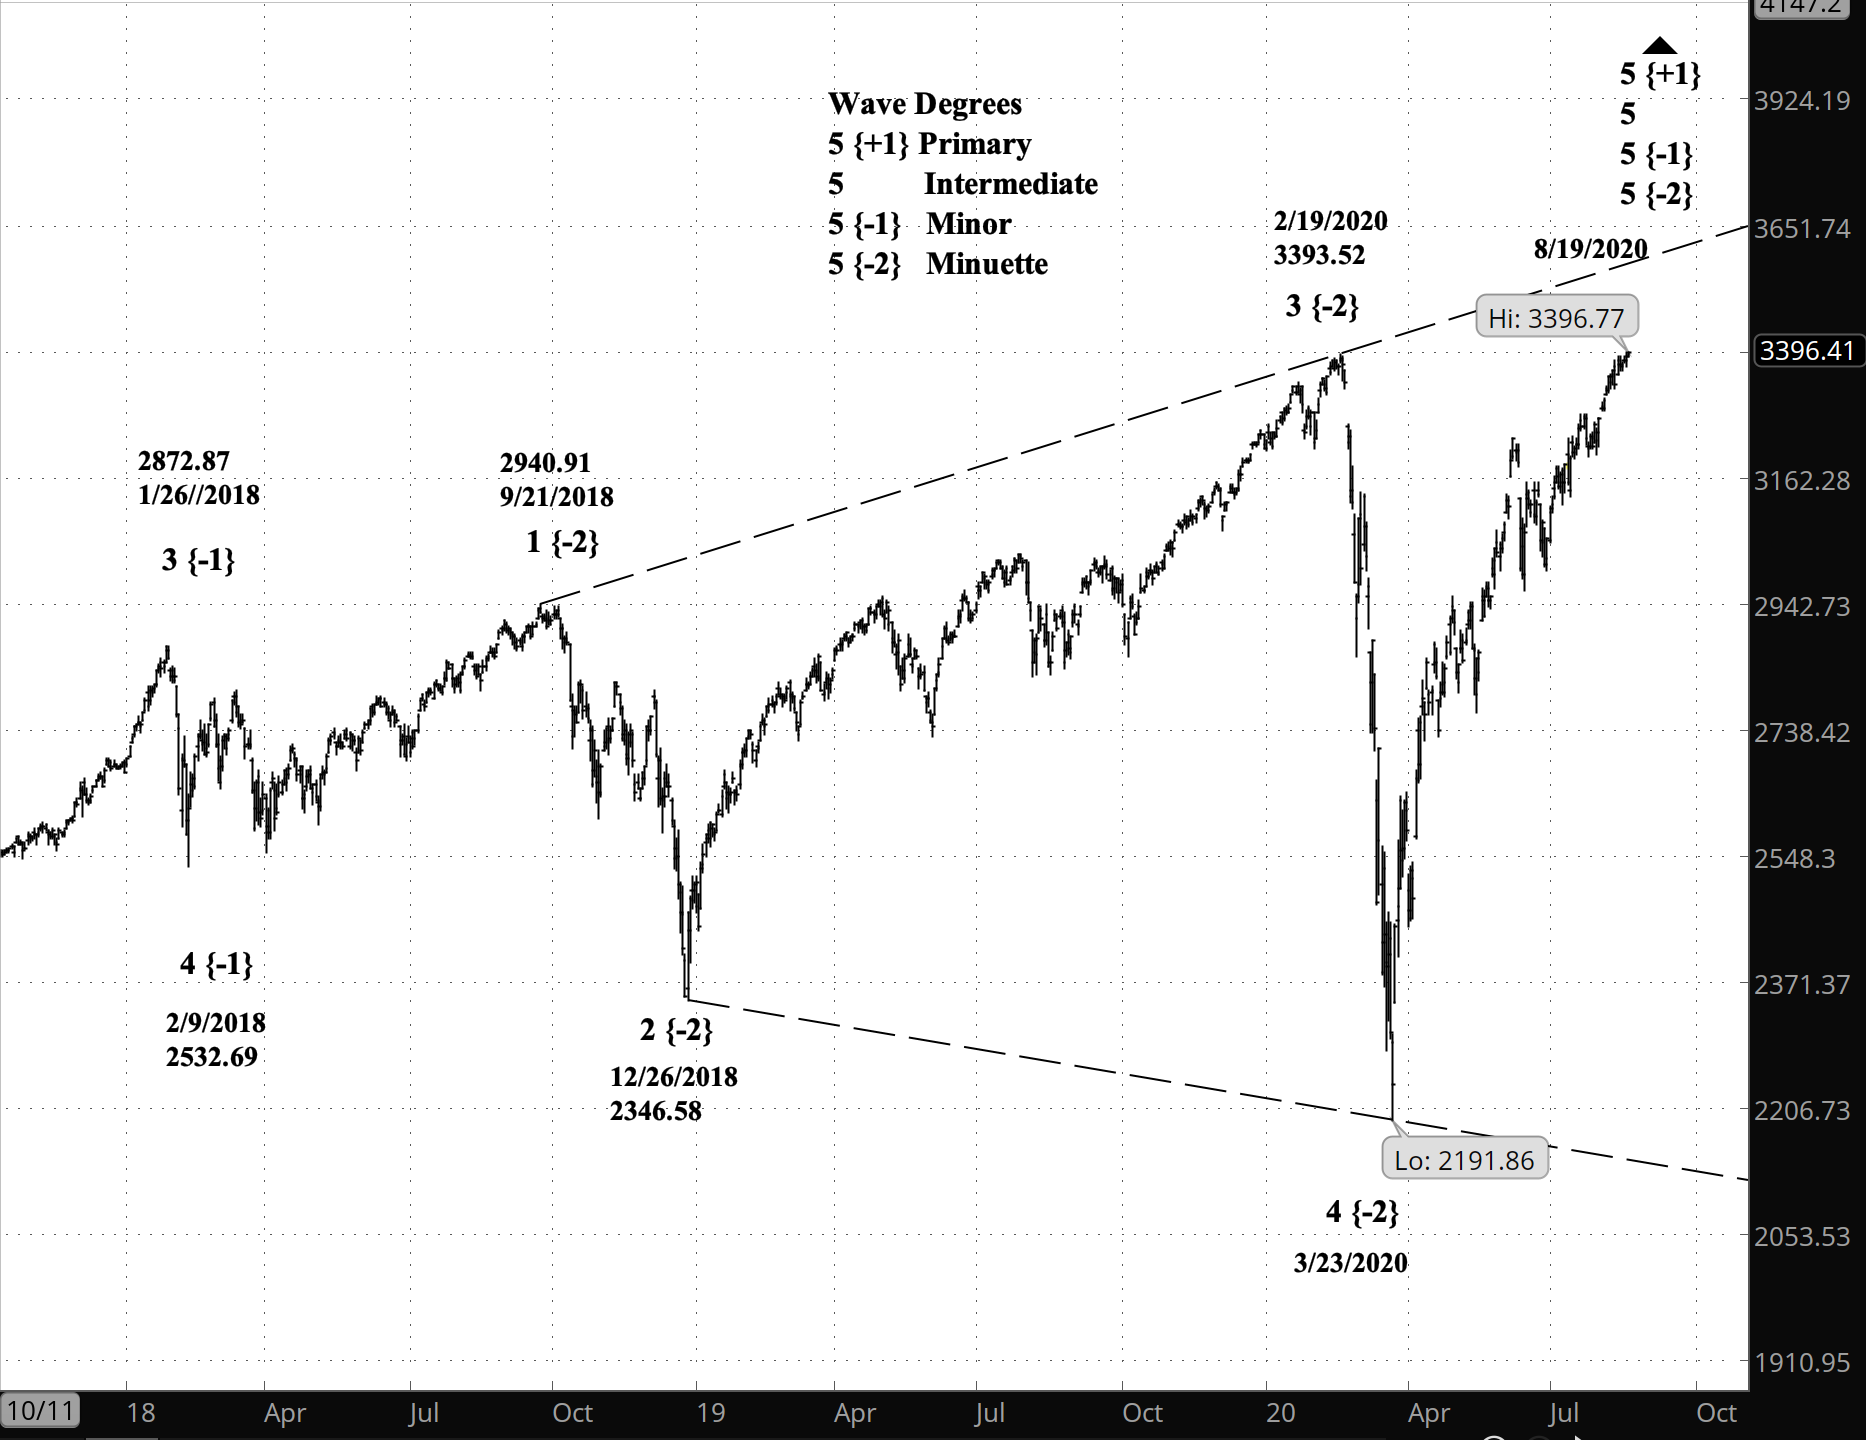
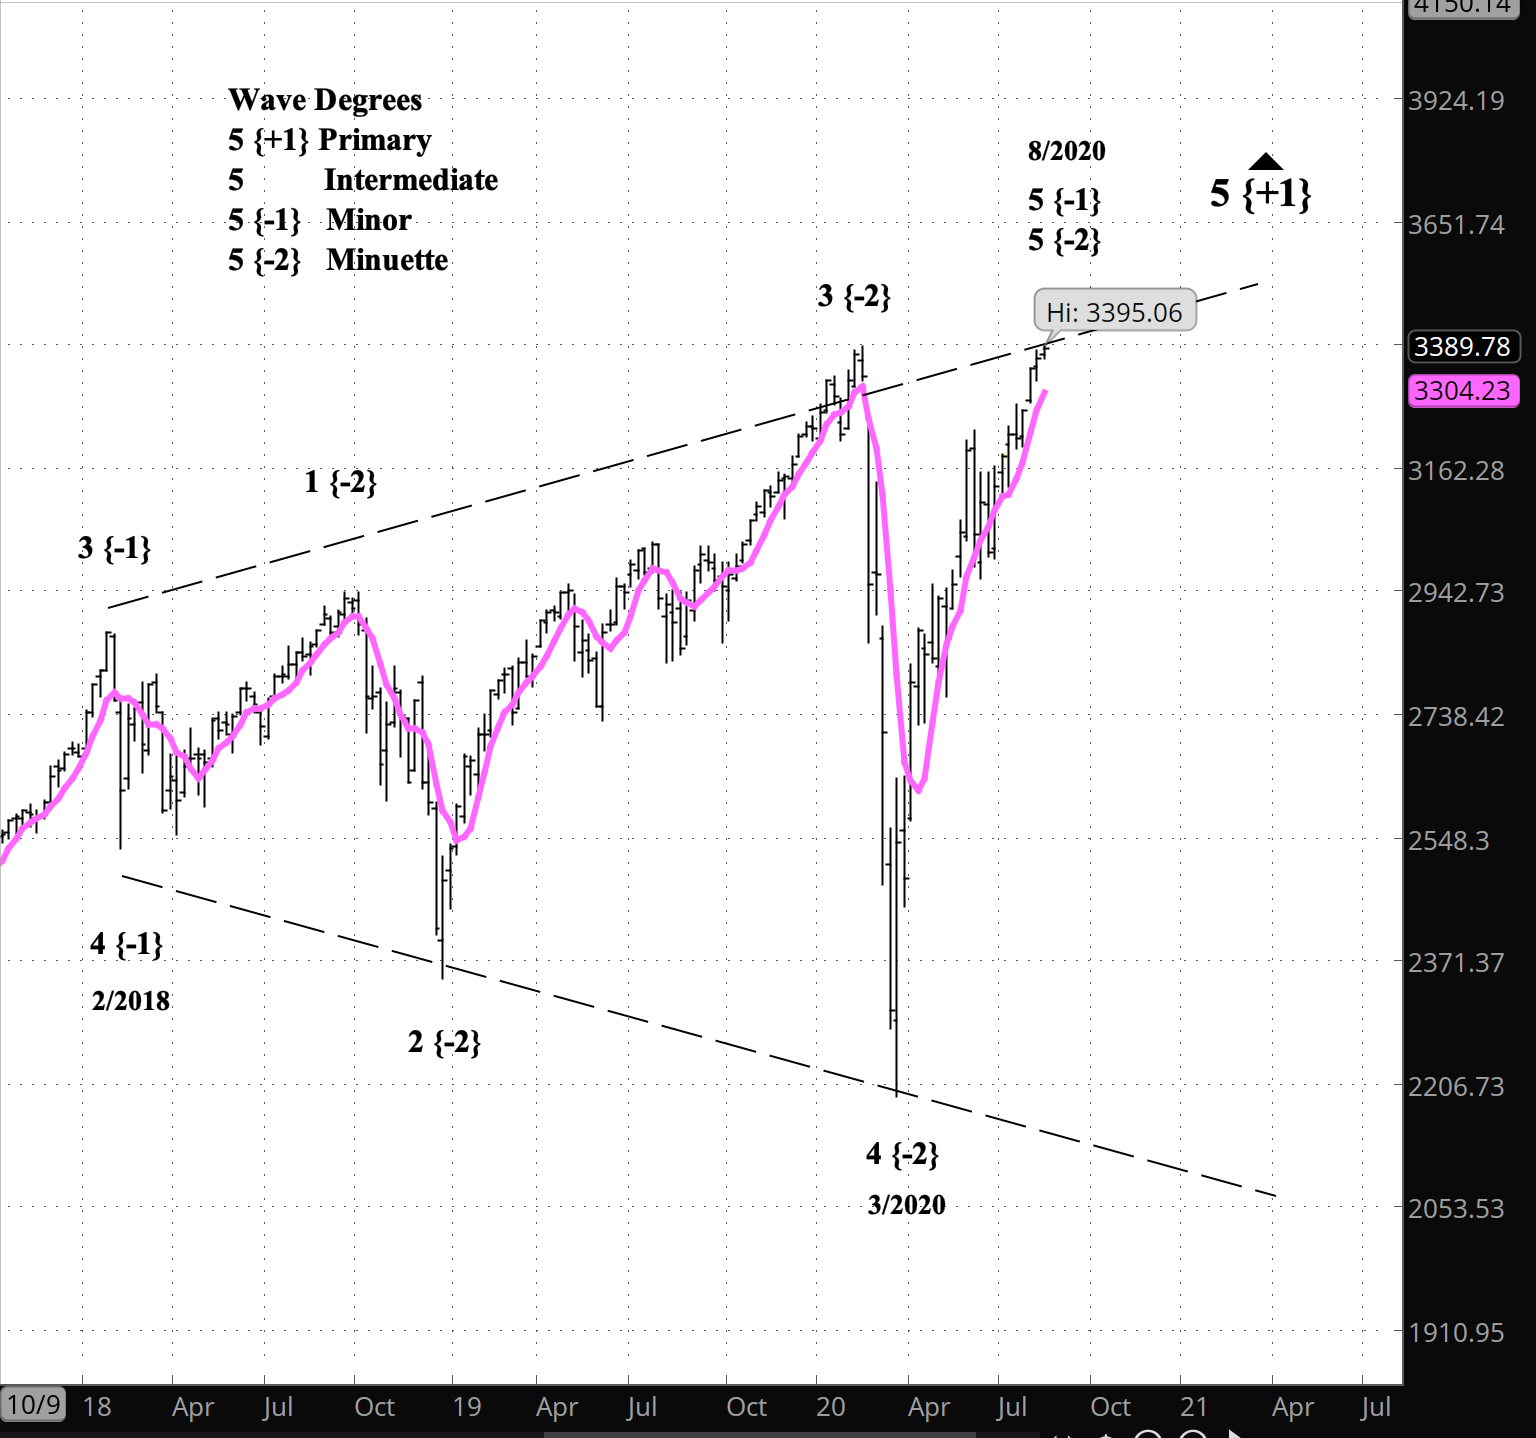
What does Elliott wave theory say? Thursday’s low begins the uptrending wave 2 of Subminuette degree within downtrending wave 3 of Minuette degree. At the Subminuette 2 will end below 3,428.92, the starting point of Minuette 3 and within it, Subminuette 1. A firm rule of Elliott wave analysis posits that a 2nd wave cannot move beyond the start of the preceding 1st wave. Subminuette 2 will be followed by Subminuette 3, which will take the price down to new lows in the decline since September 16
My trading strategy. My short iron condor options position on SPY, the exchange-traded fund based on the S&P 500, is 28 days from expiration and seven days until management day, when I take profits. It is trading at 12% of maximum potential profit, and I shall exit at 50% of max.
Also, I’m holding inverse exchange-traded fund shares on the S&P 500 (SDS is the symbol).
Learning and other resources. Elliott Wave International has long been the leading analytical house based on Elliott wave theory. They make available a number of free educational materials and other resources, in addition to their for-pay subscriptions.
I recommend two books, both by people associated with EWI.
First, Elliott Wave Principle by Robert Prechter and A.J. Frost is the book that, along with Prechter’s analyses, that created the revival of Elliott wave theory. I first read it in 1984, and it has had a profound influenced on my thinking about markets ever since.
Second, I’ve found Visual Guide to Elliott Wave Trading by Wayne Gorman and Jeffrey Kennedy, both of EWI, to be a useful book that relates Elliott wave theory to practical trading. The authors are hands-on Elliotticians, and for an active trader, that’s exactly what’s needed — less theory and more how-to. The first chapter of the book gives a very nice thumbnail run down of what Elliott wave theory is all about.
Terminology. Here are some links to information about some of the technical jargon I use.
Charts. On my charts, waves have a subscript showing the degree above or below the Intermediate degree. Here are the subscripts and the degree each represents:
- {+3} Supercycle
- {+2} Cycle
- {+1} Primary
- No subscript: Intermediate
- {-1} Minor
- {-2} Minute
- {-3} Minuette
- {-4} Subminuette
- {-5} Micro
By Tim Bovee, Portland, Oregon, December 31, 2020
Disclaimer
Tim Bovee, Private Trader tracks the analysis and trades of a private trader for his own accounts. Nothing in this blog constitutes a recommendation to buy or sell stocks, options or any other financial instrument. The only purpose of this blog is to provide education and entertainment.
No trader is ever 100 percent successful in his or her trades. Trading in the stock and option markets is risky and uncertain. Each trader must make trading decisions for his or her own account, and take responsibility for the consequences.
License
All content on Tim Bovee, Private Trader by Timothy K. Bovee is licensed under a Creative Commons Attribution-ShareAlike 4.0 International License.
Based on a work at www.timbovee.com.

You must be logged in to post a comment.