9:35 a.m. New York time
What’s happening now? The S&P 500 index continues its rise toward a trend line boundary that it will approach but likely fail to reach.
What does it mean? The uptrend since March is nearing its end and will soon reverse, beginning a significant downtrend that will eventually fall below 2191.86, the starting point on March 23 of the present rise.
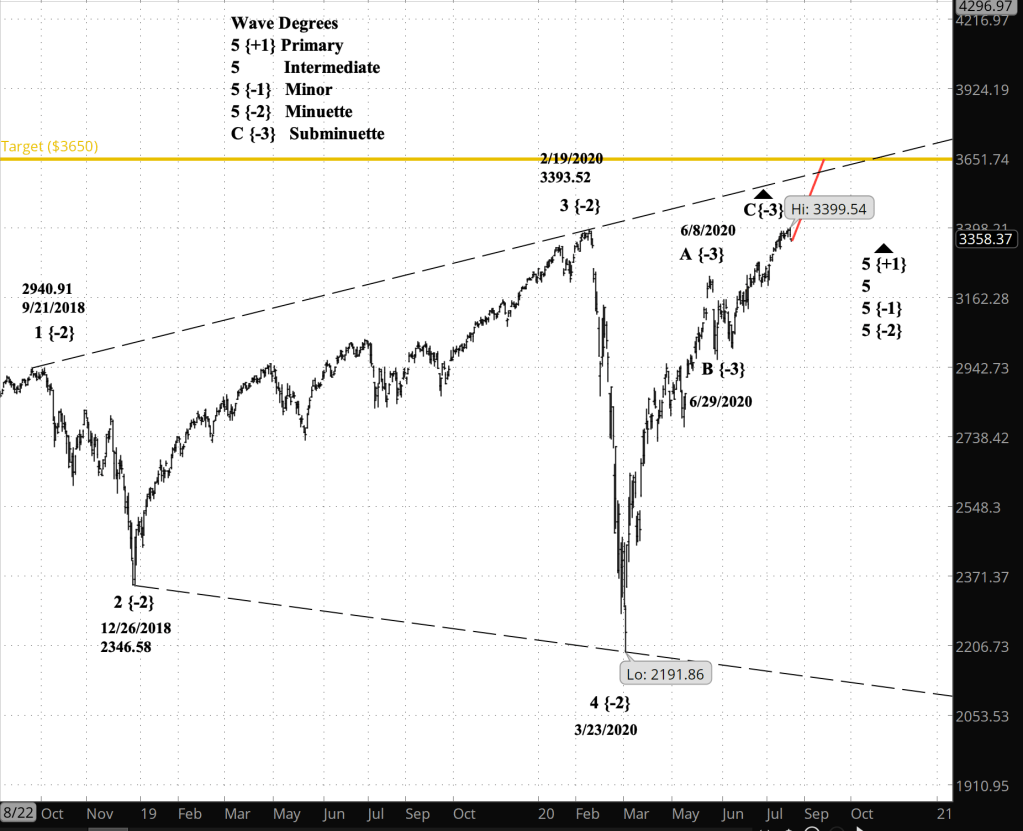
What does Elliott wave theory say? The index is in its final upward movement of Subminuette degree within a Diagonal Triangle of Minuette degree that began in September 2018.
Diagonal Triangles consist of five waves, each broader than its predecessor, each composed of three waves one degree lower. At the Subminuette degree the index is tracing a rising C wave, with a target at the triangle channel’s upper boundary.
The upper boundary of a Diagonal Triangle rises across time. The boundary level today is lower than the boundary level tomorrow.
If, for example, it takes a month for the price to reach the upper level (red line on the chart), then the boundary — the target price — will be at 3650 (gold line on the chart).
Usually, the 5th wave of a Diagonal Triangle approaches but false a bit short of the upper boundary. Also, there are no guarantees that it will take a month for the price to reach the boundary. A month is a reasonable guess.
The Elliott Wave Theory rules governing the triangle’s 5th wave are these: The 5th wave of a diagonal triangle must be longer than the 3rd wave. In this triangle, the 3rd wave ran from 2346.58 in December 2018 to 3393.52 on February 19 of the current year, a distance of 1046.94 points.
The 5th wave began at 2191.86 on March 23, and adding on the distance covered by the 3rd wave, we get a minimum reach for the 5th wave of 3238.80. And it fact it reached that level in mid-July.
The other rule is that the 5th wave must end above the end of the 3rd wave, and it in fact exceeded that level two days ago, on August 18.
What is the alternative? The S&P 500 E-mini futures continue to be out-of-synch with the index, failing to show a clear Diagonal Triangle pattern. The index and the SPY exchange-traded fund both match my principle analysis. The futures don’t.
Under my principle analysis, Cycle wave 1 to the downside will start within months, if not sooner. Under my alternative analysis, Cycle wave 1 began on February 19.
What about my trades? For options, my next window of opportunity are the October monthlies, with an entry window from August 25 through September 8, management of profitable positions on September 21 and expiration on October 16. That should align nicely with the completion of the 5th wave of the triangle. Knock on wood.
For shares, I shall continue to hold my presently losing positions in the expectation that the Cycle wave 5 will return them to profitability.
Learning and other resources. Elliott Wave International has long been the leading analytical house based on Elliott wave theory. They make available a number of free educational materials and other resources, in addition to their for-pay subscriptions.
I recommend two books, both by people associated with EWI.
First, Elliott Wave Principle by Robert Prechter and A.J. Frost is the book that, along with Prechter’s analyses, that created the revival of Elliott wave theory. I first read it in 1984, and it has had a profound influenced on my thinking about markets ever since.
Second, I’ve found Visual Guide to Elliott Wave Trading by Wayne Gorman and Jeffrey Kennedy, both of EWI, to be a useful book that relates Elliott wave theory to practical trading. The authors are hands-on Elliotticians, and for an active trader, that’s exactly what’s needed — less theory and more how-to. The first chapter of the book gives a very nice thumbnail run down of what Elliott wave theory is all about.
Terminology. Here are some links to information about some of the technical jargon I use.
Charts. On my charts, waves have a subscript showing the degree above or below the Intermediate degree. Here are the subscripts and the degree each represents:
- {+3} Supercycle
- {+2} Cycle
- {+1} Primary
- No subscript: Intermediate
- {-1} Minor
- {-2} Minute
- {-3} Minuette
By Tim Bovee, Portland, Oregon, August 20, 2020
Disclaimer
Tim Bovee, Private Trader tracks the analysis and trades of a private trader for his own accounts. Nothing in this blog constitutes a recommendation to buy or sell stocks, options or any other financial instrument. The only purpose of this blog is to provide education and entertainment.
No trader is ever 100 percent successful in his or her trades. Trading in the stock and option markets is risky and uncertain. Each trader must make trading decisions for his or her own account, and take responsibility for the consequences.
License
All content on Tim Bovee, Private Trader by Timothy K. Bovee is licensed under a Creative Commons Attribution-ShareAlike 4.0 International License.
Based on a work at www.timbovee.com.

[…] Alternatives? Trades? See yesterday’s post. […]
LikeLike