10 a.m. New York time
What’s happening now? The continued rise of the S&P 500 E-mini futures have lowered the odds that a significant decline has begun.
What does it mean? That downward move will be as the next major move on the chart, but not yet.
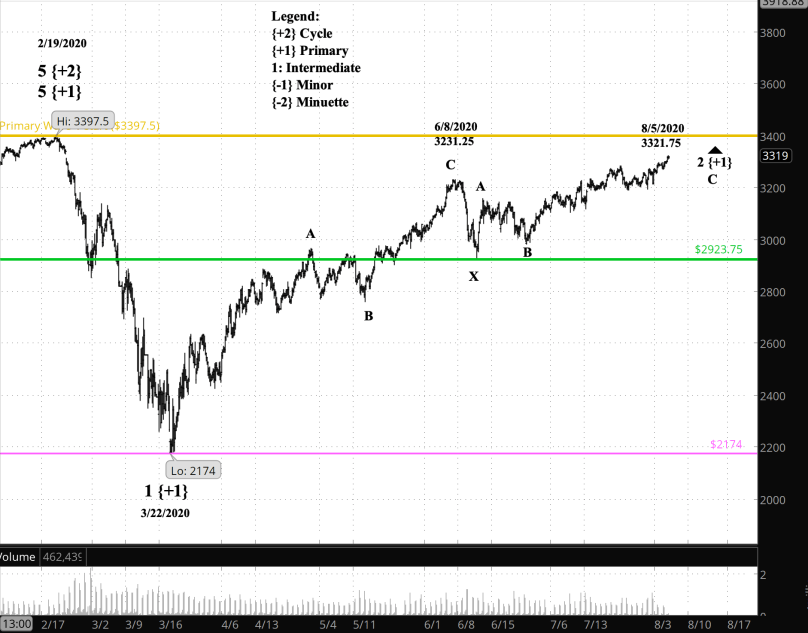
What does Elliott wave theory say? The rise increases the likelihood that Primary wave 2 is still underway. That’s the upward correction that began March 22 from 2174 and this morning reached a new high of 3321.75. I’m promoting my alternative count to the principle count.
Within Primary 2, my count places the price in the late stages of Intermediate wave C. The end of the C wave is likely to be the end of Primary 2.
The price must remain below 3397.50 (gold line), which was the starting point of Primary wave 1 back in February. A break above that level would force a recount of the entire chart since February.
A move below the bottom of the last X wave at 2923.75 (green line), which connects patterns in a compound corrective structure, would increase the odds that Primary wave 3 has begun.
A move below 2174 (purple line), the end of Primary wave 1, would provide certainty that Primary wave 3 has begun.
What is the alternative? It’s still possible that Primary wave 3 began on June 8 from 3231.25, which is my former principle count. It’s also possible that Primary 2 is underway and will extend of a third corrective pattern; the first two were Zigzags.
What about my trades? I’m back on hold with my trades until the chart shows, as my principle count, that Primary wave 3 is has begun.
Learning and other resources. Elliott Wave International has long been the leading analytical house based on Elliott wave theory. They make available a number of free educational materials and other resources, in addition to their for-pay subscriptions.
I recommend two books, both by people associated with EWI.
First, Elliott Wave Principle by Robert Prechter and A.J. Frost is the book that, along with Prechter’s analyses, that created the revival of Elliott wave theory. I first read it in 1984, and it has had a profound influenced on my thinking about markets ever since.
Second, I’ve found Visual Guide to Elliott Wave Trading by Wayne Gorman and Jeffrey Kennedy, both of EWI, to be a useful book that relates Elliott wave theory to practical trading. The authors are hands-on Elliotticians, and for an active trader, that’s exactly what’s needed — less theory and more how-to. The first chapter of the book gives a very nice thumbnail run down of what Elliott wave theory is all about.
Terminology. Here are some links to information about some of the technical jargon I use.
Charts. On my charts, waves have a subscript showing the degree above or below the Intermediate degree. Here are the subscripts and the degree each represents:
- {+3} Supercycle
- {+2} Cycle
- {+1} Primary
- No subscript: Intermediate
- {-1} Minor
- {-2} Minute
- {-3} Minuette
By Tim Bovee, Portland, Oregon, August 5, 2020
Disclaimer
Tim Bovee, Private Trader tracks the analysis and trades of a private trader for his own accounts. Nothing in this blog constitutes a recommendation to buy or sell stocks, options or any other financial instrument. The only purpose of this blog is to provide education and entertainment.
No trader is ever 100 percent successful in his or her trades. Trading in the stock and option markets is risky and uncertain. Each trader must make trading decisions for his or her own account, and take responsibility for the consequences.
License

All content on Tim Bovee, Private Trader by Timothy K. Bovee is licensed under a Creative Commons Attribution-ShareAlike 4.0 International License.
Based on a work at www.timbovee.com.

You must be logged in to post a comment.